 Open Access Article
Fast, efficient and clean adsorption of bisphenol-A using renewable mesoporous silica nanoparticles from sugarcane waste ash†
Suzimara Rovani *a,
Jonnatan J. Santos
 b,
Sabine N. Guilhen
 a,
Paola Coriob and
Denise A. Fungaro
 a
a
aInstituto de Pesquisas Energéticas e Nucleares, IPEN-CNEN/SP, Av. Prof. Lineu Prestes, 2242 Cidade Universitária, São Paulo, SP CEP 05508-000, Brazil. E-mail: suzirovani@gmail.com
bInstituto de Química, Universidade de São Paulo, Av. Prof. Lineu Prestes, 748 Cidade Universitária, São Paulo, SP CEP 05508-000, Brazil
First published on 23rd July 2020
Abstract
Even with all the biological problems associated with bisphenol-A (BPA), this chemical is still being widely used, especially in thermal paper receipts. In this study, renewable mesoporous silica nanoparticles (MSN), obtained from sugarcane ash, functionalized with hexadecyltrimethylammonium (CTAB) were applied as an adsorbent in the removal of BPA from the aqueous solution. The versatility of this material and its BPA adsorption capacity were tested at different pH values, being practically constant at pH between 4 and 9, with a slight increase in pH 10 and a greater increase in pH 11. The removal time evaluation indicates a very fast adsorption process, removing almost 90% of BPA in the first 20 min of contact. The kinetic model indicates a monolayer formation of BPA molecules on the MSN-CTAB surface. The maximum adsorption capacity (Qmax) was 155.78 mg g−1, one of the highest found in literature, and the highest for material from a renewable source.
1. Introduction
Bisphenol-A (BPA) is an endocrine disruptive compound (EDC) that may mimic or interfere with the endocrine or hormonal system.1 BPA was first synthesized in 1891 by Dianin2 but its synthesis was first reported only in 1905 by Zincke.3 BPA was widely used in the manufacture of thermal paper,4 food storage containers, baby bottles, reusable drink containers, toys, dish and laundry detergents, bar soaps, shampoo, shaving cream, face cleansers, sunscreen lotions, etc.5 Some effects of BPA on health are sexual dysfunction and fertility; metabolic disease, such as, obesity; cancer (breast cancer, neuroblastoma); neurological effects (disruption of the dopaminergic system); cardiovascular diseases; thyroid disorders and asthma.1,6 BPA can also alter plasma sex hormones levels in fishes7 and cause adverse effects in the development and reproduction of the non-mammalian aquatic vertebrates, including reduced male hormones, testicular cell death, decreased sperm density and motility, inhibition of spermatogenesis and egg production.8Nowadays most plastic containers and personal care products are produced without BPA. However, aquatic bodies are still contaminated with bisphenol-A. The EDC can arrive in river waters from discharging industrial waste, in groundwater by leaching dump sites (mainly leaching from BPA-based plastics or microplastics)9 and in tap water because conventional wastewater treatment processes are not completely efficient.10,11 However, the biggest concern is that even though the problems caused by BPA it is still widely used, especially in thermal paper receipts.4,12
Many researchers have investigated the BPA removal by adsorption using different adsorbents, such as clays,13,14 zeolites,15,16 chitosan,17,18 and agricultural wastes.19,20
A decade ago, Dong et al. 2010 (ref. 21) prepared zeolite from coal fly ash with low and high CaO content. In order to improve the adsorption of organic pollutants, the researchers modified the zeolites with the surfactant hexadecyltrimethylammonium (CTAB). The sample with a high Ca content reached the highest capacity for the removal of bisphenol-A. Later, Zhang et al. 2017 (ref. 22) synthesized SiO2 from tetraethyl orthosilicate by a sol–gel method, modified it with CTAB and applied to adsorb BPA. The prepared adsorbent had a core/shell structure (core = CTAB micelle) and (shell = SiO2). The results of this study indicated that the CTAB-core of the adsorbent had a dominant role in increasing the BPA removal capacity.
Considering these known properties of adsorbents modified with CTAB, in 2018, we reported for the first time, the synthesis of silica nanoparticles from sugarcane waste ash modified with CTAB. In that publication, we did a complete characterization of the material. The material's morphology was demonstrated by electron and transmission microscopy, the surface area was provided by BET method, pore size and shape were obtained by N2 adsorption–desorption isotherm, pore distribution by BJH method and the amount of CTAB on the silica particles was given by thermogravimetric analyses.23 In this article, we go further with these renewable mesoporous silica nanoparticles, applying them to the adsorption/removal of BPA in aqueous solution. The effects of the various adsorption parameters, such as solution pH, contact time, and initial concentration of the BPA solution were studied and optimized.
2. Experimental
2.1. Materials
All aqueous solutions were prepared using deionized water (resistivity > 18.2 MΩ cm) obtained from a MilliQ deionizer (Elix Millipore). Sodium hydroxide micropearls (>99%), hydrochloric acid (35–37%), and n-butyl alcohol (>99%) were purchased from Synth, Brazil. Sulfuric acid (95–97%) and CTAB (≥98%) were purchased from Merck, Germany. Bisphenol-A was purchased from Sigma-Aldrich, United States of America. Sugarcane waste ash was donated by COSAN S. A., Brazil.2.2. Methods
Briefly, in a round bottom flask, CTAB (2%, w:w) was dissolved in a mixture of water and butyl alcohol (1![[thin space (1/6-em)]](https://www.rsc.org/images/entities/char_2009.gif) :
:![[thin space (1/6-em)]](https://www.rsc.org/images/entities/char_2009.gif) 1, v/v) and heated to 60 °C. To this biphasic system, the sodium silicate solution (concentration 5.42%, w:w) obtained from sugarcane waste ash (as previously reported23–25) was added, under constant agitation. Then, a solution of sulfuric acid (0.5 mol L−1) was added to this solution, drop by drop, until the pH decreased to 4, and the resulting gel was aged at 60 °C for 8 h. The gel of silica nanoparticles aged was washed with distilled water, filtered and oven dried at 120 °C.23
1, v/v) and heated to 60 °C. To this biphasic system, the sodium silicate solution (concentration 5.42%, w:w) obtained from sugarcane waste ash (as previously reported23–25) was added, under constant agitation. Then, a solution of sulfuric acid (0.5 mol L−1) was added to this solution, drop by drop, until the pH decreased to 4, and the resulting gel was aged at 60 °C for 8 h. The gel of silica nanoparticles aged was washed with distilled water, filtered and oven dried at 120 °C.23
The amount of BPA removal was expressed as the removal percentage of contaminants and calculated by the eqn (1).
 | (1) |
 | (2) |
The adsorption kinetics of BPA by MSN-CTAB, were tested using pseudo-first order28,29 and pseudo-second order30–32 models.33–35 The Langmuir,36 Freundlich37 and Liu models were applied to fit the equilibrium data.35 See the equations in ESI.†
2.3. Characterization
UV-vis spectra of samples, before and after BPA adsorption, were obtained using a Varian spectrophotometer, model Cary 1E (USA), utilizing quartz cuvettes with 10.0 mm path length, and scanning samples from 200 to 400 nm.Fourier-transform infrared (FTIR) spectroscopy was performed using a spectrometer from Bruker, model Alpha (Germany), operating in attenuated total reflectance (ATR) mode. The spectra of samples were obtained using 200 cumulative scans, in the range of 375 to 4000 cm−1.23
Thermogravimetric analyses were recorded in a thermogravimetric analyser TGA/SDTA from Mettler Toledo. Then, ∼10.0 mg was weighed and analysed under an oxygen atmosphere with a flow of 50.0 mL min−1, using an alumina-port sample heated to 900 °C with a heating rate of 10 °C min.23,25 To obtain FTIR-ATR spectra and TG curves of MSN-CTAB after an interaction with BPA, the MSN-CTAB were isolated by centrifugation, dried for 5 h at 100 °C, and analysed.23
3. Results and discussion
The relative high solubility of this molecule or monomer, if analysed its application in the production of polymers, in water for an organic compound is a major concern (120–300 mg L−1 (21.5 °C)), especially from the hormonal point of view, as already mentioned.10,11,38 In aqueous media with higher alkalinity, the solubility of BPA tends to increase, due to the dissociation of hydroxyl groups in its structure (Fig. 1).The elimination of BPA using adsorbents creates the need to use an adsorbent capable of maintaining its properties at different pH values, without losing its adsorptive capacity. Fig. 2 shows a study of the effect of pH on BPA adsorption by MSN-CTAB.
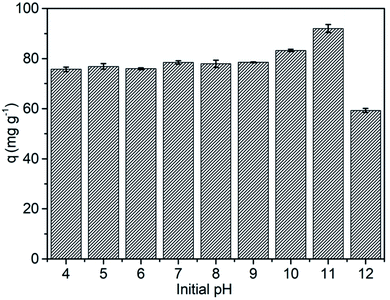 | ||
| Fig. 2 Effect of the initial pH on the adsorption capacity of BPA. Conditions: 25 °C, initial concentration 100 mg L−1, contact time 2 h and adsorbent mass 1.0 g L−1 (see Fig. S2 and Table S1†). | ||
As previously described,23 the renewable adsorbent (MSN-CTAB) used in this study is composed of nanoparticles with a size around 20 nm (Fig. S1†), specific surface area 131 m2 g−1 (measured by BET), pore diameter of 22 nm (mesoporous materials) and CTAB composition estimated in 30%.23 The results in Fig. 2 shows that the MSN-CTAB adsorption capacity for BPA adsorption was practically constant at pH values from 4 to 9 (75.74 to 78.54 mg g−1), with a significant increase in adsorption capacity (83.28 mg g−1) at pH 10 and the highest adsorption capacity (91.98 mg g−1) at pH 11 (see Table S1†). On the other hand, at pH values higher than 12, a decrease in the adsorbent adsorption capacity was observed, this occurs because the silica nanoparticles dissolve in alkaline media where the pH is higher than 12.39
Interestingly, the increase in the adsorption capacity of MSN-CTAB coincided with the increase in BPA solubility, making its use attractive regardless of the pH of the medium.
Therefore, when the pH value of the BPA solution is below its pKa values the BPA adsorption on MSN-CTAB occurs basically by hydrophobic interaction. And when the pH value of the BPA solution is between 9.6 to 11.3 the BPA adsorption on MSN-CTAB occurs also by electrostatic interaction, because MSN-CTAB has a higher affinity for anions when compared to the undissociated form of BPA.22 At pH 11, BPA is mostly in the form of a bivalent anion. In this condition, it's likely that two CTAB molecules interact with one BPA molecule.
According to the literature, the interaction of the BPA anion occurs with the CTAB surfactant positively charged “head” in the inner layer, with the two BPA benzene rings pointing to the interior of the CTAB bilayers. When interacting with each surfactant layer, the two BPA benzene rings point into the CTAB hydrophobic phase, as this orientation allows the hydrophobic interaction between the BPA benzene ring and the CTAB 16-carbon tail, thus enhancing and thus enhances BPA adsorption,21 as illustrated in Fig. 3.
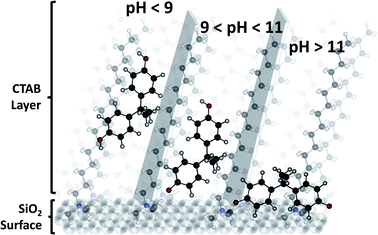 | ||
| Fig. 3 Scheme illustrating the organization of BPA on the surface of MSN-CTAB at different pH values. | ||
Trying to exploit the maximum capacity of the adsorbent, a more complete study of bisphenol-A adsorption by MSN-CTAB was performed at pH 11. The BPA calibration curve at pH 11 is shown in Fig. S3 (ESI).†
The adsorption kinetics study can provide multiple information about the adsorption velocity, the mechanism involving the adsorbent binding and the adsorption capacity of the material.
The rate of adsorption generally depends on the physicochemical characteristics of the adsorbate, adsorbent and solution, in which case the surfactant (used to mediate synthesis and modify silica nanoparticles) plays an important role. This surfactant has a positive charge. Kinetic results of BPA adsorption at 25 °C, at a contact time ranging from 0 to 180 min, for an initial concentration of 80.9 mg L−1 are shown in Fig. 4.
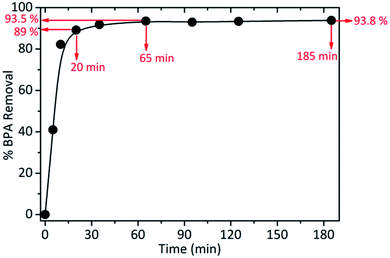 | ||
| Fig. 4 Percentage of BPA removal at 25 °C, at a contact time ranging from 0 to 180 min (initial concentration of 80.9 mg L−1). | ||
Analysing the experimental results, it is possible to notice that the adsorption process occurs very quickly in the first 20 minutes (reaching 89% of BPA adsorption), almost reaching saturation in 1 h (see Fig. S4b and Table S2†).
Considering that the process was carried out in batch, it is evident that BPA has a great affinity for this material (MSN-CTAB), since the adsorbent–adsorbate contact is not induced and occurs naturally.
This process could be improved by preparing membranes or columns for solid-state separation with MSN-CTAB and allowing the solution to pass through this material. The kinetic results were fit using pseudo first28 and pseudo second30 order models35 (see the equations in ESI†). The solid samples obtained after adsorption (MSN-CTAB + BPA), were analysed via FTIR and TGA, as can be seen in Fig. 5.
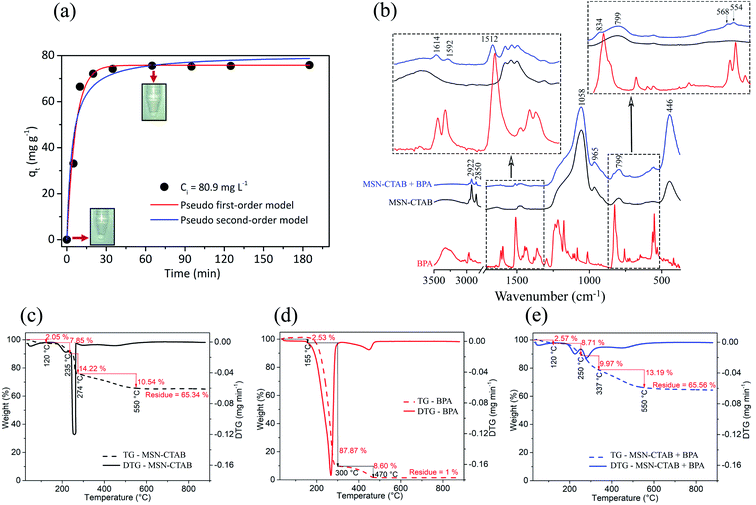 | ||
| Fig. 5 (a) Pseudo first and second-order models kinetics plot for the removal of BPA by MSN-CTAB. Conditions: 25 °C, initial concentration 80.9 mg L−1 and adsorbent mass 1.0 g L−1 (more details in Table S3†). (b) FTIR-ATR spectra of bisphenol-A, MSN-CTAB and MSN-CTAB + bisphenol-A. And TG and DTG curves of (c) MSN-CTAB, (d) BPA and (e) MSN-CTAB + BPA. The measures were performed under an oxygen atmosphere (more details in Fig. S6 and Table S5†). | ||
Considering the tested kinetic models, it is possible to observe a better fit for the pseudo-first-order model due to the higher Rajd.2 value (0.9784), and lower chi-square (X2) value (0.000519), Fig. 5a and Table S3.† Elovich and fractional power models40 were also tested (Fig. S5 and Table S4†), however, the pseudo-first-order model remains the model that best fits the experimental data. The main reason that the fit of the curve, even for pseudo-first-order, is not perfect is in the adsorption kinetics, which seems to be very fast and the method used to measure the adsorption speed (UV-vis spectroscopy) very simple, which can generate some error. The calculated qe value of the pseudo-first-order model was close to that found experimentally (Table S3†).
Kinetic models are important to describe the mechanism associated with the adsorption process of the analyte in the adsorbent, and are not associated with the system stoichiometry. In this case, this process may be related to the process of monolayer formation of BPA molecules on the MSN-CTAB surface.
In order to investigate the chemical composition of the MSN-CTAB, bisphenol-A and BPA adsorbed on the adsorbent, measurements were performed by FTIR spectroscopy. ATR mode infrared spectra of these samples are shown in Fig. 5b. The MSN-CTAB adsorbent has six major bands. The presence of CTAB in the silica structure is observed from the symmetrical and asymmetrical CH2 stretching bands at 2850 and 2922 cm−1, respectively. The bands at 799, 446 cm−1 are related to symmetrical stretching of the siloxane group, the strong band at 1058 cm−1 is attributed to the asymmetrical stretching of siloxane group and finally the band at 965 cm−1 is related to angular deformation –OH of silanol.25
The “blue” spectrum in Fig. 5b is from BPA adsorbed on the MSN-CTAB adsorbent, the bands at 568 and 554 cm−1 are mainly due to C–O and C–C. The band at 834 cm−1 is attributed to the ![[double bond, length as m-dash]](https://www.rsc.org/images/entities/char_e001.gif) C–H out of plane deformation vibration, sets replacement pattern. The band at 1512 cm−1 is the result of the H–C–H interaction. Finally, the bands at 1592 and 1614 cm−1 are related to the absorption of aromatic compounds, C
C–H out of plane deformation vibration, sets replacement pattern. The band at 1512 cm−1 is the result of the H–C–H interaction. Finally, the bands at 1592 and 1614 cm−1 are related to the absorption of aromatic compounds, C![[double bond, length as m-dash]](https://www.rsc.org/images/entities/char_e001.gif) C aromatic stretch vibrations. Harmonic bands at 1592 and 1614 cm−1 define ring replacement pattern.41 The changes in the MSN-CTAB infrared spectra after the adsorption of BPA (“blue” spectrum in Fig. 5b) are in agreement with previous findings in the literature,21 which suggested that the interaction mechanism between BPA and CTAB involved the phenolic hydroxyl groups and the positively charged quaternary ammonium (see Fig. 3). The adsorption of BPA over MSN-CTAB (in pH 11) was mainly due to electrostatic interactions between the BPA negatively charged (–O−) and the cationic micelle of the adsorbent.22
C aromatic stretch vibrations. Harmonic bands at 1592 and 1614 cm−1 define ring replacement pattern.41 The changes in the MSN-CTAB infrared spectra after the adsorption of BPA (“blue” spectrum in Fig. 5b) are in agreement with previous findings in the literature,21 which suggested that the interaction mechanism between BPA and CTAB involved the phenolic hydroxyl groups and the positively charged quaternary ammonium (see Fig. 3). The adsorption of BPA over MSN-CTAB (in pH 11) was mainly due to electrostatic interactions between the BPA negatively charged (–O−) and the cationic micelle of the adsorbent.22
Fig. 5c–e shows only the TG curves of studied samples. The TG curve of MSN-CTAB (Fig. 5c) shows a first weight loss until 120 °C (2.05%) due to humidity loss, a second loss between 120 and 235 °C (7.85%) attributed to CTAB decomposition unbound on the MSN-CTAB (hydrophobic–hydrophobic interactions of interconnected CTAB). Still in Fig. 5c a third loss between 235 and 274 °C (14.22%) is related to the CTAB decomposition bound on the MSN-CTAB by electrostatic interaction.23,42 Finally the fourth loss between 274 and 550 °C (10.54%) is attributed to complete decomposition of organic material on the surface of MSN-CTAB, leaving 65.34% of residue, that is, silica.
The TG curve of BPA (Fig. 5d) shows mass loss of almost 100%, which is characteristic of organic material. While the TG curves of the MSN-CTAB adsorbent (Fig. 5c) and of the BPA adsorbed on the adsorbent (Fig. 5e) present about 65% of residue, characteristic of the presence of inorganic material “silica”. On the other hand, a small difference (between 300 and 550 °C) was observed for these two TG curves (see Fig. S6†), which is due to the loss of BPA adsorbed on the MSN-CTAB.23
TG curve of the BPA adsorbed on the MSN-CTAB (Fig. 5e) shows a difference of weight loss (second and third loss with displacement to higher temperatures) when compared to Fig. 5c and d, this effect also is related to the loss of BPA bound on the MSN-CTAB (see Table S5†).23
Adsorption isotherms, in turn, describe the relationship between the amount of adsorbate adsorbed by the adsorbent (qe) and the concentration of adsorbate remaining in the solution after the system reaches equilibrium (Ce) at a constant temperature. In this study, Langmuir,36 Freundlich37 and Liu models were applied to fit the equilibrium data.35 See the equations in ESI.† The Langmuir, Freundlich and Liu isotherm models are presented in Fig. 6.
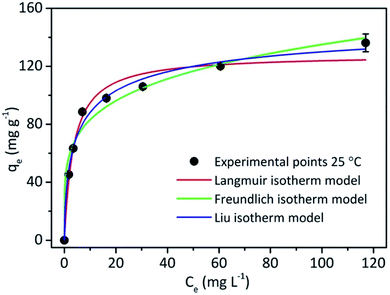 | ||
| Fig. 6 Adsorption Langmuir and Freundlich isotherms for BPA adsorbed by silica nanoparticles. Conditions: 25 °C, contact time 1 h and adsorbent mass 1.0 g L−1 (see Fig. S7, Table S6 and S7†). | ||
Although the Langmuir model is an excellent model applied to processes involving the formation of particle/film surface monolayers of molecules at a finite and defined number of adsorption sites, the Freundlich model has a better application for non-homogeneous processes over heterogeneous surfaces, and is not limited to monolayer or any uniform distribution. Finally, the Liu model can be applied to a system that has characteristics of both systems mentioned above.35
Based on the isotherm parameters of Table S7,† the Liu model presented the best adjusted determination coefficient value (Rajd.2). The Qmax found in Liu's model was 155.78 mg g−1, confirming that this is the best model for explaining the equilibrium of BPA adsorption by MSN-CTAB. In the model proposed by Liu, the active adsorbent sites do not have the same energy, which makes the adsorbent a preferred site for adsorption, leading to saturation.35
According to the literature, there are studies that report adsorbents more and others less efficient than the adsorbent studied here. Table 1 shows a comparison of the BPA adsorption capacities of different adsorbents of the literature.
| Adsorbent abbreviation | BET (m2 g−1) | Soln pH | Time (h) | Qmax (mg g−1) | References |
|---|---|---|---|---|---|
| a All adsorption experiments were carried out at room temperature. | |||||
| MSN-CTAB | 131 | 11.0 | 1 | 155.78 | This study |
| SMZFA F (zeolite) | 91.5 | 10.4 | 24 | 114.9 | Dong et al. 2010 (ref. 21) |
| SMZFA L (zeolite) | 50.6 | 9.6 | 24 | 56.8 | Dong et al. 2010 (ref. 21) |
| Y-type zeolite | 504 | 7.0 | < 2 | 111.1 | Tsai et al. 2006 (ref. 15) |
| Vinyl-SiO2 nanospheres | — | — | 2 | 136.97 | Zhou et al. 2013 (ref. 43) |
| MCM-41 | 1030 | 6–7 | 6 | 9.0 | Kim et al. 2011 (ref. 44) |
| MMIPs (polymer) | — | 6.0 | 0.5 | 106.38 | Wang et al. 2016 (ref. 45) |
| CTAB–SiO2 | — | — | 6 | 198.8 | Zhang et al. 2017 (ref. 22) |
| Ph-MS (mesoporous) | 750 | 6–7 | 6 | 351.0 | Kim et al. 2011 (ref. 44) |
| PAC (powder AC) | 1780 | 6–7 | 6 | 337.0 | Kim et al. 2011 (ref. 44) |
| Activated carbon | 1350 | — | 24 | 56.5 | Asada et al. 2004 (ref. 46) |
| Porous carbon | 300 | — | 24 | 41.8 | Asada et al. 2004 (ref. 46) |
According to Table 1 the adsorbent (MSN-CTAB from sugarcane waste ash) used in this study showed a higher maximum adsorption capacity when compared to zeolites/CTAB prepared with coal fly ash (SMZFA F and L),21 in addition to shorter contact time in the adsorption process. MSN-CTAB also showed a higher BPA adsorption capacity than the adsorbents: hydrophobic Y-type zeolite;15 vinyl-SiO2 nanospheres;43 MCM-41;44 MMIPs45 and activated carbon.46
We reached a Qmax value close to that found by Zhang et al. 2017,22 for a similar adsorbent, with the difference that we used a renewable source to produce silica while Zhang et al. 2017,22 used tetraethyl orthosilicate. Our adsorbent (MSN-CTAB) even with Qmax value of 155.78 mg g−1, about 2 times smaller than adsorbents Ph-MS and PAC.44 When converted to mg of BPA adsorbed per m2 of surface area of the adsorbent, the MSN-CTAB (1.19 mg m−2) has a higher value, when compared to Ph-MS44 (0.468 mg m−2) and PAC44 (0.189 mg m−2), what shows a higher affinity or better environment for adsorption of BPA.
4. Conclusions
In this study an adsorbent, MSN-CTAB, prepared from sugarcane waste ash, was used for BPA adsorption. Kinetic and isotherm models were tested, a better fit for the kinetic model was pseudo-first-order, in this case, this process may be related to the process of monolayer formation of BPA molecules on the MSN-CTAB surface. Liu isotherm model predicts the experimental data with Qmax = 155.78 mg g−1 and the adsorption equilibrium time was 60 min. The Liu model approached the Langmuir model (monolayer adsorption). Adsorption capacity of BPA by the adsorbent was practically constant at pH values between 4 and 9, there was a slight increase at pH 10 and a greater increase at pH 11. This was due to the fact that at pH 11 the BPA is mainly in the form of bivalent anion, and thus two CTAB molecules can interact with one BPA molecule. The BPA adsorption on MSN-CTAB occurred majority by hydrophobic interaction in pH values between 4 and 9 and by hydrophobic and electrostatic interaction at pH value above 10. According to the results obtained, the MSN-CTAB presents potential to be employed as adsorbent for remediation of water contaminated with endocrine disrupting compounds, such as, bisphenol-A.Conflicts of interest
There are no conflicts to declare.Acknowledgements
The authors acknowledge the COSAN/RAIZEN for supplying the sugarcane waste ash, the Dra. Nilce Ortiz who made the UV-vis spectrophotometer to collect UV-vis spectra available, and also the Dra. Duclerc F. Parra for TG analyses. This research was funded by Coordenação de Aperfeiçoamento de Pessoal de Nível Superior-Brasil (CAPES) – Código financeiro 001. We are also thankful to Conselho Nacional de Desenvolvimento Científico e Tecnológico-Brazil (CNPq) and Fundação de Amparo à Pesquisa do Estado de São Paulo-Brazil (FAPESP).References
- A. R. Brown, J. M. Green, J. Moreman, L. M. Gunnarsson, S. Mourabit, J. Ball, M. J. Winter, M. Trznadel, A. Correia, C. Hacker, A. Perry, M. E. Wood, M. J. Hetheridge, R. A. Currie and C. R. Tyler, Environ. Sci. Technol., 2019, 53, 463–474 CrossRef CAS PubMed.
- A. P. Dianin, J. Russ. Phys.-Chem. Soc., 1891, 23(523–546), 601–611 Search PubMed.
- T. Zincke, Justus Liebigs Ann. Chem., 1905, 343, 75–99 CrossRef CAS.
- D. M. Goldinger, A.-L. Demierre, O. Zoller, H. Rupp, H. Reinhard, R. Magnin, T. W. Becker and M. Bourqui-Pittet, Regul. Toxicol. Pharmacol., 2015, 71, 453–462 CrossRef CAS PubMed.
- A. Bhatnagar and I. Anastopoulos, Chemosphere, 2017, 168, 885–902 CrossRef CAS PubMed.
- F. Maqbool, S. Mostafalou, H. Bahadar and M. Abdollahi, Life Sci, 2016, 145, 265–273 CrossRef CAS PubMed.
- K. Ji, S. Hong, Y. Kho and K. Choi, Environ. Sci. Technol., 2013, 47, 8793–8800 CrossRef CAS PubMed.
- L. Canesi and E. Fabbri, Dose Response, 2015, 13, 1559325815598304 Search PubMed.
- W. Wei, Q.-S. Huang, J. Sun, J.-Y. Wang, S.-L. Wu and B.-J. Ni, Environ. Sci. Technol., 2019, 53, 2509–2517 CrossRef CAS PubMed.
- S. Y. Wee and A. Z. Aris, npj Clean Water, 2019, 2, 1–14 CrossRef.
- J. Im and F. E. Löffler, Environ. Sci. Technol., 2016, 50, 8403–8416 CrossRef CAS PubMed.
- M. Eckardt, M. Kubicova, D. Tong and T. J. Simat, J. Chromatogr. A, 2020, 1609, 11 CrossRef PubMed.
- S. Zheng, Z. Sun, Y. Park, G. A. Ayoko and R. L. Frost, Chem. Eng. J., 2013, 234, 416–422 CrossRef CAS.
- S. I. Rathnayake, Y. Xi, R. L. Frost and G. A. Ayoko, J. Colloid Interface Sci., 2016, 470, 183–195 CrossRef CAS PubMed.
- W.-T. Tsai, H.-C. Hsu, T.-Y. Su, K.-Y. Lin and C.-M. Lin, J. Colloid. Interface Sci., 2006, 299, 513–519 CrossRef CAS PubMed.
- J. Li, Y. Zhan, J. Lin, A. Jiang and W. Xi, Environ. Earth Sci., 2014, 72, 3969–3980 CrossRef CAS.
- Y. Kimura, M. Yamamoto, R. Shimazaki, A. Kashiwada, K. Matsuda and K. Yamada, J. Appl. Polym. Sci., 2012, 124, 796–804 CrossRef CAS.
- M. H. Dehghani, M. Ghadermazi, A. Bhatnagar, P. Sadighara, G. Jahed-Khaniki, B. Heibati and G. McKay, J. Environ. Chem. Eng., 2016, 4, 2647–2655 CrossRef CAS.
- D. Balarak, Int. J. Chemtech Res., 2016, 9, 681–690 CAS.
- B. Orimolade, F. Adekola, M. Aminat, A. Idris, O. Saliu and T. Yusuf, J. Appl. Chem. Res., 2018, 12, 8–21 Search PubMed.
- Y. Dong, D. Wu, X. Chen and Y. Lin, J. Colloid Interface Sci., 2010, 348, 585–590 CrossRef CAS PubMed.
- Y. Zhang, C. Liu, L. Luo, Y. Shi, Y. Chen, S. Wang, L. Bian and F. Jiang, Water Sci. Technol., 2017, 76, 928–938 CrossRef CAS PubMed.
- S. Rovani, J. J. Santos, P. Corio and D. A. Fungaro, ACS Omega, 2018, 3, 2618–2627 CrossRef CAS PubMed.
- R. H. Alves, T. V. S. Reis, S. Rovani and D. A. Fungaro, J. Chem., 2017, 2017, 9 Search PubMed.
- S. Rovani, J. J. Santos, P. Corio and D. A. Fungaro, J. Braz. Chem. Soc., 2019, 30, 1524–1533 Search PubMed.
- S. Rovani, A. G. Rodrigues, L. F. Medeiros, R. Cataluña, É. C. Lima and A. N. Fernandes, J. Environ. Chem. Eng., 2016, 4, 2128–2137 CrossRef CAS.
- S. Neusatz Guilhen, S. Rovani, L. Pitol Filho and D. Alves Fungaro, Chem. Eng. Commun., 2019, 206, 1354–1366 CrossRef.
- S. Lagergren, K. Sven. Vetenskapsakad. Handl., 1898, 24, 1–39 Search PubMed.
- Y. S. Ho and G. McKay, Chem. Eng. J., 1998, 70, 115–124 CrossRef CAS.
- G. Blanchard, M. Maunaye and G. Martin, Water Res, 1984, 18, 1501–1507 CrossRef CAS.
- Y.-S. Ho, PhD thesis, University of Birmingham, 1995.
- Y. S. Ho, D. A. J. Wase and C. F. Forster, Environ. Technol., 1996, 17, 71–77 CrossRef CAS.
- Y.-S. Ho, J. Hazard. Mater., 2006, 136, 681–689 CrossRef CAS PubMed.
- Y.-S. Ho, Environ. Sci. Pollut. Res., 2014, 21, 7234–7235 CrossRef PubMed.
- É. C. Lima, M. A. Adebayo and F. M. Machado, in Carbon Nanomaterials as Adsorbents for Environmental and Biological Applications, ed. C. P. Bergmann and F. M. Machado, Springer International Publishing, 1st edn, 2015, ch. 3, pp. 33–69, DOI:10.1007/978-3-319-18875-1.
- I. Langmuir, J. Am. Chem. Soc., 1918, 40, 1361–1403 CrossRef CAS.
- H. M. F. Freundlich, J. Phys. Chem., 1906, 57, 385–471 CAS.
- R. J. Alessio, X. Li and D. F. Martin, J. Environ. Sci. Health A Tox. Hazard Subst. Environ. Eng., 2012, 47, 2198–2204 CrossRef CAS PubMed.
- Y. Niibori, M. Kunita, O. Tochiyama and T. Chida, J. Nucl. Sci. Technol., 2000, 37, 349–357 CrossRef CAS.
- A. A. Inyinbor, F. A. Adekola and G. A. Olatunji, Water Resour. Ind., 2016, 15, 14–27 CrossRef.
- R. Ullah, I. Ahmad and Y. Zheng, J. Spectrosc., 2016, 2016, 1–5 CrossRef.
- H. Guan, E. Bestland, C. Zhu, H. Zhu, D. Albertsdottir, J. Hutson, C. T. Simmons, M. Ginic-Markovic, X. Tao and A. V. Ellis, J. Hazard. Mater., 2010, 183, 616–621 CrossRef CAS PubMed.
- H. Zhou, Y. Xu, H. Tong, Y. Liu, F. Han, X. Yan and S. Liu, J. Appl. Polym. Sci., 2013, 128, 3846–3852 CrossRef CAS.
- Y.-H. Kim, B. Lee, K.-H. Choo and S.-J. Choi, Micropor. Mesopor. Mat., 2011, 138, 184–190 CrossRef CAS.
- R.-Z. Wang, D.-L. Huang, Y.-G. Liu, Z.-W. Peng, G.-M. Zeng, C. Lai, P. Xu, C. Huang, C. Zhang and X.-M. Gong, RSC Adv, 2016, 6, 106201–106210 RSC.
- T. Asada, K. Oikawa, K. Kawata, S. Ishihara, T. Iyobe and A. Yamada, J. Health Sci., 2004, 50, 588–593 Search PubMed.
Footnote |
| † Electronic supplementary information (ESI) available: Kinetic and equilibrium equations, UV spectra before and after BPA adsorption, BPA analytical curve at pH 11, additional TG curves, kinetic and isotherm parameters of BPA adsorption on MSN-CTAB. See DOI: 10.1039/d0ra05198e |
| This journal is © The Royal Society of Chemistry 2020 |

