 Open Access Article
Layer-by-layer modification effects on a nanopore's inner surface of polycarbonate track-etched membranes†
Roberto Paoli a,
Maria Bulwana,
Oscar Castañobcde,
Elisabeth Engelcdf,
J. C. Rodriguez-Cabello
 dg,
Antoni Homs-Corberaa and
Josep Samitier
 *abde
*abde
aNanobioengineering Group, Institute for Bioengineering of Catalonia (IBEC), Barcelona Institute of Science and Technology (BIST), 12 Baldiri Reixac 15-21, Barcelona 08028, Spain. E-mail: jsamitier@ibecbarcelona.eu
bDepartment of Electronics and Biomedical Engineering, University of Barcelona, Martí i Franquès 1, 08028 Barcelona, Spain
cBiomaterials for Regenerative Therapies Group, Institute for Bioengineering of Catalonia (IBEC), Barcelona Institute of Science and Technology (BIST), 12 Baldiri Reixac 15-21, Barcelona 08028, Spain
dCentro de Investigación Biomédica en Red en Bioingeniería, Biomateriales y Nanomedicina (CIBER-BBN), Monforte de Lemos 3-5, Pabellón 11, 28029 Madrid, Spain
eInstitute of Nanoscience and Nanotechnology, Universitat de Barcelona (UB), 08028 Barcelona, Spain
fMaterials Science and Metallurgy, EEBE, Technical University of Catalonia (UPC), 08019 Barcelona, Spain
gBioforge Lab, University of Valladolid, CIBER-BBN, Edificio LUCIA, Paseo Belén 19, Valladolid 47011, Spain
First published on 30th September 2020
Abstract
The control of the morphology, as well as the physical and chemical properties, of nanopores is a key issue for many applications. Reducing pore size is important in nanopore-based sensing applications as it helps to increase sensitivity. Changes of other physical properties such as surface net charge can also modify transport selectivity of the pores. We have studied how polyelectrolyte layer-by-layer (LBL) surface modification can be used to change the characteristics of nanoporous membranes. Studies were performed with a custom made three-dimensional multilayer microfluidic device able to fit membrane samples. The device allowed us to efficiently control LBL film deposition over blank low-cost commercially available polycarbonate track-etched (PCTE) membranes. We have demonstrated pore diameter reduction and deposition of the layers inside the pores through confocal and SEM images. Posterior impedance measurement studies served to evaluate experimentally the effect of the LBL deposition on the net inner nanopore surface charge and diameter. Measurements using direct current (DC) and alternative current (AC) voltages have demonstrated contrasted behaviors depending on the number and parity of deposited opposite charge layers. PCTE membranes are originally negatively charged and results evidenced higher impedance increases for paired charge LBL depositions. Impedance decreased when an unpaired positive layer was added. These results showed a different influence on the overall ion motility due to the effect of different surface charges. Results have been fit into a model that suggested a strong dependence of nanopores' impedance module to surface charge on conductive buffers, such as Phosphate Buffer Saline (PBS), even on relatively large nanopores. In AC significant differences between paired and unpaired charged LBL depositions tended to disappear as the total number of layers increased.
Introduction
Nanoporous membranes have numerous potential biological and medical applications that involve sorting, sensing, isolating, and releasing biological molecules.1 Particularly, the interest is rising on the ability to regulate or sense transport at a molecular level. Nanopore sensing studies started and have been long dominated by the use of engineered biological pores.2,3 Thanks to its well-established structure,4 α-hemolysin nanopore obtained from Staphylococcus aureus was successfully used both to follow the translocation of single-stranded DNA5,6 or to detect a variety of target species.7–11At present, the fabrication, and the application of solid-state nanopores are becoming the center of attention as they offer greater flexibility in terms of their shape, size, and surface properties as well as better (bio)chemical and mechanical robustness.12
Studies have been conducted both with single-pore and multi-pore membranes.12 Despite the higher sensitivity and lack of averaging effect of single-nanopore membranes, multi-pore membranes were shown to provide a cost-effective alternative to well-established label-free methods.
Recent advances in nanoscience are making it possible to precisely control the morphology as well as the physical and chemical properties of the pores in nanoporous materials. Different researches showed that transport selectivity through solid-state nanopores can be effectively modulated by changing the size,13 the charge,14–16 and the polarity of the pores17–19 or by using tethered receptors that are capable of selective molecular recognition.20
Surface modification techniques are often used to achieve those results, as they can alter both physical and chemical properties. The fabrication of an ultrathin selective layer onto a strong porous support is the most sought approach to develop high-performance membranes by avoiding the limitations of polymer-based membranes such as low selectivity and limited permeation rates. In this case, the lamination of the layer generally employs the attachment of a previously prepared thin film on top of a porous membrane support.21
The possibility to generate a nanostructured surface functionalization is of increasing interest. In 1991 Decher et al. established a new surface functionalization technique, the so-called layer-by-layer (LBL) or electrostatic adsorption functionalization.22–24 For instance, membrane gas separation is an emerging application field of chemical engineering focused to separate gas mixtures of diverse molecules, such as organic and inorganic gases. Recent reviews include different technologies of thin layer membrane deposition including layer-by-layer (LBL) assembly.21,25
In LBL assemblies, a solid substrate with a negatively charged surface is immersed in a solution containing a cationic polyelectrolyte, and a layer of polycation is adsorbed via electrostatic attraction. Adsorption is carried out at relatively high concentrations of polyelectrolyte, so several cationic groups remain exposed to the solution, and thus, the surface charge is effectively reversed. The substrate is then rinsed in pure de-ionized water and subsequently immersed in a solution containing an anionic polyelectrolyte. A new polymer layer is adsorbed, and the original surface charge is then restored. By repeating these steps, an alternated multilayer assembly is obtained.26
An important phenomenon affecting conductivity of an electrolyte solution is the so-called Electrical Double Layer (EDL) formation. EDL formation appears at the interface between a solid surface and the electrolyte. The phenomenon is described in many texts27–34 and the model proposed to interpret its behaviour is continuously evolving.35–38
When immersed in a polar solution, the surface net charge of a substrate generates an electrical potential (ΦC) which tends to attract ions of the opposite charge (counter-ions) and repel ions with the same charge (co-ions). Therefore, charges will not be uniformly distributed throughout the liquid phase. Counter-ions will be concentrated in a small finite volume near the charged surface. It is also observed that the longer the distance from the surface, the lower ΦC. EDL model proposes the existence of two layers together after the interface: one stationary and immobile call Stern layer, and another one diffuse and mobile (see Fig. A1 at the ESI†). The Z potential is the needed work to carry a unit of charge from the infinite to the interface of both stationary and diffuse layer, known as the slipping or shear plane.39 Similarly, the ion distribution inside the pore is generally different from the bulk electrolyte. Counter-ions tend to accumulate close to the walls due to favourable electrostatic interactions with the surface, while co-ions are depleted.40
In this work, we report a systematic analysis of the nanopores conductivity in a polycarbonate membrane functionalized by polyelectrolyte layer-by-layer deposition of an elastin-like recombinant polymer using a microfluidic system.
Materials and methods
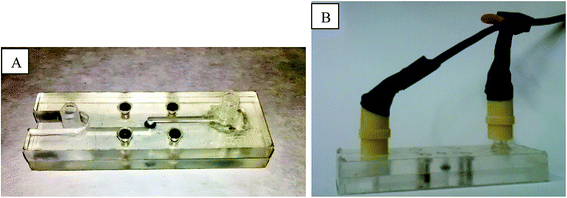
All impedance measurements were performed over a microfluidic device designed to include a nanoporous membrane sample, as illustrated in Fig. 1. The device is formed by two part secured together using four M2.5 screws and measures 76 × 24 × 20 mm when assembled.Structure is made of Zeonor® 1020R Ciclo Olefin Polymer (COP) from Zeon Corporation41 and a superficial canal of 25 × 2 × 0.1 mm is dug into each part by milling. Both channels merge in a central cylindrical chamber (Ø = 4 mm, h = 0.9 mm) which can house a 4 mm circular membrane secured by an O-ring (external Ø = 4 mm, internal Ø = 2 mm) to prevent fluid leakage.
On peripheral extremities, the channels terminate with Luer-lock adapters. The adapters are used both for fluidic connection as well as for electrode insertion, using modified Luer-lock caps where electrodes (platinum wire segments, Ø = 0.5 mm, purity = 99.99+%) were secured using epoxy resin.
We used commercially available Steriltech polycarbonate track-etch (PCTE) membranes with 200 nm pore diameter. Thanks to their slight negative charge caused by their chemical character is possible to apply LBL functionalization starting with a polycation polymer. Negative charge is mostly caused by the presence of free electrons from the oxygen bonded with carbon in the carbonyl group (–C![[double bond, length as m-dash]](https://www.rsc.org/images/entities/char_e001.gif) O). Even if it is still not an ionic effect, it is possible to absorb the first layer of the polycation on the polycarbonate substrate through both a hydrophobic reaction (polyelectrolytes possess hydrophobic domains) and the electrostatic interactions from the endings of polycarbonate backbones.
O). Even if it is still not an ionic effect, it is possible to absorb the first layer of the polycation on the polycarbonate substrate through both a hydrophobic reaction (polyelectrolytes possess hydrophobic domains) and the electrostatic interactions from the endings of polycarbonate backbones.
All materials used in the study were obtained from Sigma-Aldrich. The ELRs were obtained by recombinant DNA technologies using procedures described previously.42 An elastin-like recombinamer (ELR) consisting of the following sequence of aminoacids [(VPGIG)2(VPGKG)(VPGIG)2]24 (Kx24, M = 51![[thin space (1/6-em)]](https://www.rsc.org/images/entities/char_2009.gif) 980 g mol−1) was used as polycation thanks to 24 lysine (K) units that bring a positive net charge of the polypeptide at pH < pKa (pKa = 9.4 for poly-lysine).42 Anionic ELR, Ex15 (M = 31
980 g mol−1) was used as polycation thanks to 24 lysine (K) units that bring a positive net charge of the polypeptide at pH < pKa (pKa = 9.4 for poly-lysine).42 Anionic ELR, Ex15 (M = 31![[thin space (1/6-em)]](https://www.rsc.org/images/entities/char_2009.gif) 943 g mol−1), consisting of the following sequence of aminoacids [(VPGVG)2(VPGEG)(VPGVG)2]15 (15 glutamic acid units) was used as polyanion. ELRs were dissolved in 0.1 M NaCl aqueous solution to reach a concentration of 1 g l−1 Dialysis tubing cellulose membrane (cut off for more than 12
943 g mol−1), consisting of the following sequence of aminoacids [(VPGVG)2(VPGEG)(VPGVG)2]15 (15 glutamic acid units) was used as polyanion. ELRs were dissolved in 0.1 M NaCl aqueous solution to reach a concentration of 1 g l−1 Dialysis tubing cellulose membrane (cut off for more than 12![[thin space (1/6-em)]](https://www.rsc.org/images/entities/char_2009.gif) 400 M.W, Sigma Aldrich) has been used.
400 M.W, Sigma Aldrich) has been used.
Synthesis of fluorescence-labelled polymer
On-chip functionalization protocol was defined. Membrane is first washed flowing 4 ml of pure deionized water through the chip at 200 μl min−1 and subsequently filled with 500 ml of cold polyelectrolyte solution at 150 μl min−1. After 10 minutes of storage at 4 °C, membrane was washed again flowing 4 ml of pure deionized water through the chip at 200 μl min−1.To test functionalization stability, we also realized fluorescence microscopy scans. The positively charged ELRs, Kx24 has been labelled by ATTO 647N, used for fluorescence labelling of primary amino groups. Briefly, sodium bicarbonate has been dissolved in ultrapure water to achieve final concentration 1 M then appropriate amount of sodium bicarbonate has been added to Kx24 (CKx24 = 9 mg cm−3) to archive final concentration of protein solution 100 mM. The ATTO 647N solution has been prepared by dissolving the label in DMF to final concentration (10 mg ml−1). Then the protein has been labelled by adding 10 μl of ATTO 647N solution per each 100 μl of protein solution. The mixture has been vortex carefully and centrifuges to collect the reaction mixture at the bottom of the tube. Then the mixture has been incubating for one hour at room temperature. The purification has been provided in dialyzing cellulose tube in acidic solution (pH = 5) to avoid hydrolysis of created NHS ester groups. In order to detect possible changes, confocal fluorescence microscopy was performed before and after measurement protocol.
Electrical impedance characterization
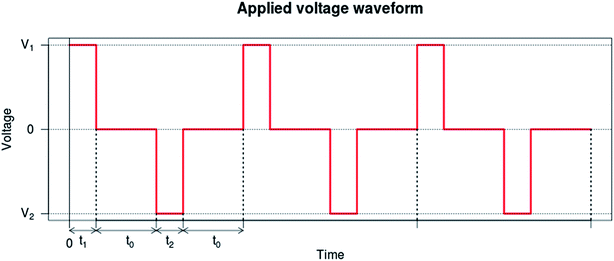
For each functionalization step, AC and DC measurements were performed in sequence after filling the chip with 2 ml of PBS (Sigma Aldrich) solution at 200 μl min−1. For AC measurement, the impedance module and phase were measured for 201 frequency points in the 40 Hz to 110 MHz band using an Agilent 4294A precision impedance analyzer, using Agilent 16048H extension board to connect the impedance analyzer to the electrodes. To prevent the electrolysis process as well as to correct possible polarity bias, DC measurements was done applying the modified square voltage waveform shown in Fig. 2 while measuring current using Keithley 6430 sub-femtoampere remote source meter, with the remote preamp in 2-wire configuration. For each sample, relative time, voltage, current, and equipment status code are transmitted through GPIB. The measurement process was iterated 3 times for each functionalization step, replacing the buffer solution between each measurement.ζ-Potential analysis
Streaming potential measurements of differently functionalized membranes were performed using a SurPASS analyzer for solid surface analysis (Surpass, Anton Paar GmbH, Graz, Austria). Briefly, it involves flowing an aqueous electrolyte through a capillary-sized space. The electrical response generated is the result of the action of the shear stress of the liquid flow on the counterions that compensate the charge of the membranes' surfaces in equilibrium. Therefore, a charge separation is obtained between the inlet and the outlet of the capillary gap, and an electrical force is induced opposite to the direction of the liquid flow. As a result in the stationary state, an inverse charge current is generated that partially compensates for the ion current in the direction of flow. The net charge difference creates a different electrical potential called the streaming potential.43For solid materials with flat surfaces, the most accurate approach to relate the streaming potential with the electrokinetic phenomena is the Helmholtz–Smoluchowski equation.
Surface ζ-potential was then determined using an adjusting gap cell where two equal sizes (L × H 20 × 10 mm) samples were fixed on stamps and placed oppositely with a gap separation distance of 120 μm at room temperature. A flow check was performed to achieve constant flow through the cell-gap and a gradual increase of the differential pressure up to 0.3 bar. Two cycles were performed in both directions and the average values of dVstr/dP were used to calculate ζ. The buffered electrolyte used was PBS at increasing concentrations (10, 30, 50, and 100%) up to the same one used in electrical measurements, to replicate the same conditions. Lower concentrations were used to confirm the measurements done with the most conductive buffer, as it was close to the instrument-working limit. All measurements were performed at pH 7.39 ± 0.03.
Nanopore morphological analysis
To verify pore geometry, we performed nano-tomography using FIB-SEM technique.44 In order to obtain serial sectioning, a crossbeam workstation (Zeiss Neon 40) with FIB/SEM beams was used. It consists of a CANION31 Gallium FIB column (1 pA to 50 nA, 3–30 kV, 7 nm resolution) and a GEMINI SEM column with (Schottky-FE) gun (4 pA to 20 nA, 0.1–30 kV, 1.1 nm resolution at 20 kV). The sample was placed at the eccentric point where the two columns converge at a 52° angle. During the serial sectioning process, the stage tilt was kept constant at 52° so that the sample surface (x–z plane) was perpendicular to the ion beam (y-direction). Ion beam was then used to remove a series of layers with a constant thickness along the z-direction, while the sectioned planes (x–y) could be imaged with an electron column from an angle of 52° as in conventional SEM.The membrane sample was sputtered with gold to reduce charging and enable conventional SEM imaging. To prevent “curtain effect”,45 a further platinum protective layer with a thickness of a few 100 nm was applied with the gas injection system (GIS) over the area of interest. Before the actual sectioning procedure can be started, a cube of appropriate size must be exposed, milling a U-shaped trench around it. The exposed cube measures 15 × 11 × 10.16 μm and correspond to the imaged area. Two alignment lines forming a 45° angle were milled on gold and platinum layers, to facilitate later image processing steps. SEM images were acquired at 3 kV, with a 20k× magnification, leading to a pixel size of 14.65 nm. Slicing was performed using FIB line milling at 20 kV, 500 pA. Thanks to alignment marks, using simple trigonometry was also possible to calculate the distance between each slice pair. Mean distance and -consequently- average resolution in the z-direction equals to 4.33 nm.
High resolution SEM cryocutting images were also performed together with Atomic Force Microscopy (NanoScope 3D controller fitted). The surface of the coated PC was scratched using the same AFM contact mode with an angle of 45°. Then the surface of the PC was observed using AFM tapping mode 0° scan.
Advanced image processing techniques were then applied to reconstruct the 3D structure of the pores. We applied the least square mean alignment, Kuwahara smoothing filter, Sobel edge detection, intensity threshold, disc-shaped closing operation. Pore length was calculated averaging open pores values. Image processing, including morphological results, were performed MathWorks MATLAB® and FIJI (ImageJ) software.
Experimental results and discussion
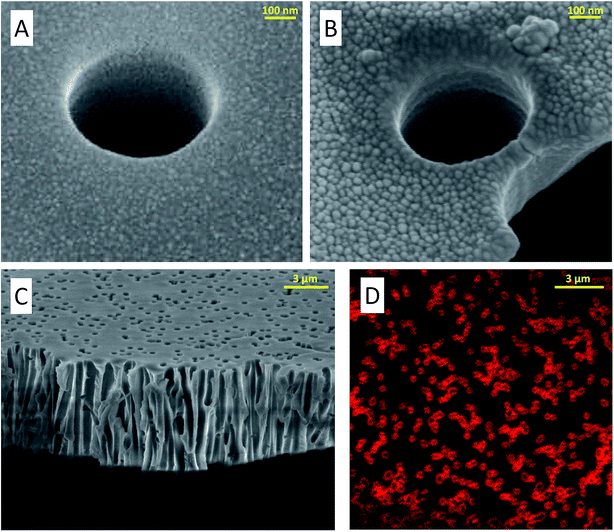
A microfluidic device allows us to efficiently control the LBL film deposition. Starting from a blank membrane, functionalization was performed on the microfluidic device, between different electrical measurements. We used Kx24 and Ex15 polyelectrolytes each one dissolved in 0.1 M NaCl aqueous solutions with 1 g L−1 concentration.SEM images of functionalized membranes obtained after experiments (–C) show the polyelectrolyte deposition and the typical pore size reduction in PCTE membranes. In Fig. A2 at the ESI,† high-resolution SEM cryocutting images showing the topographical differences between non-(A) and modified membranes (B) can be observed. Fig. A3 at the ESI,† a scratch test was used to assess the thickness of 8 bilayers. A value of 11.7 nm thickness was obtained, which is consistent with other experiments performed with similar polymer types.46,47
Functionalization integrity after the measurement functionalization was checked using confocal fluorescent microscopy and a polycation modified with ATTO labels. As shown in Fig. 3D, the ATTO functionalization is stable inside the pores after the measurement procedure. Robustness of the underlying LBL functionalization can be then inferred.
Impedance measurements
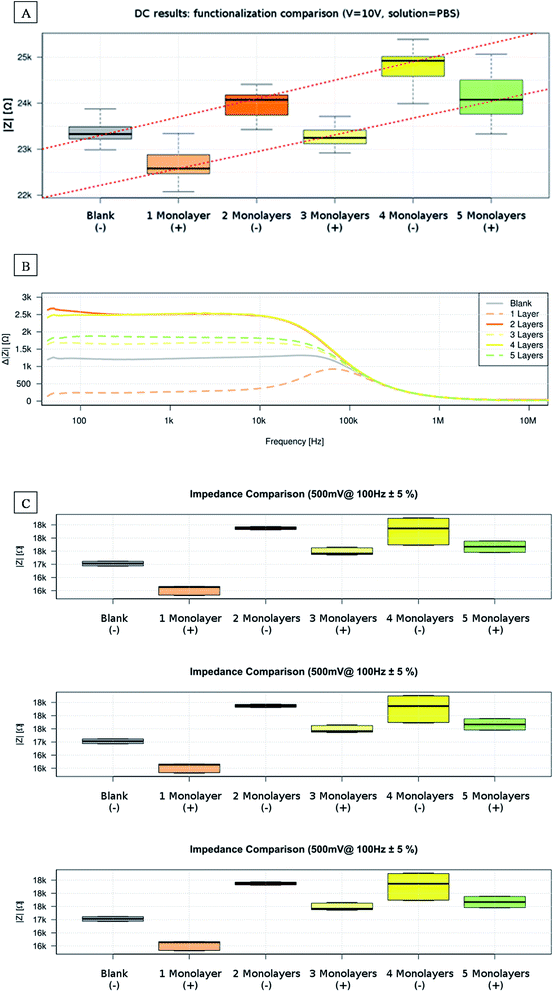
Starting from pure water, we filled the chip manually using the syringe and let at least 2 ml of solution flowing through the membrane. After that, we disconnected the fluidic setup and connected the electrodes. Electrodes were previously washed using Milli-Q pure water and dried using a nitrogen gas stream to avoid contamination. Results from our impedance measurements evidenced a double dependence, on the total number of deposited layers and on its parity. In DC measurements, results generally show dependence between the electrical resistance and the increasing number of layers (Fig. 4A). Adding layers onto the pore surface decreases the pore mean aperture, resulting in a diminution of the ions flux and, thus, of the electric current across the membrane.Fig. 4A also shows contrasted behaviour depending on the parity of the total deposited layers and, consequently, on which the polyelectrolyte forms the outer functionalization. Measurements performed on membranes with an odd number of deposited films show lower electrical resistance.
We also performed Mann–Whitney U-test between all possible pairs combinations to test the relevance of the results. We observed strong statistically significant differences (p < 0.01, always under 10–8) between pairs, except for the Blank and 3-monolayers pair (p = 0.0229) and the 2- and 5-monolayers pair (p = 0.056). These cases, where no significant differences were found, seem to correspond to a progressive overlap of the two-evidenced tendencies.
In the AC measurements, we found differences in the 100 Hz to 100 kHz frequency range of the impedance module spectrum (Fig. 4B). The impedance module generally increases with the number of applied monolayers while again a different tendency is found depending on the parity of the deposited layers.
Lower frequencies presented a 50 Hz noise, while at higher frequencies the membrane becomes transparent to electrical field changes, showing no significant differences from membrane-free measurement.
Similarly, to DC results the impedance modulus varies depending on total deposited layer parity and so on outer layer type. Measurements related to an odd number of deposited layers show an extra conductivity contribution (Fig. 4C). The difference between paired and unpaired LBL deposition tends to decrease as the total number of deposited layers increases.
Mann–Whitney U-test was again performed between all possible AC pairs combinations, considering two adjacent frequency points to obtain enough samples. We observed statistically significant differences (p < 0.05) between pairs in the 40 Hz to 20 kHz range, except for the 2- and 4-monolayers pair and the 3- and 5-monolayers pair. The result confirms that, increasing the total number of layers, AC impedance module differences between subsequent layers becomes less important.
ζ-Potential measurements
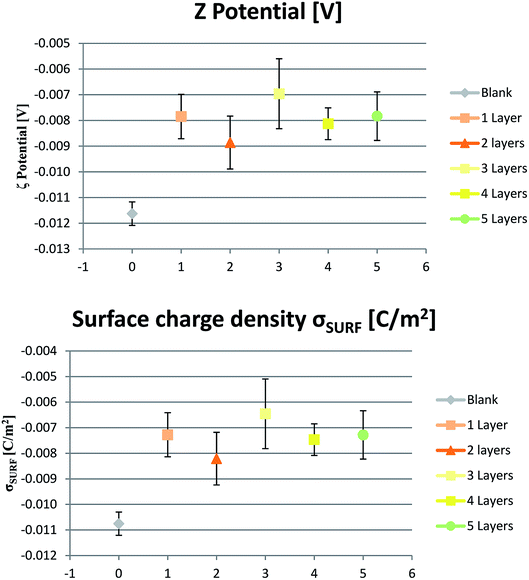
ζ-Potential is a useful analysis well-known for the characterization of nanoparticles including LbL ones, but still underused for the characterization of solid polymeric surface.48 As well, a trend to converge the overall charge to a fixed value is observed. The larger the number of deposited layers, the more constant is the surface charge towards ζ ∼ −8 mV (Fig. 5). When considered the different polymer layers that are added, the polycation is formed by 24 lysine units among other structural amino acids such as valine, proline, and glycine which are mainly non-polar and neutral, and, therefore, they don't participate in the whole polarity of the polymer. Same for the polyanion, which is formed by 15 glutamic acids among the same structural amino acids. Anyway, at each cycle, the charge is restored towards the same value of ζ as the first layer deposition and the process can be repeated analog to other similar studies.49Simulation
We suspected that AC and DC impedance module differences between odd and even number of deposited layers to be related to surface charge changes consequent to LBL functionalization.To verify that hypothesis, we modeled our system as a series of impedances corresponding to the electrodes, the buffer solution, and the membrane.
Considering an exposed membrane area, A with radius r = 1 mm, membrane impedance module (|ZM|) can be modelled as the parallel of n-pores impedances with module Zi
 is the mean impedance module of a single pore.
Taking inspiration from models found in the literature,40 we formulated mean the single-pore impedance module  as
as
The formula consists of two contributions: the first one (Kbulk) related to bulk electrolyte and the second one (Ksurf) related to extra concentration of counter-ions along pores walls.
Considering PBS solution has strong molar predominance of sodium chloride (NaCl), we can approximate μC to μNa = 5.19 × 10⁻⁸ m2 V−1 s−1 when σsurf < 0 and to μCl = 7.909 × 10⁻⁸ m2 V−1 s−1 otherwise.
To calculate the theoretic value more accurately, we proceeded to collect the needed parameters from membrane characterization. We used FIB/SEM tomography to inspect pores morphology as well as Z potential measurements to calculate surface charge.
We used FIB/SEM tomography to characterize or verify some parameters, like μpores, Lpore. From 3D reconstruction, we observe how pores are not ideally straight and parallel tubes, but they are mostly tilted respect to the membrane normal and densely interconnected between themselves (Fig. 6). Consequently, mean pore length is 6.5% longer compared to membrane thickness. Furthermore, μpores in our sample results about 25% smaller than the manufacturer value.
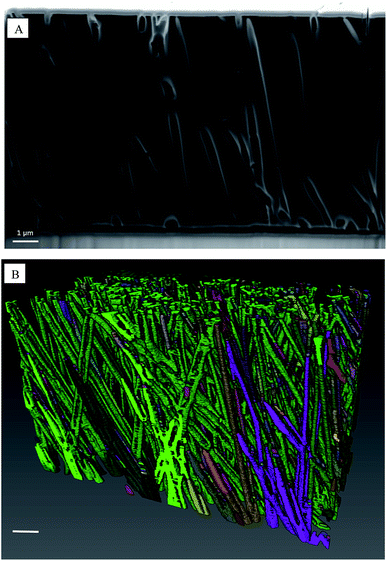 | ||
| Fig. 6 (A) FIB/SEM tomography vertical section. (B) 3D reconstruction of pores distribution, scale bar 1 μm. | ||
Surface charge and ζ potential are not equal, but for most practical cases can be considered directly related. According to Grahame equation, ζ potential and surface charge σsurf are related by equation:
For low surface charge densities, this is often equated to the Stern potential. When ionic strength is high enough, the double layer becomes thinner, the Stern layer disappears and we can consider that φd ∼ ζ (see Fig. A1 at the ESI†).
Surface ζ potential measurements in PBS solution at pH ∼ 7.4 show negative values. Consequently, calculated surface charge density (Fig. 5) is negative, too. Pristine membrane is originally negatively charged. When adding the first cationic layer, net charge becomes more positive even if without reaching complete reversal. Subsequently, when adding the second anionic layer, net charge returns more negative. Similar alternate behavior is shown by the following layer, even if changes are less pronounced increasing the number of deposited layers.
Discussion
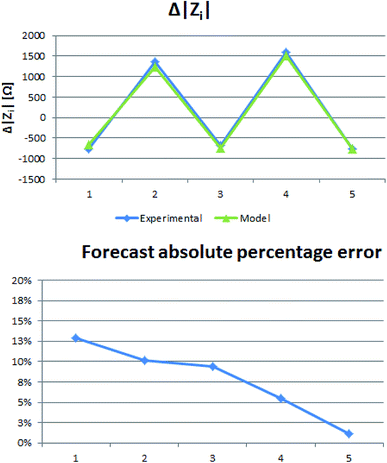
We fit the model with our experimental data. To eliminate contribution from other parts of the microfluidic system not related to the nanoporous membrane, the model was applied to impedance module differences:αi was then adjusted empirically to minimize the mean square error.
We obtained a best fit (Fig. 7) with α = {0.997, 0.991, 0.997, 0.993, 0.998, 0.996} for i = {0, 1, 2, 3, 4, 5}, respectively. Results showed larger values for the α parameter on odd layers seeming to indicate a stronger influence of the surface charge on these cases having probably a more uniformly organized negative surface charge due to the negative character of the underlying PC membrane. Furthermore, α values are generally high, indicating, to our belief, a strong dependence of the obtained results from the polyelectrolyte LBL modifications inside the pores governing the ionic contain behavior of the confined space.
Following EDL theory, we hypothesize that charges in the buffer tend to redistribute in the solution, reorganizing more strongly near the surfaces of the pores and creating an opposing charges layer. When this happens in a constrained space like such as small nanopore, it results in a significant charge accumulation inside the pore. This phenomenon could alter local conductivity, depending on buffer solution ionic organization and substrate surface nanoscale morphology characteristics.
Surface charge reversal in LBL assembly upon adsorption of an oppositely charged polyelectrolyte has been known for the case of polyion adsorption on colloids and in few cases has been shown on solid surfaces.50,51 The complete neutralization or reversal of charges depends on the configuration in which the polymer binds to the surface.50
We hypothesize that the absence of a complete charge reversal in our measurements might be related to an incomplete shielding of the original blank membrane. This might happen as we are working with a macroscopic surface, not colloids or nanoparticles, so the initial charge might have more influence on the net one after functionalization. Furthermore, ζ measurements gave us a mean value related to the whole membrane surface, while in the reduced volume inside the nanopore we might expect a more ordered deposition. This would increase the local potential, and thus the surface charge density, as well as modify the overall ionic composition of the nanopore volume, justifying the need for an α correction factor.
In case of incomplete or not uniform adsorption of the first cationic layer, gaps might appear leaving parts of the original anionic membrane exposed thus affecting the net charge and partially reducing the surface conductance effect. On the next step, an oppositely charged polymer would cover again the previous cationic layer matching the negative charge present in the gaps.
This would increase again the surface conductance effect, similar to the original case, thus justifying a higher α value for even layers.
On the other hand, α values are high, indicating a strong influence of the surface and the ionic deposited layers on the conductive behavior of the nanopore even when the pores are relatively large. In a previous work,40 negatively charged pores with an even larger radius showed an almost doubled pore conductivity respect to a similar bulk value.
Conclusions
We studied changes in electrical conductivity of nanoporous commercially low-cost membranes depending on LBL film depositions. Results showed impedance module differences in AC, in the 100 Hz to 20 kHz band, and in DC.The measured electrical impedance module showed two general tendencies. The higher the number of deposited layers, the higher the impedance module due to the physical reduction of the pore aperture. On the other side, we evidenced a contrasted behaviour depending on the parity of the total deposited layers. Unpaired functionalization's, ending with a polycationic monolayer, resulted in an impedance module decrease.
LBL technique can then be used not only to modify pore size, but also to locally modify surface net charge and thus local conductivity. The achieved modifications are of great importance for the ionic motility inside the pore since we have shown a strong dependence of pores conductivity with surface charge even when these pores are relatively large.
The idea of using chemically modified membranes with large pore density could find potential applications as they can easily surpass the sensitivity level of other established label-free detection methods at a much lower cost of analysis. The reported high-density nanoporous membranes could be relevant for many different applications of chemical engineering including molecular recognition in liquids, molecular isolation and concentration or gas mixtures separation, where theses parameters are relevant and could be used in high-performance immune isolation devices, high-precision concentration sensors, targeted drug delivery or permselective membranes for efficient gas separation. More specific and promising options are based on the use of those membranes combined with biodegradable polymeric membranes for the construction of artificial biocompatible membranes with tuneable permeability and surface charge to be in contact with biological fluids for the transport and filtering of diffusive species, for example, in organ-on-a-chip purposes for applications like blood–brain-barrier models, or, in the medium-long term tissue and organ regeneration, such as kidneys or livers. Personal protective equipment for sanitary purposes involving filtering of particles in the micro and the nanoscale such as fabrics for biodegradable N95, KN95, or FFP2 standardized respirators and surgical masks. In that case, charged surface and mechanical protection will avoid the pass of the smallest micro and sub-micron infected droplets.
Conflicts of interest
There are no conflicts to declare.Acknowledgements
This work was supported by Networking Biomedical Research Center (CIBER), Spain. CIBER is an initiative funded by the VI National R&D&i Plan 2008–2011, Iniciativa Ingenio 2010, Consolider Program, CIBER Actions, and the Instituto de Salud Carlos III (RD16/0006/0012), with the support of the European Regional Development Fund and Spanish Ministry of Science and Innovation through the Severo Ochoa Centers of Excellence and Retos (RTI2018-097038-B-C21 and RTI2018-097038-B-C22) Programs. This work was funded by the CERCA Program, the Commission for Universities and Research of the Department of Industry and Knowledge (2017 SGR 1079) of the Generalitat de Catalunya. EE and OC want to thank The Spanish network of cell therapy (TERCEL) for funding. J. C. G. C. is grateful for the funding from the Spanish Government (MAT2016-78903-R), Junta de Castilla y León (VA317P18), Interreg V A España Portugal POCTEP (0624_2IQBIONEURO_6_E) and Centro en Red de Medicina Regenerativa y Terapia Celular de Castilla y León.References
- S. P. Adiga, C. Jin, L. A. Curtiss, N. A. Monteiro-Riviere and R. J. Narayan, Wiley Interdiscip. Rev.: Nanomed. Nanobiotechnol., 2009, 1, 568–581 CAS.
- H. Bayley, O. Braha and L.-Q. Gu, Adv. Mater., 2000, 12, 139–142 CrossRef CAS.
- H. Bayley and P. S. Cremer, Nature, 2001, 413, 226–230 CrossRef CAS.
- L. Song, M. R. Hobaugh, C. Shustak, S. Cheley, H. Bayley and J. E. Gouaux, Science, 1996, 274, 1859–1866 CrossRef CAS.
- M. Akeson, D. Branton, J. J. Kasianowicz, E. Brandin and D. W. Deamer, Biophys. J., 1999, 77, 3227–3233 CrossRef CAS.
- J. J. Nakane, M. Akeson and A. Marziali, J. Phys.: Condens. Matter, 2003, 15, R1365–R1393 CrossRef CAS.
- O. Braha, B. Walker, S. Cheley, J. J. Kasianowicz, L. Song, J. E. Gouaux and H. Bayley, Chem. Biol., 1997, 4, 497–505 CrossRef CAS.
- L. Q. Gu, O. Braha, S. Conlan, S. Cheley and H. Bayley, Nature, 1999, 398, 686–690 CrossRef CAS.
- L. Movileanu, S. Howorka, O. Braha and H. Bayley, Nat. Biotechnol., 2000, 18, 1091–1095 CrossRef CAS.
- S. Howorka, L. Movileanu, O. Braha and H. Bayley, Proc. Natl. Acad. Sci. U. S. A., 2001, 98, 12996–13001 CrossRef CAS.
- S. Cheley, L.-Q. Gu and H. Bayley, Chem. Biol., 2002, 9, 829–838 CrossRef CAS.
- R. E. Gyurcsányi, TrAC, Trends Anal. Chem., 2008, 27, 627–639 CrossRef.
- K. B. Jirage, J. C. Hulteen and C. R. Martin, Science, 1997, 278, 655–658 CrossRef CAS.
- S. B. Lee and C. R. Martin, Anal. Chem., 2001, 73, 768–775 CrossRef CAS.
- K.-Y. Chun and P. Stroeve, Langmuir, 2001, 17, 5271–5275 CrossRef CAS.
- G. Wang, B. Zhang, J. R. Wayment, J. M. Harris and H. S. White, J. Am. Chem. Soc., 2006, 128, 7679–7686 CrossRef CAS.
- J. C. Hulteen, K. B. Jirage and C. R. Martin, J. Am. Chem. Soc., 1998, 120, 6603–6604 CrossRef CAS.
- K. B. Jirage, J. C. Hulteen and C. R. Martin, Anal. Chem., 1999, 71, 4913–4918 CrossRef CAS.
- E. D. Steinle, D. T. Mitchell, M. Wirtz, S. B. Lee, V. Y. Young and C. R. Martin, Anal. Chem., 2002, 74, 2416–2422 CrossRef CAS.
- S. B. Lee, D. T. Mitchell, L. Trofin, T. K. Nevanen, H. Söderlund and C. R. Martin, Science, 2002, 296, 2198–2200 CrossRef CAS.
- R. Castro-Muñoz, K. V. Agrawal and J. Coronas, RSC Adv., 2020, 10, 12653–12670 RSC.
- G. Decher and J. D. Hong, Makromol. Chem., Macromol. Symp., 1991, 46, 321–327 CrossRef CAS.
- G. Decher and J. D. Hong, Ber. Bunsen-Ges., 1991, 1430–1434 CrossRef CAS.
- G. Decher, J. D. Hong and J. Schmitt, Thin Solid Films, 1992, 210–211, 831–835 CrossRef CAS.
- R. Castro-Muñoz, M. Z. Ahmad and V. Fíla, Front. Chem., 2020, 7, 897 CrossRef.
- K. Wulf, S. Petersen, S. Schünemann, S. Knödler, K.-P. Schmitz and K. Sternberg, Biomed. Tech., 2013, 58(SI-1-Track C) Search PubMed.
- H. Morgan and N. G. Green, AC electrokinetics: colloids and nanoparticles, Research Studies Press, 2003 Search PubMed.
- J. O. M. Bockris and A. K. N. Reddy, Modern Electrochemistry: An Introduction to an Interdisciplinary Area, Springer US, 1973 Search PubMed.
- S. S. Duchin and V. N. Šilov, Dielectric Phenomena and the Double Layer in Disperse Systems and Polyelectrolytes, John Wiley, 1974 Search PubMed.
- P. C. Hiemenz and R. Rajagopalan, Principles of Colloid and Surface Chemistry, Revised and Expanded, CRC Press, 2016 Search PubMed.
- R. J. Hunter, L. R. White and D. Y. C. Chan, Foundations of Colloid Science, Clarendon Press, 1987 Search PubMed.
- W. B. Russel, W. B. Russel, D. A. Saville and W. R. Schowalter, Colloidal Dispersions, Cambridge University Press, 1991 Search PubMed.
- J. N. Israelachvili, Intermolecular and Surface Forces, Elsevier Science, 2015 Search PubMed.
- J. Lyklema, Fundamentals of Interface and Colloid Science: Soft Colloids, Elsevier Science, 2005 Search PubMed.
- H. Helmholtz, Pogg. Ann., 1853, LXXXIX, 211 Search PubMed.
- G. Gouy, Comt. Rend., 1909, 149, 654 Search PubMed.
- D. L. Chapman, London, Edinburgh Dublin Philos. Mag. J. Sci., 1913, 25, 475–481 CrossRef.
- O. Stern, Z. Elektrochem. Angew. Phys. Chem., 1924, 30, 508–516 CAS.
- T. Luxbacher, The ZETA guide: Principles of the streaming potential technique, 1st edn, 2014 Search PubMed.
- J. B. Edel and T. Albrecht, Engineered Nanopores for Bioanalytical Applications, Elsevier, 2013 Search PubMed.
- Zeonor® 1020R Polymer, http://www.zeonex.com/applications_bio-diagnostic.asp Search PubMed.
- M. Golonka, M. Bulwan, M. Nowakowska, A. M. Testera, J. C. Rodríguez-Cabello and S. Zapotoczny, Soft Matter, 2011, 7, 9402–9409 RSC.
- H. Bukšek, T. Luxbacher and I. Petrinić, Acta Chim. Slov., 2010, 57, 700–706 Search PubMed.
- L. Holzer, F. Indutnyi, P. H. Gasser, B. Münch and M. Wegmann, J. Microsc., 2004, 216, 84–95 CrossRef CAS.
- L. A. Giannuzzi and N. C. S. University, Introduction to Focused Ion Beams: Instrumentation, Theory, Techniques and Practice, Springer US, 2004 Search PubMed.
- A. J. Erwin, W. Xu, H. He, K. Matyjaszewski and V. V. Tsukruk, Langmuir, 2017, 33, 3187–3199 CrossRef CAS.
- L. Xie, X. Ding, R. Budry and G. Mao, Int. J. Nanomed., 2018, 13, 4943–4960 CrossRef CAS.
- S. Ferraris, M. Cazzola, V. Peretti, B. Stella and S. Spriano, Front. Bioeng. Biotechnol., 2018, 6, 60 CrossRef.
- N. J. W. Penfold, A. J. Parnell, M. Molina, P. Verstraete, J. Smets and S. P. Armes, Langmuir, 2017, 33, 14425–14436 CrossRef CAS.
- P. Berndt, K. Kurihara and T. Kunitake, Langmuir, 1992, 8, 2486–2490 CrossRef CAS.
- G. Decher, Science, 1997, 277, 1232–1237 CrossRef CAS.
Footnote |
| † Electronic supplementary information (ESI) available. See DOI: 10.1039/d0ra05322h |
| This journal is © The Royal Society of Chemistry 2020 |

