 Open Access Article
Kinetic investigation of the hydrolysis of uranium hexafluoride gas†
Jason M. Richards *a,
Leigh R. Martin
 a,
Glenn A. Fugate
 *a and
Meng-Dawn Cheng
 b
b
aIsotope and Fuel Cycle Technology Division, Oak Ridge National Laboratory, One Bethel Valley Road, Oak Ridge, TN 37831, USA. E-mail: richardsjm@ornl.gov; fugatega@ornl.gov
bEnvironmental Sciences Division, Oak Ridge National Laboratory, One Bethel Valley Road, Oak Ridge, TN 37831, USA
First published on 18th September 2020
Abstract
UF6 is commonly employed in enrichment technologies and is known to react rapidly with water vapor to form radioactive particulates and hydrofluoric acid vapor. The kinetics of the UF6 hydrolysis reaction have been observed directly for the first time. The rate appears to be half order and second order for UF6 and water, respectively, with a rate constant of 1.19 ± 0.22 Torr−3/2 s−1. The proposed mechanism involves formation of the [UF6·2H2O] adduct via two separate reactions.
Uranium hexafluoride (UF6) is a key compound in the nuclear fuel cycle as the material employed in commercial enrichment, enabling production of the fuel for electricity production in nuclear power reactors. Studies evaluating the safety implications of small or large releases of UF6 within a processing facility have been performed previously,1–3 as it is well known that this material undergoes a hydrolysis reaction in ambient air according to the simplified reaction:
| UF6(g) + 2H2O(g) → UO2F2(s) + 4HF(g) |
One prior study performed an indirect measurement of the rate of the UF6 hydrolysis by monitoring the ingrowth of hydrogen fluoride with a laser-based analyzer.15 The reported rate constant of 4 ± 4 × 10⁻¹⁸ cm3 s−1 remains questionable as limited experimental details were reported. Based on their findings, and assuming pseudo-first order kinetics under these reaction conditions in excess water vapor, the reaction half-life is calculated to be on the order of 1 ms or less. Standard infrared spectroscopy instrumentation cannot scan with submillisecond temporal resolution, requiring specialized instrumentation that has only recently become available.
This work focused on observing the disappearance of UF6 under low pressure conditions by probing the most sensitive infrared (ν3 antisymmetric stretching) vibrational band,16 located at 625 cm−1, using a 5 m long-path length cell. The long path length combined with the sensitivity of the band allow the reaction rate to be investigated at sub-Torr partial pressures. The reaction is slow enough at these pressures to allow direct kinetic measurements of the hydrolysis to be made using a typical infrared spectrometer.
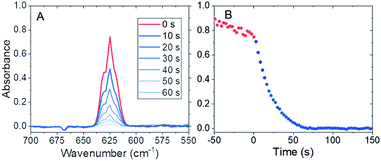
Experiments were performed in a 5 m long-path length gas cell fitted to an ABB MB3000 Fourier transform infrared spectrometer. The chamber was exposed to fluorine gas to passivate materials of construction and remove water from surfaces within the spectroscopy cell before each experiment. The UF6 was then introduced into the evacuated cell at pressures between 10 and 30 mTorr and ambient temperature (22.5 ± 0.5 °C). (Warning: UF6 is a radioactive gas that forms highly toxic hydrogen fluoride in the presence of water.) After initial infrared spectroscopy measurements were made, 60 or 80 mTorr of water vapor was injected into the system and allowed to react. Typical infrared spectra collected during the hydrolysis reaction occurred during 0.5–2 min for these conditions, as shown in Fig. 1A. Note, the reactions that occurred when water vapor was introduced at these partial pressures were approximately an order of magnitude faster than any reactions of UF6 with materials of construction. The observed rates (Fig. 1B) were significantly slower than those expected from diffusion-limited reactivity, suggesting that mixing occurred rapidly from the injection method.
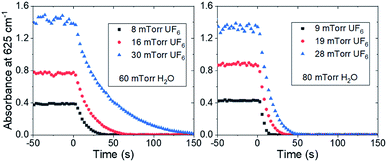
Typical changes in the absorbance due to the reaction are shown in Fig. 2 after correction for reaction with materials of construction. Each figure is the average of three experiments and the data are corrected using a linear regression of the absorbance before time zero extrapolated through the points used for initial rate determination. The initial slope of the decay was fit using a linear regression on the first five data points for each reaction condition. The data were converted from absorbance units to mTorr, and the resulting conditional reaction rates in mTorr s−1 are shown in Table 1.
 | ||
| Fig. 2 The normalized absorbance of the 625 cm−1 band in a 5 m path length cell for various partial pressures of UF6 and water vapor. Water vapor was injected at time = 0 s. | ||
| H2O (mTorr) | UF6 (mTorr) | Rate (mTorr s−1) |
|---|---|---|
| 60 ± 2 | 8.2 ± 0.5 | 0.387 ± 0.008 |
| 60 ± 2 | 16.2 ± 1.0 | 0.556 ± 0.071 |
| 60 ± 2 | 30.2 ± 1.9 | 0.709 ± 0.321 |
| 80 ± 3 | 9.1 ± 0.6 | 0.702 ± 0.100 |
| 80 ± 3 | 18.6 ± 1.5 | 1.018 ± 0.066 |
| 80 ± 3 | 28.3 ± 1.6 | 1.312 ± 0.112 |
It should be noted that the conditions under which the hydrolysis reaction rate could be measured were limited by the scan rate of the spectroscopy equipment. The concentrations had to be maintained such that the reaction rate was significantly greater than the minimized rate of UF6 consumption by the materials of construction but still had to be slow enough to have multiple measurements before the reaction was completed. Due to the high dependence of the hydrolysis reaction rate on water concentration, only two of the water concentrations measured gave reaction rates that were in the appropriate time frame bounding the measurable conditions.
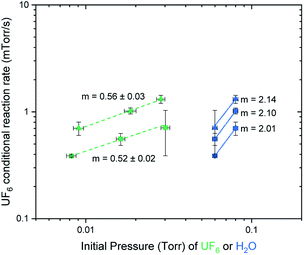
The conditional reaction rates were plotted against the partial pressures of UF6 and against the partial pressures of water on a log/log plot as shown in Fig. 3. The slope of the generated linear trends is the reaction order for UF6 and water, respectively. This suggests a rate equation:
| Rate = k[UF6]0.5[H2O]2, |
Recent work4 explores the formation kinetics of uranyl fluoride particles from the reaction of gaseous UF6 with water vapor. Some of the reactant concentrations in those studies are like those used in this work. Under humid condition (5% relative humidity and higher), the number concentration of uranyl fluoride particles produced in the hydrolysis reaction decrease during the observed time elapsed after start of the reaction (approximately 2–30 s). This is expected because the reaction is assumed to be complete in less than 2 s, and particles are undergoing various processes such as agglomeration and coagulation. Under very dry conditions (100 ppm and lower H2O) the number concentration of uranyl fluoride particles increased over the same observed time (2–30 s). Applying the kinetic parameters determined in this work, after 30 s the reaction of 100 ppm (75 mTorr) UF6 with 100 ppm (75 mTorr) of water is expected to only have consumed approximately 30% of the UF6 and 60% of the water. The increase in number concentration of uranyl fluoride particles in very dry conditions observed over the first 30 s in those studies agrees well with the reaction kinetics set forth in this work.
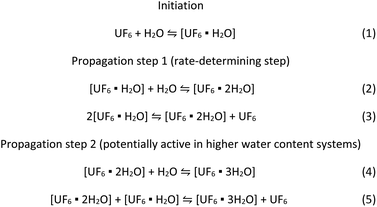
The kinetic model developed in this work can be applied to the recent work by Hu et al.13 that strongly suggests that the formation of two and three water molecule adduct species with UF6 drastically reduced the calculated energy for the hydrolysis reaction. We propose the suggested reaction mechanism below based on the experimentally determined rate equation combined with those theoretical calculations.
Scheme 1 suggests a reaction mechanism that accounts for recent work suggesting high energy barriers for 1![[thin space (1/6-em)]](https://www.rsc.org/images/entities/char_2009.gif) :
:![[thin space (1/6-em)]](https://www.rsc.org/images/entities/char_2009.gif) 1 UF6 water adducts,8–11,13 and that multiple UF6 centres, water molecules, or a combination of both may be involved,8,9,13 consistent with the reactant orders determined in this study. There is likely an initiation step where UF6 reacts with water to form an adduct (eqn (1)). Note, theoretical studies suggest the formation of the single water adduct is slightly more energetically favourable than UF6. Literature modelling suggests that further reactions toward the formation of uranyl fluoride are energetically disfavored.9–13 The increased energy stability coupled with the inability to react further suggests that this species may be formed in significant concentrations. The formation of an adduct containing two water molecules would confirm the second order behaviour in the rate equation. This may be formed by a direct reaction with water (eqn (2)) or potentially from reactions between two of the UF6·H2O species (eqn (3)). This may explain the fractional rate order, which is often explained by a complicated mechanism that have multiple pathways to reach the rate-limiting step. Both reactions may be viable because water and the UF6 water adduct could be present in similar concentrations under the conditions of this work, and the formation of an anhydrous UF6 molecule by eqn (3) would explain the fractional rate order associated with UF6. This also suggests that the UF6·2H2O species is the reactant in the rate-determining step of the mechanism.
1 UF6 water adducts,8–11,13 and that multiple UF6 centres, water molecules, or a combination of both may be involved,8,9,13 consistent with the reactant orders determined in this study. There is likely an initiation step where UF6 reacts with water to form an adduct (eqn (1)). Note, theoretical studies suggest the formation of the single water adduct is slightly more energetically favourable than UF6. Literature modelling suggests that further reactions toward the formation of uranyl fluoride are energetically disfavored.9–13 The increased energy stability coupled with the inability to react further suggests that this species may be formed in significant concentrations. The formation of an adduct containing two water molecules would confirm the second order behaviour in the rate equation. This may be formed by a direct reaction with water (eqn (2)) or potentially from reactions between two of the UF6·H2O species (eqn (3)). This may explain the fractional rate order, which is often explained by a complicated mechanism that have multiple pathways to reach the rate-limiting step. Both reactions may be viable because water and the UF6 water adduct could be present in similar concentrations under the conditions of this work, and the formation of an anhydrous UF6 molecule by eqn (3) would explain the fractional rate order associated with UF6. This also suggests that the UF6·2H2O species is the reactant in the rate-determining step of the mechanism.
The conditions of this work were such that most of the water was consumed during the reaction and may have restricted the reaction to second order. If more water was available, Hu et al.13 suggest formation of a three water adduct species is more energetically favourable. This could be accommodated by the additional reactions shown in eqn (4) and (5), providing additional reaction pathways to react with UF6.
In summary, direct observation of the hydrolysis reaction kinetics of gaseous UF6 have been accomplished under low-pressure conditions. The results show the reaction was half order and second order with respect to UF6 and water. The rate constant was determined to be 1.19 ± 0.22 Torr−3/2 s−1. The results are consistent with recent experimental observations of the formation kinetics of uranyl fluoride particles from UF6 hydrolysis under very dry conditions. The results also provide valuable data that support theoretical and computational studies.
Conflicts of interest
There are no conflicts to declare.Acknowledgements
The authors would also like to thank Dr Lee T. Trowbridge, Harold L. Jennings and Chris P. Boring for contributions to this work and the National Nuclear Security Administration's Defense Nuclear Nonproliferation Office of Research and Development for supporting this work.Notes and references
- S. P. Babenko, Med. Tr. Prom. Ekol., 2005, 30–35 CAS.
- M. Mohsendokht, J. Loss Prev. Process Ind., 2017, 45, 217–228 CrossRef CAS.
- Y.-f. Ma, Q. Li, R.-p. Hao, X.-y. Wu and X.-m. Xue, Zhongguo Zhiye Yixue, 2016, 43, 467–470 CAS , 474.
- M.-D. Cheng, J. M. Richards, M. A. Omana, J. A. Hubbard and G. A. Fugate, React. Chem. Eng., 2020, 5, 1708–1718 RSC.
- S. A. Sherrow and R. D. Hunt, J. Phys. Chem., 1992, 96, 1095–1099 CrossRef CAS.
- D. Armstrong, W. Bostick and W. Fletcher, Appl. Spectrosc., 1991, 45, 1008–1016 CrossRef CAS.
- R. Reiner, Moist air reaction with excess UF6, K/TCD-1122, Oak Ridge Gaseous Diffusion Plant, 1989 Search PubMed.
- T. Privalov, B. Schimmelpfennig, U. Wahlgren and I. Grenthe, J. Phys. Chem. A, 2002, 106, 11277–11282 CrossRef CAS.
- S. L. Garrison and J. M. Becnel, J. Phys. Chem. A, 2008, 112, 5453–5457 CrossRef CAS.
- S.-W. Hu, X.-Y. Wang, T.-W. Chu and X.-Q. Liu, J. Phys. Chem. A, 2008, 112, 8877–8883 CrossRef CAS.
- S.-W. Hu, X.-Y. Wang, T.-W. Chu and X.-Q. Liu, J. Phys. Chem. A, 2009, 113, 9243–9248 CrossRef CAS.
- M. C. Lind, S. L. Garrison and J. M. Becnel, J. Phys. Chem. A, 2010, 114, 4641–4646 CrossRef CAS.
- S.-W. Hu, H. Lin, X.-Y. Wang and T.-W. Chu, J. Mol. Struct., 2014, 1062, 29–34 CrossRef CAS.
- M. Otey and R. LeDoux, J. Inorg. Nucl. Chem., 1967, 29, 2249–2256 CrossRef CAS.
- V. Klimov, Y. M. Kravetz and A. Besmelnitzin, J. Fluorine Chem., 1992, 58, 262 CrossRef.
- B. Weinstock and G. L. Goodman, in Advances in Chemical Physics, ed. I. Prigogine, J Wiley, New York, 1965, vol. 9, pp. 169–319 Search PubMed.
Footnote |
| † Electronic supplementary information (ESI) available. See DOI: 10.1039/d0ra05520d |
| This journal is © The Royal Society of Chemistry 2020 |


