 Open Access Article
Nanoleite: a new semiconducting carbon allotrope predicted by density functional theory†‡
Ru Li a,
Larry A. Burchfieldb,
Khalid Askara,
Mohamed Al Fahimb,
Hamdan Bin Issa Al Nahyanb and
Daniel S. Choi*a
aMechanical Engineering Department, Khalifa University, PO Box 127788, Abu Dhabi, United Arab Emirates. E-mail: daniel.choi@ku.ac.ae
bAlfields Research & Consultancy, PO Box 279, Abu Dhabi, United Arab Emirates
First published on 22nd October 2020
Abstract
In this report, a new carbon allotrope named nanoleite is proposed. Its crystal structure is constructed by embedding carbon nanotubes into the matrix of lonsdaleite periodically, leading to a hexagonal primitive unit cell. The equilibrium structure of nanoleite is fully relaxed by density functional theory calculation, and we demonstrate that nanoleite is a semiconductor with an indirect energy bandgap of 2.06 eV. Furthermore, it has a high absorption coefficient in the visible spectrum range, which is comparable to that of the gallium arsenide and indium phosphide. X-ray diffraction patterns and phonon modes are also studied.
Introduction
The search for carbon allotropes beyond graphite and diamond has never ceased in the past few decades. Zero-dimensional fullerene,1 one-dimensional carbon nanotubes (CNTs),2 and two-dimensional graphene3 are some of the most common and widely studied allotropic forms of carbon, and have found applications in solar cells, field-effect transistors, sensors, electromagnetic interference shielding, batteries and supercapacitors.4–8 Other emerging forms of carbon allotropes, such as D-carbon,9 T-carbon,10 penta-graphene,11 protomene,12 novamene,13 and zayedene14 have been predicted by theorists and some have been confirmed by the experimentalists. Some of the reported carbon allotropes have extraordinary properties, such as ultra-high hardness,15 direct bandgap,10 ferromagnetic,16 and so on, which makes them highly prominent for various applications.In this report, we borrow the concept of metamaterials to construct a new carbon allotrope. For metamaterials, elements are periodically arranged to obtain extraordinary properties, such as negative refractive index,17 and perfect absorption.18 To construct our carbon allotrope, metallic armchair CNTs (6,6) are periodically embedded into the matrix of another carbon allotrope, lonsdaleite, which is also called hexagonal diamond.19 The combination of the crystal structure of CNTs and lonsdaleite, we therefore name it nanoleite. Density functional theory calculation shows that nanoleite is an indirect bandgap semiconductor with an energy bandgap of 2.06 eV, which also has a high absorption coefficient comparable to that of the gallium arsenide (GaAs) and indium phosphide (InP) in the visible spectrum range.
Crystal structure
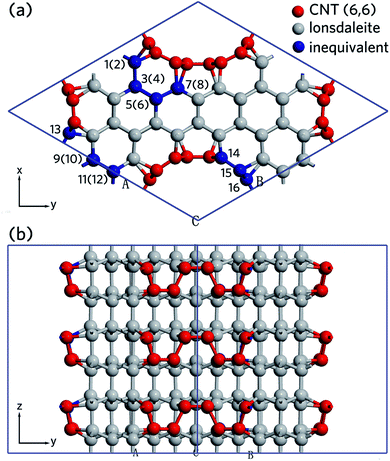
The crystal structure of nanoleite shares a similar building procedure with that of our previously reported carbon sp chains in hexagonal diamond nanocavities.14 To construct the crystal model of nanoleite, the lonsdaleite is hollowed out to form a single layer hexagonal shell cavity, and then an armchair metallic CNT with chirality index number of (6,6) is placed in the middle of the shell cavity to form the nanoleite structure. Because of the crystal structure symmetry of lonsdaleite (3-fold symmetry axis), it requires the carbon nanotube to have the same symmetry axis, which means that only the (3n,3n) tubes can fulfill the constraint. Furthermore, crystal lattice match requires the size of the hexagonal shell cavity to accommodate the diameter of the inside tubes, making the tube with a chirality index number of (6,6) and a pristine diameter of 8.14 Å the best fit. The first three structure combinations of lonsdaleite and (3,3), (6,6) and (9,9) CNTs are shown in Fig. S1.‡ Fig. S2‡ shows a 3 × 3 × 1 supercell, in which the relative position between CNTs and lonsdaleite can be identified.Fig. 1 shows the primitive cell of nanoleite relaxed in its lowest energy configuration. It has a 3-fold symmetry axis, which is compatible with crystallization in a hexagonal lattice. Fig. 1a is the view down the 3-fold symmetry z-axis, wherein the carbon atoms belonging to CNTs are highlighted in red, and the ones belonging to lonsdaleite are in grey. As indicated by the dark grey rhombus region, there are 84 carbon atoms in the primitive cell, only 16 are inequivalent and are highlighted in blue. The numbers in parenthesis indicate the carbon atoms are located underneath the top ones. The space group describes the symmetry operations and Wyckoff positions of a specific crystal. Nanoleite is found to have a space group of P31m (157#). Given this space group symmetry, one obtains all 84 atomic positions in terms of 16 inequivalent ones. The fractional coordinates, symmetry multiplicity, and Wyckoff label of the 16 inequivalent atoms are summarized in Table 1. Fig. 1b shows the side view of the crystal structure in the x-direction, where the top carbon atoms and its underneath ones are displaced.
 . The cell parameters (a = |a1| = |a2| and c = |a3|) are provided in Table 2. Column 5 reports the number nsymm and Wyckoff label (parenthesized) of equivalent atoms generated by applying symmetry operations
| Atom | a1 | a2 | a3 | nsymm (Wyckoff) |
|---|---|---|---|---|
| 1 | 0.88937 | 0.55518 | 0.19620 | 6 (d) |
| 2 | 0.89347 | 0.55732 | 0.82741 | 6 (d) |
| 3 | 0.77681 | 0.44403 | 0.32274 | 6 (d) |
| 4 | 0.77852 | 0.44715 | 0.69635 | 6 (d) |
| 5 | 0.66610 | 0.44303 | 0.19707 | 6 (d) |
| 6 | 0.66696 | 0.44558 | 0.82655 | 6 (d) |
| 7 | 0.65945 | 0.54763 | 0.32500 | 6 (d) |
| 8 | 0.65673 | 0.55038 | 0.70199 | 6 (d) |
| 9 | 0.55531 | 0.00000 | 0.32704 | 3 (c) |
| 10 | 0.55144 | 0.00000 | 0.70543 | 3 (c) |
| 11 | 0.44602 | 0.00000 | 0.19834 | 3 (c) |
| 12 | 0.44844 | 0.00000 | 0.83317 | 3 (c) |
| 13 | 0.73937 | 0.05983 | 0.66126 | 6 (d) |
| 14 | 0.22554 | 0.34689 | 0.35113 | 6 (d) |
| 15 | 0.11916 | 0.33878 | 0.34409 | 6 (d) |
| 16 | 0.06045 | 0.31516 | 0.67124 | 6 (d) |
Results and discussion
Structure properties
To obtain the equilibrium configuration and electronic properties of nanoleite, the well-established density functional theory (DFT) is employed.9–14,20–24 Density functionals including the general gradient approximation (GGA)25 and hybrid functional (HSE06) are used in the Perdew–Burke–Ernzerhof (PBE) formulation,26 with the norm-conserving PseudoDojo27 pseudopotential as implemented in the quantum simulation package QuantumATK.28 The wave functions are expanded on a plain-waves basis with a wave function cut-off of 35 hartree for both of GGA and HSE06, which guarantees the convergence of the total energy of nanoleite structure within 10−5 hartree.The Brillouin zone of nanoleite is sampled with a 6 × 6 × 12 Monkhorst–Pack k-point grid,29 with a density of ∼10 points per angstrom and shifted to Γ. The occupation method of Fermi–Dirac with a broadening of 300 K is used during the numerical simulation.
We performed simulations to fully relax the atomic positions di, also allowing the cell primitive vectors to change to get rid of the overall stress. Atomic relaxation is performed until the following criteria are reached: the total force must be less than 10−5 eV per angstrom and stress error less than 10−3 GPa. The fully relaxed crystal structure file is provided as ESI.‡
Table 1 reports the fractional coordinates of the 16 inequivalent atoms. Table 2 shows the structural parameters, such as the lattice vectors, space group, Young's modulus, and bandgap of nanoleite. The corresponding structure parameters of lonsdaleite, CNT (6,6), and fcc-diamond are summarized for comparison.
| Structure parameter | Nanoleite HSE06 (TB) | Lonsdaleite HSE06 (TB) | CNT (6,6) HSE06 (TB) | Diamond HSE06 (TB) |
|---|---|---|---|---|
| Natoms per cell | 84 | 4 | 24 | 2 |
| ΔEb per atom | 0.21 | 0.03 | −0.02 | 0 |
| Space group | 157# | 194# | 84# | 227# |
| H–M notation | P31m | P63/mmc | P42/m | Fd![[3 with combining macron]](https://www.rsc.org/images/entities/char_0033_0304.gif) m m |
| Band gap (eV) | 2.06 (2.31) | 5.43 (5.33) | 0.20 (0.06) | 5.33 (5.48) |
| Young's modulus (GPa) | 477.27 (x) | 1225.28 (x) | — | 1057.43 (x) |
| 477.56 (y) | 1225.11 (y) | — | 1057.43 (y) | |
| 674.73 (z) | 1288.61 (z) | 1293.08 (z) | 1057.43 (z) | |
| Lattice a (pm) | 1323.74 | 252 | — | 357 |
| Lattice c (pm) | 419.40 | 412 | — | — |
Simulated diffraction pattern
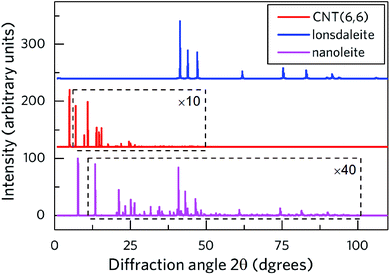
Fig. 2 shows the calculated X-ray diffraction pattern (XRD) of nanoleite in its lowest energy configuration. Meanwhile, the patterns of CNT (6,6) and the lonsdaleite are presented for comparison. To identify the peaks, the data of CNT (6,6) and nanoleite in a specific range is multiplied by 10 and 40 times, respectively. The rectangle is used to highlight the zoomed diffraction angle range. It shows that the main XRD features of the lonsdaleite can still be observed in the nanoleite, though extremely weak in the diffraction angle range of 40–100 degrees. However, the characteristic peaks of CNT (6,6) can not be identified in the nanoleite, which stems from the fact that the CNT has to change its structure to accommodate the crystal structure of the lonsdaleite. Fig. S3‡ shows that the diameter of the CNT (6,6) shrinks from 8.14 Å, in the pristine state, to 7.98 Å, in the fully relaxed nanoleite configuration, about 2% decrease.Thermal stability
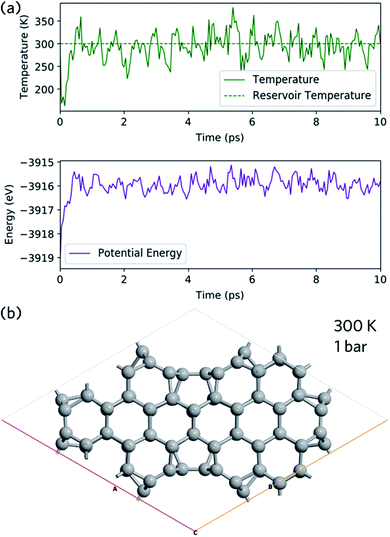
Ab initio molecular dynamics is used to study the structural stability of nanoleite. The NPT Martyna–Tobias–Klein barostat is used to keep the pressure of 1 bar and Maxwell–Boltzmann temperature of 300 K is used to initiate the velocity. Fig. 3a shows the temperature and energy variation during 10 ps simulation time, which shows a slight shock. At the end of the simulation, the last image is captured and shown in Fig. 3b, which confirms the stability of nanoleite without structural change.Electronic properties
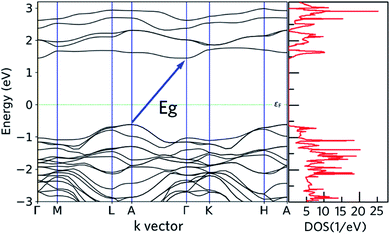
Both of the DFT-HSE06 and semi-empirical (tight binding) have been used to calculate the band structure of nanoleite. The band gaps from these two theory levels are close to each other, within 12%, thus only the DFT-HSE06 results are reported. Fig. 4 reports the calculated band structure and its density of states (DOS) around the Fermi level. The band structure depicted in Fig. 4 shows that nanoleite is an indirect semiconductor, with a bandgap of 2.06 eV.Fig. 5 shows the projected density of states (PDOS) on the atom sites of CNT (6,6) and the lonsdaleite. The PDOS is used to visualize the contribution of different orbitals to the density of states. It is noted that around the Fermi level εF, the main contribution to the conduction band comes from CNT (6,6). In comparison, both of the CNT (6,6) and lonsdaleite comparatively contribute to the valence band. This decomposition proves that the semiconducting behavior of nanoleite arises due to the presence of CNT (6,6).
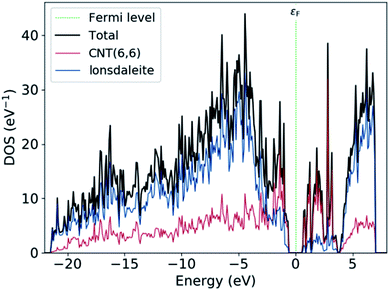 | ||
| Fig. 5 The PDOS on the CNT (6,6), which is highlighted in red, and on the lonsdaleite that is in blue. | ||
Phonon band structure
As limited by computational capability, the phonon frequencies of nanoleite are calculated by forcefield method, with an optimized Tersoff and Brenner empirical potential parameters for lattice dynamics are used.30 Fig. 6 shows the phonon band structure, which is calculated along the same k-points path as for the electronic band structure. The acoustic branches are visible as they depart from zero frequency at the point of Γ. It is found that the lower acoustic branch has a 3-fold degeneracy along the Γ–K high symmetry line. At a higher frequency range of 250–1350 cm−1, the optical phonon branches are observed to cluster and intersect with each other. Apart from the majority branches of optical phonon, four additional optical branches can be observed above the frequency of 1600 cm−1.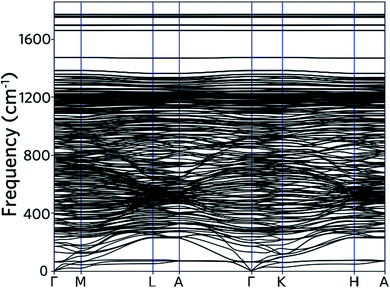 | ||
| Fig. 6 Phonon dispersion computed along the same Brillouin zone path as drawn for the electron bands in Fig. 4. | ||
The vibration mode is analyzed at q point with coordinates at (0,0,0). This shows that the first mode has a wavenumber of 59.42 cm−1, which is contributed primarily by carbon atoms that belonging to CNT (6,6). The movement direction of the carbon atoms is shown as Fig. 7, which is indicated by red arrows. Fig. 7a shows the view from z-direction, and Fig. 7b is an x-direction view. It is found that 50% of the carbon atoms move in the +z direction, while the other 50% move in the −z direction. This, results in a tangential mode, can be used as a signature to identify the nanoleite structure experimentally.
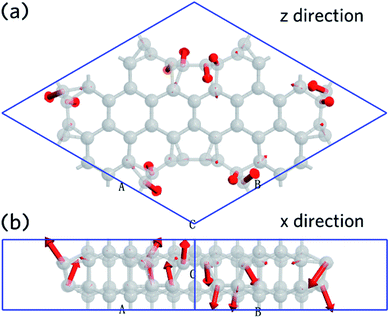 | ||
| Fig. 7 The first vibration mode calculated at the point of q (0,0,0). (a) A view down from z-direction, and a view from x-direction (b), the movement direction is highlighted in red. | ||
Optical spectrum
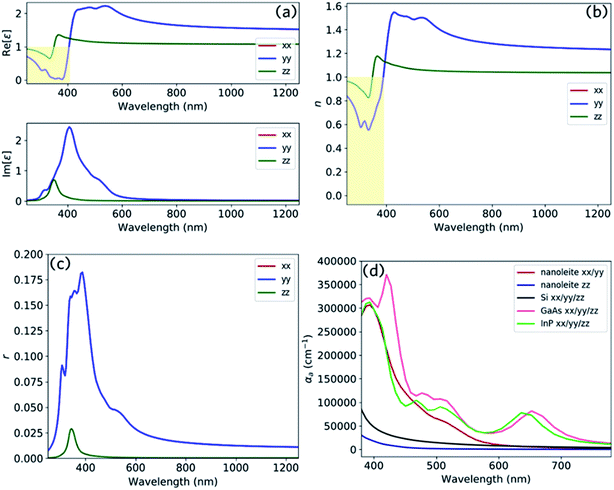
Fig. 8 reports the optical spectrum of nanoleite. It clearly shows that nanoleite is an anisotropic material, as the properties in the z direction are different from that of in the x/y direction. Fig. 8a shows the dielectric constant calculated in the range of 250–1250 nm by HSE06 functional. The real part dielectric constant is less than unity in the range of 250–375 nm in the z direction, and the range 250–406 nm in x/y direction. Furthermore, it has a refractive index less than unity in the range of 250–347 nm in the z direction, and the range of 250–388 nm in x/y direction, as shown in Fig. 8b. This distinct feature might comes from the unique structure of nanoleite, the CNTs (6,6) are periodically embedded in the matrix of lonsdaleite, which can be regarded as a metamaterial. In metamaterial, due to the electric or magnetic resonances, the values of ε or μ can be made to approach zero, leading to a near-zero refractive index (n ∼ 0).31 However, if the electric or magnetic resonances are close, but not too close, to strong optically active resonances, it will result in the reduction of the refractive index to below that of vacuum (i.e., 0 < n < 1).32 The reflectivity is reported in Fig. 8c and has a peak that appears near 380 nm. To compare the absorption performance of nanoleite to commonly used semiconductors, such as Si, GaAs, and InP, we calculated their absorption coefficient and summarized them in Fig. 8d. This confirms that nanoleite has an absorption coefficient comparable to that of the direct bandgap semiconductors, such as GaAs and InP. The absorption coefficient for the z direction is much lower than that of the x/y direction due to the tube structure of CNT (6,6), which is aligned in the z direction, shown as Fig. 1a.Conclusions
Nanoleite reported in this study qualifies as a new potentially-useful indirect semiconductor. The predicted energy bandgap, see Table 2, is comparable to that of the Si, GaAs, and InP. Furthermore, it has a high absorption coefficient comparable to that of the GaAs and InP in the visible range. Both of the appropriate energy bandgap and the high absorption coefficient make nanoleite as a good candidate for solar cell applications. The embedded CNT (6,6) renders nanoleite as a through-hole structure, which can be used as a platform to load other semiconducting organic molecular, such as poly 3-hexylthiophene,33 poly p-phenylene vinylene,34 etc. to form semiconducting heterojunctions at the interface, which could find applications for heterojunction optoelectronic devices.Conflicts of interest
The authors declare no conflicts of interest in the development of this research work.Acknowledgements
This work was supported by the research project entitled as “Development of the Emirates Advanced Materials Research Program” under the Visiting Scientist Agreement between Khalifa University of Science &Technology and Alfields Inc., signed in 2018.Notes and references
- H. W. Kroto, J. R. Heath, S. C. O'Brien, R. F. Curl and R. E. Smalley, Nature, 1985, 318, 162–163 CrossRef CAS.
- S. Iijima and T. Ichihashi, Nature, 1993, 363, 603–605 CrossRef CAS.
- K. S. Novoselov, A. K. Geim, S. V. Morozov, D. Jiang, Y. Zhang, S. V. Dubonos, I. V. Grigorieva and A. A. Firsov, Science, 2004, 306, 666–669 CrossRef CAS.
- J. Li, Y. Lu, Q. Ye, M. Cinke, J. Han and M. Meyyappan, Nano Lett., 2003, 3, 929–933 CrossRef CAS.
- Y. Wang, D. Liu, H. Zhang, J. Wang, R. Du, T.-T. Li, J. Qian, Y. Hu and S. Huang, Nano Lett., 2020, 20, 496–501 CrossRef CAS.
- Q. Huang, Y. Guo, X. Wang, L. Chai, J. Ding, L. Zhong, T.-T. Li, Y. Hu, J. Qian and S. Huang, Nanoscale, 2020, 12, 10019–10025 RSC.
- Y. Liu, J. Zhao, Z. Li, C. Mu, W. Ma, H. Hu, K. Jiang, H. Lin, H. Ade and H. Yan, Nat. Commun., 2014, 5, 5293 CrossRef CAS.
- Y.-M. Lin, C. Dimitrakopoulos, K. A. Jenkins, D. B. Farmer, H.-Y. Chiu, A. Grill and P. Avouris, Science, 2010, 327, 662 CrossRef CAS.
- D. Fan, S. Lu, A. A. Golov, A. A. Kabanov and X. Hu, J. Chem. Phys., 2018, 149, 114702 CrossRef.
- X.-L. Sheng, Q.-B. Yan, F. Ye, Q.-R. Zheng and G. Su, Phys. Rev. Lett., 2011, 106, 155703 CrossRef.
- S. Zhang, J. Zhou, Q. Wang, X. Chen, Y. Kawazoe and P. Jena, Proc. Natl. Acad. Sci. U. S. A., 2015, 112, 2372–2377 CrossRef CAS.
- F. Delodovici, N. Manini, R. S. Wittman, D. S. Choi, M. Al Fahim and L. A. Burchfield, Carbon, 2018, 126, 574–579 CrossRef CAS.
- L. A. Burchfield, M. A. Fahim, R. S. Wittman, F. Delodovici and N. Manini, Heliyon, 2017, 3, e00242 CrossRef.
- F. Delodovici, D. S. Choi, M. Al Fahim, L. A. Burchfield and N. Manini, Phys. Chem. Chem. Phys., 2019, 21, 21814–21823 RSC.
- Z. Pan, H. Sun, Y. Zhang and C. Chen, Phys. Rev. Lett., 2009, 102, 055503 CrossRef.
- J. Narayan and A. Bhaumik, J. Appl. Phys., 2015, 118, 215303 CrossRef.
- D. R. Smith, J. B. Pendry and M. C. K. Wiltshire, Science, 2004, 305, 788–792 CrossRef CAS.
- N. I. Landy, S. Sajuyigbe, J. J. Mock, D. R. Smith and W. J. Padilla, Phys. Rev. Lett., 2008, 100, 207402 CrossRef CAS.
- D. Kraus, A. Ravasio, M. Gauthier, D. O. Gericke, J. Vorberger, S. Frydrych, J. Helfrich, L. B. Fletcher, G. Schaumann, B. Nagler, B. Barbrel, B. Bachmann, E. J. Gamboa, S. Göde, E. Granados, G. Gregori, H. J. Lee, P. Neumayer, W. Schumaker, T. Döppner, R. W. Falcone, S. H. Glenzer and M. Roth, Nat. Commun., 2016, 7, 10970 CrossRef CAS.
- Y. Liu, R. O. Jones, X. Zhao and Y. Ando, Phys. Rev. B: Condens. Matter Mater. Phys., 2003, 68, 125413 CrossRef.
- I. E. Castelli, P. Salvestrini and N. Manini, Phys. Rev. B: Condens. Matter Mater. Phys., 2012, 85, 214110 CrossRef.
- F. Zhang, B. Sahu, H. Min and A. H. MacDonald, Phys. Rev. B: Condens. Matter Mater. Phys., 2010, 82, 035409 CrossRef.
- Z. Wang, X. F. Zhou, X. Zhang, Q. Zhu, H. Dong, M. Zhao and A. R. Oganov, Nano Lett., 2015, 15, 6182–6186 CrossRef CAS.
- Y. Liu, G. Wang, Q. Huang, L. Guo and X. Chen, Phys. Rev. Lett., 2012, 108, 225505 CrossRef.
- A. D. Becke, Phys. Rev. A: At., Mol., Opt. Phys., 1988, 38, 3098–3100 CrossRef CAS.
- J. P. Perdew, K. Burke and M. Ernzerhof, Phys. Rev. Lett., 1996, 77, 3865–3868 CrossRef CAS.
- M. J. van Setten, M. Giantomassi, E. Bousquet, M. J. Verstraete, D. R. Hamann, X. Gonze and G. M. Rignanese, Comput. Phys. Commun., 2018, 226, 39–54 CrossRef CAS.
- S. Smidstrup, T. Markussen, P. Vancraeyveld, J. Wellendorff, J. Schneider, T. Gunst, B. Verstichel, D. Stradi, P. A. Khomyakov, U. G. Vej-Hansen, M.-E. Lee, S. T. Chill, F. Rasmussen, G. Penazzi, F. Corsetti, A. Ojanperä, K. Jensen, M. L. N. Palsgaard, U. Martinez, A. Blom, M. Brandbyge and K. Stokbro, J. Phys.: Condens. Matter, 2019, 32, 015901 CrossRef.
- H. J. Monkhorst and J. D. Pack, Phys. Rev. B: Solid State, 1976, 13, 5188–5192 CrossRef.
- L. Lindsay and D. A. Broido, Phys. Rev. B: Condens. Matter Mater. Phys., 2010, 81, 205441 CrossRef.
- I. Liberal and N. Engheta, Nat. Photonics, 2017, 11, 149–158 CrossRef CAS.
- A. Shahsafi, Y. Xiao, J. Salman, B. S. Gundlach, C. Wan, P. J. Roney and M. A. Kats, Phys. Rev. Appl., 2018, 10, 034019 CrossRef CAS.
- E. Orgiu, N. Crivillers, M. Herder, L. Grubert, M. Patzel, J. Frisch, E. Pavlica, D. T. Duong, G. Bratina, A. Salleo, N. Koch, S. Hecht and P. Samori, Nat. Chem., 2012, 4, 675–679 CrossRef CAS.
- I. H. Campbell and B. K. Crone, Adv. Mater., 2006, 18, 77–79 CrossRef CAS.
Footnotes |
| † The genesis of this proposed new class of allotropes began with a simple “ball & stick” model proposed in March of 2020 by one of the authors (Larry A. Burchfield) of this work. This in turn leads to the concept of an entirely new classification of carbon allotropes, which is based on the possibility of having multiple nanotubes in a single hexagonal diamond cage. Additionally, an alternative class of allotropes is proposed having different diameter carbon nanotubes housed in a hexagonal diamond cage. |
| ‡ Electronic supplementary information (ESI) available: Supercell crystal structure, carbon nanotube diameter variation, structure combination of lonsdaleite and (3,3), (6,6) and (9,9) carbon nanotubes. CCDC 2034541. For ESI and crystallographic data in CIF or other electronic format see DOI: 10.1039/d0ra05593j |
| This journal is © The Royal Society of Chemistry 2020 |

