 Open Access Article
Study on the unsteady state oxidative coupling of methane: effects of oxygen species from O2, surface lattice oxygen, and CO2 on the C2+ selectivity†
Suji Yoon‡
ab,
Seoyeon Lim‡ab,
Jae-Wook Choia,
Dong Jin Suhac,
Kwang Ho Song bc and
Jeong-Myeong Ha
 *acd
*acd
aClean Energy Research Centre, Korea Institute of Science and Technology, Seoul 02792, Republic of Korea. E-mail: jmha@kist.re.kr
bDepartment of Chemical and Biological Engineering, Korea University, Seoul 02841, Republic of Korea
cGraduate School of Energy and Environment (Green School), Korea University, Seoul 02841, Republic of Korea
dDivision of Energy and Environment Technology, KIST School, Korea University of Science and Technology, Seoul 02792, Republic of Korea
First published on 30th September 2020
Abstract
This study examined the effects of oxygen species on the unsteady-state oxidative coupling of methane (OCM) using a lengthy catalyst bed of Na2WO4/Mn/SiO2. The reaction conditions, including the methane-to-oxygen ratio, ratio of feed gas dilution by N2, quantity of catalyst, and feed flow rate were adjusted for the continuous flow fixed bed reaction system. While the O2 gas initiated methyl radical formation from methane, the surface lattice oxygen atoms improved the dehydrogenation of paraffins to olefins without significant activation of methane. The addition of CO2 as a mild oxidizing agent was also tested and slightly improved OCM selectivity with slightly lower methane conversion were observed.
1. Introduction
The vast reserves of natural and shale gas have led to global interest in converting methane, their major component, to valuable chemicals. The oxidative coupling of methane (OCM) can directly produce ethylene using oxidizing agents including oxygen gas at a high reaction temperature (>600 °C), and hence it is a promising way to use the highly stable methane as feedstock. The proposed mechanism for OCM is composed of parallel and consecutive heterogeneous and gas-phase reactions.1 The catalyst surface activated by the co-fed oxygen produces methyl radicals by hydrogen abstraction from methane. The methyl radicals can then be converted to the desired ethane in the gas phase, or further oxidized to the undesired CO and CO2. It was suggested that an industrially feasible OCM process can be developed if the C2+ products (hydrocarbons containing two or more carbon atoms) achieve a yield above 25% and a selectivity of 75–80%.2–9Because there is a critical technological barrier for the selective formation of olefins and paraffins while suppressing the deep oxidation of methane to CO and CO2,6,8,10 many selective oxidation catalysts have been prepared for the OCM reaction. For unpromoted oxides of alkali, alkaline-earth, and rare earth metals, low CH4 conversion and high C2+ selectivities were observed, along with lower C2+ yields (<12%),11 although moderate OCM activity was achieved at lower reaction temperatures (<750 °C).12 Perovskites, which are well-defined crystalline mixed oxides containing two different metals, were also used for catalyzing OCM,13–15 exhibiting improved activity with promoter addition.1,12 Among them, Na2WO4/Mn/SiO2 is one of the most effective and stable OCM catalysts.9,16–21 An optimized catalyst, composed of 2 wt% Mn and 5 wt% Na2WO4 on SiO2, has exhibited ∼25% C2+ yield.6 The remarkable long-term stability of Na2WO4/Mn/SiO2 (1000 h) was also reported for continuous-flow reactions.21 Although the origin of its high catalytic activity has not yet been elucidated,22 the unusual formation of α-cristobalite SiO2 phase during calcination at 750–850 °C has been reported as a distinguishing feature of a good catalyst,23 and the active species has been suggested to be Na+ or Na2WO4 on silica surface with distorted WO42− tetrahedra formed during phase transition.23–25 In addition to the roles played by Na2WO4, manganese oxide was reported to improve the oxygen mobility via reduction of Mn3+ to Mn2+.26 Because of the proposed oxygen activation by Mn in the Na–O–Mn composites,27 the selective formation of ethylene, which can occur by oxidative or non-oxidative dehydrogenation of ethane, can be controlled by tuning the surface Mn concentration.24,28 Improved OCM activity by the addition of several additives to Na2WO4/Mn/SiO2 has also been reported.9,29
Although a number of selective catalysts have been developed, a better understanding of the reaction conditions is also required to achieve a feasible OCM process. Because of the limited supply of O2 and the high CH4 conversion through the reactor, in which a reactant mixture flows downward through the catalyst bed, the conditions including reactant compositions in the upper catalyst bed may be significantly different from those in the lower catalyst bed. When methane and oxidant are flown through the oxygen-rich top bed, the oxidant (mostly O2) can be adsorbed on the catalyst surface. The adsorbed oxygen species activates methane by abstracting H to form methyl radicals, which are coupled to form ethane. In the oxygen-deficient bottom layer, methyl radicals, C2+ products, and carbon oxides are present and can interact with the unreacted methane and oxidant. The unreacted O2 can activate methane by either forming methyl radical or deeply oxidize the highly active C2+ products to CO and CO2, thereby decreasing the C2+ selectivity. The amount of initially supplied oxidants also influences the level of deep oxidation products in the bottom layer.
By using less-active oxidizing agents, including H2O and CO2, the selectivity of OCM products can be improved by suppressing the burning of valuable hydrocarbons to form CO and CO2.30 Water as an oxidant improved the coupling selectivity over perovskite catalysts, exhibiting increased C2 production with increasing partial pressure of steam.31 CO2 has also been suggested as an alternative oxidant to O2.32–37 The formation of surface lattice oxygen atoms from CO2 has been observed on PbO–MgO and PbO–CaO catalysts, which improves the abstraction of hydrogen atoms from methane.32,35 In Na2WO4/Mn/SiO2, the presence of CO2 caused structural modification to improve catalytic activity.38 The formation of hot spots, which accelerate the deep oxidation to CO and CO2 because of significant local exothermic reaction, was observed in the catalyst bed of a bench-scale OCM reactor,39 and these hot spots can be reduced by the presence of CO2 with high heat capacity.40 In addition to the improved OCM activity, the presence of CO2 stabilized the lithium-doped MgO catalyst and suppressed its deactivation.36 For oxidative dehydrogenation, it was suggested that CO2 improves selective OCM and stabilizes the catalysts by poisoning the nonselective active sites.41
The goal of this study is to understand the local OCM reaction throughout the catalyst bed under continuously changing reaction conditions, which can be attributed to the limited supply of oxidizing reagents (particularly O2) in the fixed bed system. The temperature (750–850 °C), N2 dilution ratio, CH4/O2 ratio, catalyst bed thickness, total feed flow rate, and the co-feeding rate of CO2 were varied to study the behaviors of reactants and products under these continuously changing conditions. The effects of O2 and CO2 (as strong and mild oxidizing reagent, respectively) on the local OCM reaction were investigated in a long fixed bed system, which is meant to simulate possible scaled-up reactors. CO2 as a mild oxidizing reagent can also function as a diluent in the OCM process, and it can be recycled with the unreacted methane in the industrial scale process. With continuous consumption of O2 throughout the long catalyst bed and the formation of O2-deficient region, the roles of lattice oxygen atoms on the OCM were also observed. Although a steady state was not achieved while the lattice oxygen atoms were being consumed for the OCM, the unsteady state reaction examined here is useful for understanding the OCM reaction using lattice oxygen atoms. The spent catalysts were characterized using X-ray diffraction (XRD), X-ray photoelectron spectroscopy (XPS), and Raman spectroscopy to reveal changes in the catalysts during the OCM reaction.
2. Experimental
2.1. Materials
All chemicals were used without further purification. Sodium tungstate dihydrate (Na2WO4·2H2O, 99+%) was purchased from Yakuri Pure Chemicals (Kyoto, Japan). Manganese nitrate hexahydrate (Mn(NO3)2·6H2O, 98%) was purchased from Kanto Chemical (Tokyo, Japan). Silica gel (SiO2, 60–325 mesh, 99.5%) was purchased from Johnson Matthey (Royston, United Kingdom). Manganese(II) tungsten oxide (MnWO4, 99.9%) was purchased from Alfa Aesar (Haverhill, Massachusetts, USA). Manganese(III) oxide (Mn2O3, 99.9%) was purchased from Sigma-Aldrich (St. Louis, Missouri, USA). Methane (CH4, 99.95%), oxygen (O2, 99.995%), nitrogen (N2, 99.9%), and carbon dioxide (CO2, 99.99%) were purchased from Shinyang Sanso (Seoul, Korea). DI water (18.2 MΩ m) was prepared using an aquaMAX-Ultra 370 series water purification system (Young Lin Instruments, Anyang, Korea).2.2. Catalyst preparation
The catalyst containing 5 wt% Na2WO4 and 2 wt% Mn on SiO2 (Na2WO4/Mn/SiO2) was prepared using a mixed slurry method.39,42 Silica gel (28 g) was mixed with DI water (150 mL) and stirred at 105 °C for 1 h under reflux. Mn(NO3)2·6H2O (3.146 g) dissolved in DI water (10 mL) and Na2WO4·2H2O (1.684 g) dissolved in DI water (10 mL) were added drop-wise to the boiling mixture using a syringe pump over 15 min. The prepared thick paste was dried in air at 105 °C for 16 h and then calcined in air at 800 °C for 5 h. Prior to the reaction, the prepared catalyst powder was passed through 70–140 mesh.2.3. Catalytic activity measurement
The catalytic reaction was performed using a fixed bed cylindrical quartz reactor (ID = 6 mm, length = 370 mm) (Fig. S1†). The unreacted O2 leaving the catalyst bed can contribute to further homogeneous oxidation of the C2+ products to CO and CO2 before the product mixture was inactivated by cooling,38 which hinders interpretation of the reaction results. To reduce homogeneous reaction of the product mixture, a narrow exit was introduced on the reactor to encourage its fast outflow. The outlet of the reactor was narrower than the inlet (1 vs. 6 mm). The catalyst bed was located at the center of the reactor, with quartz wool placed at its upper and lower ends. ZrSiO4 beads (Cenotec, Co. Ltd.) were positioned on the top of the catalyst bed to minimize the homogeneous reactions. A reaction mixture of CH4, O2, N2, and CO2 flowed into the catalyst bed. Notably, the furnace temperature, which was used as the reaction temperature in this study, was controlled (Fig. S2†). The measured temperature of catalyst bed was 0–40 °C higher, depending on the position in the catalyst bed and the reaction conditions. The temperature measured at the bottom of catalyst bed was closest to the furnace temperature. Because the change of temperature though the catalyst bed was similar at each reaction temperature, we used the furnace temperature as the reaction temperature for convenience. Gas hourly space velocity (GHSV) was adjusted using catalyst bed volume and reactant flow rate. Water formed during the OCM reaction was removed at a cold trap (−2 °C) connected to a chiller (VTRC-620, Jeio Tech). After an hour of isothermal operation, the product mixture was collected and analyzed using a thermal conductivity detector (TCD) and a flame ignition detector (FID) installed onto an online-gas chromatography system (Agilent 7890A). CH4, O2, N2, CO, and CO2 were analyzed using the TCD with a Carboxen 1000 column (Supelco, 60–80 mesh, 4.6 m × 1/8 in × 2.1 mm), and the hydrocarbons were analyzed using the FID with an HP-PLOT Al2O3 S capillary column (50 m × 320 μm × 8 μm). The catalytic performance was characterized by the following parameters:O2-consumption for product i, the fraction of O2 in the feed required to convert CH4 into each product component i, was obtained using the following relationship described in Table 1:
| Reaction |
|---|
CO production: CH4 + ![[/]](https://www.rsc.org/images/entities/char_e0ee.gif) O2 → CO + 2H2O O2 → CO + 2H2O |
| CO2 production: CH4 + 2O2 → CO2 + 2H2O |
| C2H6 production: CH4 + ¼O2 → ½C2H6 + ½H2O |
| C2H4 production: CH4 + ½O2 → ½C2H4 + H2O |
| C3H8 production: CH4 + ⅓O2 → ⅓C3H8 + ⅔H2O |
| C3H6 production: CH4 + ½O2 → ⅓C3H6 + H2O |
2.4. Catalyst characterization
XRD results were collected to observe the catalysts' crystal structures using a Shimadzu XRD-6000 device equipped with a CuKα1 (λ = 0.15406 nm) source. Raman spectroscopy analysis was performed using a Renishaw InVia Raman microscope. The surface electronic structures were analyzed using a PHI 5000 Versa Probe X-ray photoelectron spectroscope at Korea Basic Science Institute (Busan, Korea). The XPS spectra were calibrated using C 1s peak at 284.6 eV.3. Results and discussion
3.1. Effects of CH4/O2 ratio and N2 dilution on catalysis
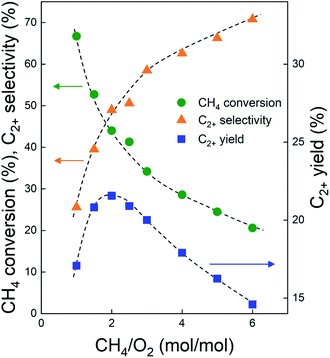
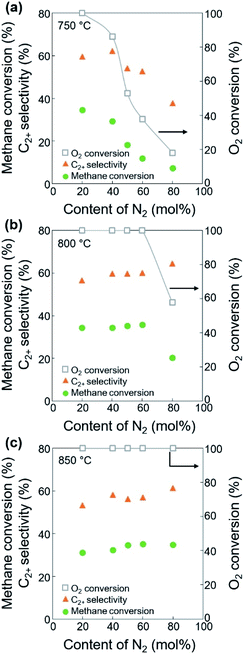
Before investigating the effects of reaction conditions on the OCM results, the effects of O2 concentration or the CH4/O2 ratio on the OCM activity were studied. CH4/O2 = 3 mol/mol was selected as an optimal reaction condition in this study because of the high C2+ selectivity with moderate CH4 conversion, although the highest C2+ yield was not achieved using this ratio (Fig. 1 and Table S1†). Notably, in this study, C2+ compounds include ethane, ethylene, propane, and propylene. When CH4/O2 was adjusted from 1 to 6 mol/mol at 800 °C, the highest C2+ yield of 21.5% (44.0% CH4 conversion and 49.0% C2+ selectivity) was achieved at 800 °C when CH4/O2 = 2 mol/mol. The C2+ selectivity sharply increased with increasing CH4/O2 ratio up to 3 mol/mol, and then steadily increased. Based on these observations, we selected CH4/O2 = 3 mol/mol for the good CH4 conversion and high C2+ selectivity. The observed increase in C2+ selectivity and decrease in CH4 conversion at a higher CH4/O2 ratio (i.e., reducing the limited supply of oxygen reactant) were consistent with the results of previous studies.43 At higher CH4/O2 ratios, the amount of O2 was insufficient for activating the large number of methane molecules, thus the CH4 conversion decreased. At lower CH4/O2 ratios, the formation of methyl radicals was improved by the high partial pressure of O2 to achieve high CH4 conversion, but the methyl radicals were also easily oxidized to CO and CO2 to decrease the C2+ yield (Table S1†). These observations suggest that a moderate CH4/O2 ratio is required to achieve a high C2+ yield by combining the CH4 conversion and C2+ selectivity.With the CH4/O2 ratio fixed at 3 mol/mol, an optimized N2 dilution ratio of 20% (v/v) or CH4/O2/N2 = 3/1/1 mol/mol/mol produced the best CH4 conversion and C2+ selectivity (Fig. 2 and Table S2†). High concentrations of methane and O2 can accelerate the reaction rates, and the deep oxidation of methane to CO and CO2 may occur along with the formation of hot spots because of the large heat of reaction.39 Diluting the reactant mixture decreases the partial pressures of methane and O2 and thus improves the selectivity for coupled C2+ hydrocarbons while suppressing the formation of CO and CO2.39,44,45 This change in the OCM results was more significant at the higher temperatures of 800–850 °C (with CH4 conversions > 20%) and less significant at 750 °C (with CH4 conversions < 20%). When the feed was highly diluted at the low reaction temperature, the formed methyl radicals may not be able to undergo gas-phase coupling with other methyl radicals in the highly diluted environment, which may reduce the C2+ selectivity. The general trend of increasing C2+ selectivity with increasing CH4 conversion, under different reaction conditions for the same catalysts, has also been observed in our previous studies.46–48
The ratios of CO/CO2 and olefins/paraffins increased at lower dilution by N2 or higher partial pressures of the reactants (Fig. 3, S3, and Table S2†). Because higher partial pressures of the reactants are expected to improve the formation of CO2 and increase the olefins/paraffins ratio,44 the improved formation of CO rather than CO2 we observed must come from another reaction pathway, which will be discussed later in the Section 3.2. Note that the amount of O2 required for forming CO2 is 1.33 times larger than that for forming CO, and the production of olefins from methane requires more than twice the amount of O2 required to produce paraffins. Because of the limited supply of O2 in this study, the deep oxidation to CO and CO2 consumed more O2 and suppressed the methane activation and the dehydrogenation, and this lowered the olefins/paraffins ratio.
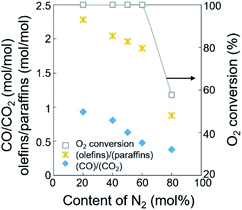 | ||
| Fig. 3 Ratios of olefins/paraffins and CO/CO2 for the dehydrogenation of paraffins and the oxidation of CO, depending on the content of N2 diluent at 800 °C. | ||
3.2. Effects of catalyst bed thickness and feed flow rate on catalysis
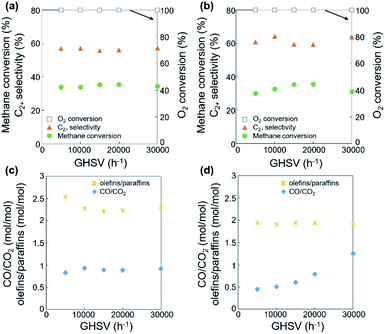
Using the fixed CH4/O2 ratio and N2 dilution, the effects of oxygen species on the OCM activity were investigated. The oxygen species activating methane and other hydrocarbons change throughout the long catalyst bed at a fixed flow rate. Both O2 gas and surface oxygen species contribute to OCM, while only the latter are present at the O2-deficient bottom part of the bed. With increasing catalyst bed thickness and the same flow rates of reactants, along with increasing residence time and decreasing GHSV, the reaction results did not significantly change when the O2 was completely converted (Fig. 4a, c, S4, Tables S3 and S4†). While incomplete conversion of O2 was observed at lower GHSV and lower reaction temperature, the 100% O2 conversion produced almost the same CH4 conversion (32.1–35.9%) along with 50.9–59.8% C2+ selectivity and 16.8–20.5% C2+ yield. The negligible C2+ production and CH4 conversion in the O2-deficient region (when 100% O2 conversion was reached) indicated that the O2 gas was required for significant conversion of methane to the C2+ compounds. Compared to the smaller changes in CH4 conversion and C2+ selectivity, the olefin selectivity increased with increasing catalyst bed thickness, indicating that the olefins were formed by the oxidative dehydrogenation of paraffins at the O2-deficient region. Based on these observations, the oxidative dehydrogenation of paraffins to olefins can be initiated by the surface lattice oxygen atoms. In contrast, the production of methyl radicals that contributed to CH4 conversion was less initiated by these surface lattice oxygen atoms because there was no significant increase of CH4 conversion at the O2-deficient region. Therefore, the surface lattice oxygen atoms, which were formed by diffusion of bulk lattice oxygen atoms to the catalyst surface, mainly dehydrogenated the paraffins to olefins. Meanwhile, the surface-adsorbed oxygen atoms from the bulk O2 gas preferentially converted methane to methyl radicals, which were further coupled to produce paraffins. In addition to the formation of olefins, the production of CO2 also slightly increased with increasing catalyst bed thickness, indicating that dehydrogenation using surface lattice oxygen species was accompanied by deep oxidation to form CO2 as by-product.The OCM was also studied at a fixed catalyst bed thickness (0.18 mL or 6.4 mm) and adjustable feed flow rates (15–90 mL min−1) to confirm the role of each oxygen species at CH4/O2/N2 = 3/1/1 mol/mol/mol (Fig. 4b, d, S5, Tables S5 and S6†). When 100% O2 conversion was achieved, the CH4 conversion (28.5–35.5%) and C2+ selectivity (56.5–64.2%) were not significantly adjusted at 800–850 °C, indicating no significant dependence of OCM activity on the feed flow rate.
While the dehydrogenation of paraffins to olefins occurred at the O2-deficient region using surface lattice oxygen species, as depicted in Fig. 4 and Table S3,† decreasing the feed flow rate, which has the same effect as increasing the catalyst bed thickness at a the fixed flow rate, did not significantly affect the dehydrogenation activity (Table S5†). A turbulent flow in the catalyst bed may suppress formation of the O2-deficient region, obscuring the effects of surface lattice oxygen species.
In addition to dehydrogenation, the preferred formation of CO2 over CO was observed, which indicates deeper oxidation to CO2 at a lower GHSV, lower feed flow rate, or longer residence time. Particularly at 850 °C, the CO/CO2 ratio significantly decreased at lower feed flow rate or longer residence time (Table S5†). The improved formation of CO2, which consumed a large quantity of oxygen species, also reduced the CH4 conversion because of the lack of oxidizing reagents. The preferred formation of CO at a shorter residence time can be attributed to the gas-phase formation of CO from methyl radicals.5,49 CO can be preferentially produced when a methyl radical reacts with O2 instead of another methyl radical, increasing the CO/CO2 ratio.
The reactions preferred by the adsorbed O2 and the surface lattice oxygen species are depicted in Fig. 5. Methane molecules were activated by the surface-adsorbed O2 to form methyl radicals, which were then coupled to ethane. Ethane molecules were oxidatively dehydrogenated by the surface lattice oxygen species to form ethylene. The activation of methane molecules to methyl radicals by the surface lattice oxygen species was negligible; however, the dehydrogenation of paraffins and deep oxidation of hydrocarbons can be preferred by the surface lattice oxygen species.
3.3. Effects of the catalyst bed thickness on the catalysis with co-fed CO2
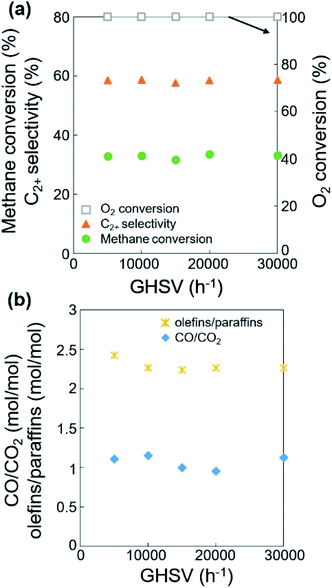
Based on the improved formation of CO2 at lower feed flow rates, we studied the effects of a mild oxidant such as CO2 on the OCM selectivity (or the product distributions of paraffins, olefins, CO, and CO2). As one of the products of OCM, CO2 can act as a diluent or a mild oxidant replacing the diluent N2 and the oxidant O2.36,38,50 As a mild oxidant, a moderate concentration of CO2 has been reported to improve the C2+ selectivity and reduce the CH4 conversion.38,51,52 For example, MgO or Sm2O3-based catalysts exhibited increased C2+ selectivity with a low partial pressure of CO2.32,53 Suppressed OCM activity with CO2 has also been reported: Li/MgO was poisoned by CO2,54 and Na2WO4/Mn/SiO2 was deactivated by concentrated CO2.38 Nevertheless, it may be possible to modify the OCM activity by using an appropriate amount of co-fed CO2 as mild oxidant to replace the mixture of N2 and O2. Thus, the OCM reaction was tested at a fixed feed flow rate, variable catalyst bed thickness, and the 20% N2 in the feed was replaced by 16% CO2 + 4% N2 in order to investigate this possibility and understand the effects of the adsorbed oxygen atoms (Fig. 6, S6, Tables S7 and S8†).When increasing the catalyst bed thickness (or decreasing the GHSV), CH4 conversion and C2+ selectivity reached 30.8–34.5% and 51.1–61.9%, respectively at 100% O2 conversion (Table S5†), which is similar to the results using N2 as diluent (32.1–35.9% and 50.9–59.8%, respectively, Table S3†). Compared with the use of N2 diluent, the co-feeding of CO2 slightly lowered CH4 conversion and slightly improved C2+ selectivity by 1.5–4.7%, achieving almost identical C2+ yields. The improved C2+ selectivity was more distinct when the O2 was not completely consumed (O2 conversion < 100%), particularly when GHSV >20![[thin space (1/6-em)]](https://www.rsc.org/images/entities/char_2009.gif) 000 h−1 at 750 °C.
000 h−1 at 750 °C.
In terms of the selectivity between CO and CO2, a larger CO/CO2 ratio was observed when CO2 was co-fed compared to using the N2 diluent alone (Tables S3 and S7†). The improved formation of CO with CO2 co-feeding can be attributed to the catalytic conversion of CO2 to CO. While this conversion can occur by either the reduction or catalytic dissociation of CO2, a highly oxidizing environment can suppress the reduction reaction by hydrogen generated in the dehydrogenation of paraffin or reduction of water. The catalytic dissociation of CO2 to CO and O may occur to increase the concentration of CO,50,51 and the produced oxygen atoms may improve the C2+ selectivity.
The actual temperatures of the top, middle, and bottom layers of the 35.3 mm catalyst bed were measured (Fig. S2†). The temperature was observed to decrease from the top to the bottom layer, indicating that the involved reactions occurred at the entrance of the catalyst bed.
We also summarized all the reaction results obtained in this study in terms of C2+ yield, depending on CH4 conversion and O2 conversion (Fig. S7†). Regardless of reaction conditions, CH4 conversion, O2 conversion (for <100%), and C2+ yield increased proportionally with each other, indicating that the formation of C2+ compounds was not significantly adjusted by varying the reaction conditions, as long as O2 was present. Thus, the effects of surface lattice oxygen species may not be significant while O2 is present.
3.4. Identification of crystal structures
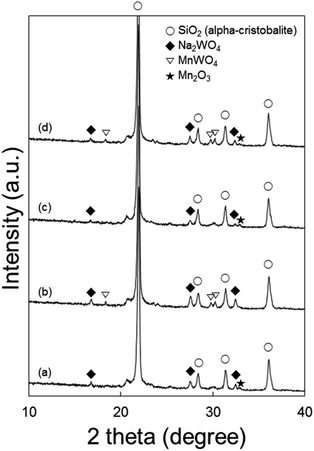
To understand the effects of catalyst structures on the OCM activity, the spent catalysts were characterized (Fig. 7). There was no significant difference between catalysts spent using N2 as diluent alone and with CO2 co-feeding. However, when using a longer catalyst bed or smaller GHSV, catalysts on the top and bottom of the bed exhibited different structures. The formation of MnWO4 was distinct at the bottom (O2-deficient region) but not clearly observed at the top (O2-rich region). While MnWO4 had been reported in the literature as either an active or inactive component,22,28,47,55,56 we observed moderate OCM activity on MnWO4 powder (Fig. S9†). While the co-existing Na2WO4 and α-cristobalite SiO2 are known as key components for good OCM catalysts,22,23,57 it is not clear whether the formation of MnWO4 reduced the OCM activity or not in this study.When heated to 800 °C in air, the Na2WO4 and Mn2O3 phases were found to disappear for the fresh catalyst at room temperature, indicating the melting of these solid materials (Fig. S8(a)†). Compared to these, MnWO4 survived, while maintaining its solid structure at the OCM reaction temperature. α-Cristobalite SiO2 exhibited a peak shift toward smaller 2θ or larger d-spacings, indicating thermal expansion of the crystal structure.
3.5. Study of catalyst surface by Raman spectroscopy and XPS
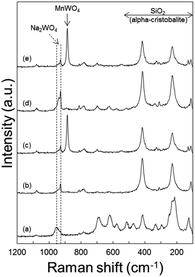
Raman spectra of the spent catalysts also confirmed the formation of MnWO4 in the O2-deficient region (bottom layer of catalyst bed) by the distinct MnWO4 peak at 885 cm−1 for both CO2-free and CO2-added feeds (Fig. 8). Raman bands indicating Na2WO4 were observed in the fresh catalyst and spent ones at all regions of the bed. Notably, the bands at or below 500 cm−1 can be attributed to α-cristobalite SiO2, and those at 500–700 cm−1 can be attributed to manganese oxides.24 When heated to 800 °C in air, Mn2O3 and α-cristobalite SiO2 peaks became weaker than those of the fresh catalyst, indicating that these phases became weaker or less ordered at high temperatures (Fig. S8(b)†).In terms of surface electronic structures, the spent catalysts exhibited more intense Na 1s and Mn 2p peaks when only N2 was used as diluent in the reaction (Table S9†). The O 1s peaks at 530.9 eV indicating the presence of Na2WO4 were stronger than those with co-fed CO2 (Fig. S10†). The peaks at 532.6 eV are assigned to SiO2. Compared to the fresh catalyst, the spent catalysts after reaction with N2 as the only diluent or with co-fed CO2 had much higher surface concentrations of Mn as measured by XPS (Table S9†). This growing surface concentration of Mn can be attributed to the formation of MnWO4, even though the distinct peaks could not be identified because the Mn may have protruded to the surface by complexation with W species.47
The spent catalyst from the O2-deficient region (which exhibited the formation of MnWO4) was re-used for the OCM, and the activity was compared with the fresh one (Table 2). The spent catalyst exhibited higher C2+ selectivity, higher C2+ yield, and higher olefins/paraffins ratio by 3.7–9.4%, 4.9–10.4%, and 0–7.6%, respectively. Therefore, the spent catalysts containing MnWO4 produced more C2+ compounds along with a higher dehydrogenation activity. These observations confirmed that dehydrogenation occurred preferably in the O2-deficient region, which exhibited the formation of MnWO4.
| Reaction temperature (°C) | X(CH4) (%) | X(O2) (%) | S(C2+) (%) | Y(C2+) (%) | Olefins/paraffins (mol mol−1) |
|---|---|---|---|---|---|
a GHSV = 10![[thin space (1/6-em)]](https://www.rsc.org/images/entities/char_2009.gif) 000 h−1, CH4/O2/N2 = 3/1/1 mol/mol/mol, total feed flow rate = 30 mL min−1.b X(CH4): CH4 conversion, X(O2): O2 conversion, S(C2+): C2+ selectivity, Y(C2+): C2+ yield. 000 h−1, CH4/O2/N2 = 3/1/1 mol/mol/mol, total feed flow rate = 30 mL min−1.b X(CH4): CH4 conversion, X(O2): O2 conversion, S(C2+): C2+ selectivity, Y(C2+): C2+ yield. |
|||||
| Fresh Na2WO4/Mn/SiO2 | |||||
| 750 | 35.2 | 100 | 54.5 | 19.2 | 2.12 |
| 800 | 35.3 | 100 | 51.5 | 18.2 | 2.49 |
| 850 | 33.4 | 100 | 45.9 | 15.4 | 3.77 |
![[thin space (1/6-em)]](https://www.rsc.org/images/entities/char_2009.gif) |
|||||
| Spent Na2WO4/Mn/SiO2 prepared in the O2-deficient region | |||||
| 750 | 35.0 | 98.2 | 59.6 | 20.8 | 2.11 |
| 800 | 35.8 | 100 | 53.4 | 19.1 | 2.68 |
| 850 | 34.1 | 100 | 49.9 | 17.0 | 3.98 |
4. Conclusions
The catalytic oxidative coupling of methane to C2+ compounds was examined under various reaction conditions, and the following results were obtained.(i) Oxygen species formed by the adsorption of gas-phase O2 preferentially activated methane molecules to produce methyl radicals, while those formed by the diffusion of bulk lattice oxygen atoms preferred the dehydrogenation of paraffins to olefins.
(ii) The co-feeding of CO2 slightly increased the C2+ selectivity compared to the reaction without CO2 co-feeding; however, no significant improvement was observed exhibiting almost identical C2+ yield, although beneficial effects have been reported.
(iii) The formation of MnWO4 on the catalyst was improved in the O2-free environment at the O2-deficient bottom of the catalyst bed, which exhibited the preferred dehydrogenation reaction. This also confirmed the diffusion of bulk lattice oxygen atoms to the catalyst surface.
In this study, we focused on the OCM reaction in the non-steady states. The roles of surface lattice oxygen atoms and the reaction-initiated changes in the catalyst bed were clearly observed. Those results will help researchers and engineers understand the scaled-up OCM processes for the conversion of methane to paraffins and olefins.
Conflicts of interest
There are no conflicts to declare.Acknowledgements
This research was supported by C1 Gas Refinery Program through the National Research Foundation of Korea (NRF) funded by the Ministry of Science and ICT (2015M3D3A1A01064900).Notes and references
- S. Lim, J.-W. Choi, D. J. Suh, K. H. Song, H. C. Ham and J.-M. Ha, J. Catal., 2019, 375, 478–492 CrossRef CAS.
- B. L. Farrell, V. O. Igenegbai and S. Linic, ACS Catal., 2016, 6, 4340–4346 CrossRef CAS.
- J. C. W. Kuo, C. T. Kresge and R. E. Palermo, Catal. Today, 1989, 4, 463–470 CrossRef CAS.
- A. M. Maitra, Appl. Catal., A, 1993, 104, 11–59 CrossRef CAS.
- J. H. Lunsford, Angew. Chem., Int. Ed., 1995, 34, 970–980 CrossRef CAS.
- U. Zavyalova, M. Holena, R. Schlogl and M. Baerns, ChemCatChem, 2011, 3, 1935–1947 CrossRef CAS.
- Y. S. Su, J. Y. Ying and W. H. Green, J. Catal., 2003, 218, 321–333 CrossRef CAS.
- A. Cruellas, J. J. Bakker, M. V. Annaland, J. A. Medrano and F. Gallucci, Energy Convers. Manage., 2019, 198, 111789 CrossRef CAS.
- N. S. Hayek, G. J. Khlief, F. Horani and O. M. Gazit, J. Catal., 2019, 376, 25–31 CrossRef CAS.
- S. Arndt, G. Laugel, S. Levchenko, R. Horn, M. Baerns, M. Scheffler, R. Schlögl and R. Schomäcker, Catal. Rev., 2011, 53, 424–514 CrossRef CAS.
- J. M. DeBoy and R. F. Hicks, Ind. Eng. Chem. Res., 1988, 27, 1577–1582 CrossRef CAS.
- S. Lim, J.-W. Choi, D. Jin Suh, U. Lee, K. H. Song and J.-M. Ha, Catal. Today, 2020, 352, 127–133 CrossRef.
- G. Lee, I. Kim, I. Yang, J.-M. Ha, H. B. Na and J. C. Jung, Appl. Surf. Sci., 2018, 429, 55–61 CrossRef CAS.
- D. Kwon, I. Yang, Y. Sim, J.-M. Ha and J. C. Jung, Catal. Commun., 2019, 128, 105702 CrossRef CAS.
- Y. Sim, J. Yoo, J.-M. Ha and J. C. Jung, J. Energy Chem., 2019, 35, 1–8 CrossRef.
- S.-B. Li, Chin. J. Chem., 2001, 19, 16–21 CrossRef CAS.
- U. Simon, O. Gorke, A. Berthold, S. Arndt, R. Schomacker and H. Schubert, Chem. Eng. J., 2011, 168, 1352–1359 CrossRef CAS.
- S. Pak and J. H. Lunsford, Appl. Catal., A, 1998, 168, 131–137 CrossRef CAS.
- H. R. Godini, A. Gili, O. Gorke, U. Simon, K. Hou and G. Wozny, Energy Fuels, 2014, 28, 877–890 CrossRef CAS.
- V. Fleischer, R. Steuer, S. Parishan and R. Schomacker, J. Catal., 2016, 341, 91–103 CrossRef CAS.
- S. Li, J. Nat. Gas Chem., 2003, 12, 1–9 Search PubMed.
- S. Arndt, T. Otremba, U. Simon, M. Yildiz, H. Schubert and R. Schomäcker, Appl. Catal., A, 2012, 425–426, 53–61 CrossRef CAS.
- A. Palermo, J. P. Holgado Vazquez, A. F. Lee, M. S. Tikhov and R. M. Lambert, J. Catal., 1998, 177, 259–266 CrossRef CAS.
- S.-F. Ji, T.-C. Xiao, S.-B. Li, C.-Z. Xu, R.-L. Hou, K. S. Coleman and M. L. H. Green, Appl. Catal., A, 2002, 225, 271–284 CrossRef CAS.
- J. G. Wu and S. B. Li, J. Phys. Chem., 1995, 99, 4566–4568 CrossRef CAS.
- Y. Kou, B. Zhang, J.-z. Niu, S.-b. Li, H.-l. Wang, T. Tanaka and S. Yoshida, J. Catal., 1998, 173, 399–408 CrossRef CAS.
- D. J. Wang, M. P. Rosynek and J. H. Lunsford, J. Catal., 1995, 155, 390–402 CrossRef CAS.
- S. Ji, T. Xiao, S. Li, L. Chou, B. Zhang, C. Xu, R. Hou, A. P. E. York and M. L. H. Green, J. Catal., 2003, 220, 47–56 CrossRef CAS.
- S. Gu, H. S. Oh, J. W. Choi, D. J. Suh, J. Jae, J. Choi and J. M. Ha, Appl. Catal., A, 2018, 562, 114–119 CrossRef CAS.
- J. S. Chang, V. P. Vislovskiy, M. S. Park, D. Y. Hong, J. S. Yoo and S. E. Park, Green Chem., 2003, 5, 587–590 RSC.
- X. H. Li, K. Tomishige and K. Fujimoto, Catal. Lett., 1996, 36, 21–24 CrossRef CAS.
- T. Nishiyama and K.-I. Aika, J. Catal., 1990, 122, 346–351 CrossRef CAS.
- C. L. Chen, Y. D. Xu, G. J. Li and X. X. Guo, Catal. Lett., 1996, 42, 149–153 CrossRef CAS.
- S. Alzahrani, Q. Song and L. L. Lobban, Ind. Eng. Chem. Res., 1994, 33, 251–258 CrossRef CAS.
- K.-i. Aika and T. Nishiyama, J. Chem. Soc., Chem. Commun., 1988, 70–71, 10.1039/C39880000070.
- S. J. Korf, J. A. Roos, N. A. de Bruijn, J. G. van Ommen and J. R. H. Ross, J. Chem. Soc., Chem. Commun., 1987, 1433–1434, 10.1039/C39870001433.
- J. Shi, L. Yao and C. W. Hu, J. Energy Chem., 2015, 24, 394–400 CrossRef.
- J. Shi, L. Yao and C. Hu, J. Energy Chem., 2015, 24, 394–400 CrossRef.
- J. Y. Lee, W. Jeon, J.-W. Choi, Y.-W. Suh, J.-M. Ha, D. J. Suh and Y.-K. Park, Fuel, 2013, 106, 851–857 CrossRef CAS.
- R. M. Freire, F. F. de Sousa, A. L. Pinheiroa, E. Longhinotti, J. Mendes, A. C. Oliveira, P. D. C. Freire, A. P. Ayala and A. C. Oliveira, Appl. Catal., A, 2009, 359, 165–179 CrossRef CAS.
- J. S. Yoo, P. S. Lin and S. D. Elfline, Appl. Catal., A, 1993, 106, 259–273 CrossRef CAS.
- J. Wang, L. Chou, B. Zhang, H. Song, J. Zhao, J. Yang and S. Li, J. Mol. Catal. A: Chem., 2006, 245, 272–277 CrossRef CAS.
- V. O. Igenegbai, R. J. Meyer and S. Linic, Appl. Catal., B, 2018, 230, 29–35 CrossRef CAS.
- T. P. Tiemersma, M. J. Tuinier, F. Gallucci, J. A. M. Kuipers and M. v. S. Annaland, Appl. Catal., A, 2012, 433–434, 96–108 CrossRef CAS.
- M. R. Lee, M. J. Park, W. Jeon, J. W. Choi, Y. W. Suh and D. J. Suh, Fuel Process. Technol., 2012, 96, 175–182 CrossRef CAS.
- W. Jeon, J. Y. Lee, M. Lee, J.-W. Choi, J.-M. Ha, D. J. Suh and I. W. Kim, Appl. Catal., A, 2013, 464–465, 68–77 CrossRef CAS.
- R. T. Yunarti, S. Gu, J.-W. Choi, J. Jae, D. J. Suh and J.-M. Ha, ACS Sustainable Chem. Eng., 2017, 5, 3667–3674 CrossRef CAS.
- S. Gu, H.-S. Oh, J.-W. Choi, D. J. Suh, J. Jae, J. Choi and J.-M. Ha, Appl. Catal., A, 2018, 562, 114–119 CrossRef CAS.
- C. Karakaya, H. Y. Zhu, C. Loebick, J. G. Weissman and R. J. Kee, Catal. Today, 2018, 312, 10–22 CrossRef CAS.
- T. Yabe and Y. Sekine, Fuel Process. Technol., 2018, 181, 187–198 CrossRef CAS.
- Y. Liu, J. Xue, X. Liu, R. Hou and S. Li, in Stud. Surf. Sci. Catal., ed. D. S. F. F. A. V. A. Parmaliana and F. Arena, Elsevier, 1998, vol. 119, pp. 593–597 Search PubMed.
- Y. Liu, R. L. Hou, X. X. Liu, J. Z. Xue and S. B. Li, in Natural Gas Conversion V, ed. A. Parmaliana, D. Sanfilippo, F. Frusteri, A. Vaccari and F. Arena, Elsevier Science Publ B V, Amsterdam, 1998, vol. 119, pp. 307–311 Search PubMed.
- S. Kuś, M. Otremba, A. Tórz and M. Taniewski, Appl. Catal., A, 2002, 230, 263–270 CrossRef.
- K. P. Peil, J. G. Goodwin Jr and G. Marcelin, J. Catal., 1991, 131, 143–155 CrossRef CAS.
- S. Sadjadi, S. Jaso, H. R. Godini, S. Arndt, M. Wollgarten, R. Blume, O. Gorke, R. Schomacker, G. Wozny and U. Simon, Catal. Sci. Technol., 2015, 5, 942–952 RSC.
- T. W. Elkins and H. E. Hagelin-Weaver, Appl. Catal., A, 2015, 497, 96–106 CrossRef CAS.
- Z. C. Jiang, C. J. Yu, X. P. Fang, S. B. Li and H. L. Wang, J. Phys. Chem., 1993, 97, 12870–12875 CrossRef CAS.
Footnotes |
| † Electronic supplementary information (ESI) available. See DOI: 10.1039/d0ra06065h |
| ‡ These authors equally contributed to this work. |
| This journal is © The Royal Society of Chemistry 2020 |


