 Open Access Article
Preparation of biochar by mango peel and its adsorption characteristics of Cd(II) in solution
Liming Zhanga,
Yanfang Ren*ab,
Yuhao Xuea,
Zhiwen Cuia,
Qihang Weia,
Chuan Hana and
Junyu He *ab
*ab
aSchool of Environmental and Safety Engineering, Changzhou University, Changzhou, 213164, PR China. E-mail: yanfangren@126.com; junyuhe0303@126.com; Fax: +86 519 86330086; Tel: +86 519 86330086
bJiangsu Petrochemical Safety and Environmental Engineering Research Center, Changzhou, 213164, PR China
First published on 30th September 2020
Abstract
Biochars were prepared by pyrolyzing mango peel waste at 300, 400, 500, 600 and 700 °C. Various characterizations were carried out to explore the effect of pyrolysis temperature on the biochars. The data indicated that the physical and chemical properties of biochar such as pH, element ratio, specific surface area and functional groups changed with the increase of pyrolysis temperature. The yield and contents of hydrogen, nitrogen and oxygen decreased, while contents of the ash and carbon, pH and specific surface area of the biochars increased. In addition, the molar ratios of H/C, O/C and (O + N)/C decreased. In this study, batch adsorption experiments for Cd(II) adsorption were performed with initial Cd(II) concentrations of 10–300 mg L−1, contact times of 0–2880 min, various pH (2–8) and biochar dose (1–20 g L−1). Langmuir isotherm and pseudo-second-order kinetics models were better fits than other models, suggesting the dominant adsorption of mango peel biochars is via monolayer adsorption. Biochar derived at 500 °C was found to have the highest adsorption capacity of 13.28 mg g−1 among all biochars and the adsorption efficiency was still 67.7% of the initial adsorption capacity after desorption for 4 times. Based on adsorption kinetics and isotherm analysis in combination with EDS, FTIR and XRD analysis, it was concluded that cation exchange, complexation with surface functional groups and precipitation with minerals were the dominant mechanisms responsible for Cd adsorption by mango peel biochar. The study suggested that mango peel can be recycled to biochars and can be used as a low-cost adsorbent for Cd(II) removal from wastewater.
Introduction
With the rapid advance of industrialization and urbanization, heavy metal pollution has become one of the most serious environmental problems.1,2 Cadmium (Cd) is one of the most toxic heavy metals, which is released into the aquatic ecosystem through different anthropogenic activities including manufacturing, mining, battery, metal plating, plastic and paper industries.3,4 Due to its high immobility, long persistence, easy accumulation and high toxicity, Cd pollution poses serious threats to aquatic ecological environment and human health. Cd can damage human organs like the kidneys and liver, and cause renal failure, liver damage, and osteal disorders. It also has a carcinogenic effect.5–7 Therefore, the ecofriendly and sustainable removal of Cd from water is of great importance. Many techniques have been developed to remove Cd from wastewater such as chemical precipitation, ion exchange, membrane filtration, adsorption, and coagulation–flocculation. However, these techniques have their inherent limitations, such as high cost, non-recyclability limit and sludge disposal.8,9 Adsorption has been proved to be an excellent method to remove Cd(II) from wastewater due to its significant advantages such as the low cost, easy operation, high efficiency, and environmentally friendly nature.10Adsorbent is the core of adsorption technology. Common adsorbents including zeolite, diatomite and activated carbon have been widely used to adsorb heavy metal in wastewater. Piri et al. reported that diatomite could adsorb Cd, Cu and Pb successfully.11 Pu et al. found the adsorption capacity of NaP zeolite for Cu(II) in solution was 62.3 mg g−1.12 Adsorbents, especially prepared from renewable sources, brought about the widespread attention in wastewater treatment recent years. Iqbal et al. reported mango peel waste could be used to adsorb Cd(II) and Pb(II) in solutions.13 He et al. found dry biofilms from biotrickling filters could remove Cd(II) in synthetic wastewater.14 The adsorption capacity of dried biomass for Pb(II), and the maximum Pb(II) biosorption capacity of a dried biomass prepared from biotrickling filters was 160.0 mg g−1 fitted by Langmuir model.15 Huang et al. reported nitrilotriacetic acid anhydride modified ligno-cellulosic material could be used to remove Cd(II) and Pb(II) in solutions successfully.16 Biochar is a carbon-rich material obtained by pyrolysis of biomass under anaerobic or anoxic conditions.17 Biochar can be prepared from a variety of industrial and agricultural organic wastes, such as sewage sludge, animal manure, crop straw, and other plant or animal waste.18–21 Due to its low cost, wide range of raw material, superior surface properties and rich functional groups, biochar can be used as a potential sorbent to remove many kinds of heavy metal pollutants like Cd, As, Pb and organic pollutants in water.22–25 Our previous study indicated that biochar produced from wheat straw had a good adsorption capacity for Cd(II).26 The adsorption capacity and mechanisms of heavy metal by biochar could be influenced by the physical and chemical properties of biochar determined by original feedstock and pyrolysis temperature.27 Chen et al. investigated that the pyrolysis temperature (500 °C to 900 °C) had a great influence on properties and heavy metal adsorption potential of municipal sludge biochar.28 Kim, et al. demonstrated that the Cd removal capacity of biochar produced from a giant Miscanthus increased with the increasing of pyrolytic temperatures.29 However, the exact removal mechanism of Cd has not been fully understood until now, and the relationship between Cd removal and biochar properties under different preparation conditions is still unclear. Therefore, the mechanisms of Cd removal by biochar pyrolyzed at different pyrolysis temperatures need to be further investigated.
Mango (Mangifera indica L.) is an important tropical and subtropical fruits for its delicious flavour, nutritional and medicinal value.30 According to FAO, the world's mango production is about 50.6 million tons every year, which ranks the 2nd among the tropical and subtropical fruits. The pulp of mango account for 33–85% of the fresh fruit, which means a large amount of mango waste will be produced in industrial processing or consumption of the fruit. Mango peels contribute to 7–24% of the total mango.31 With the increasing yield of mango, the waste is also increasing and thus becoming a source of pollution. Mango peel contains high content of pectin, cellulose, hemicellulose, polyphenols, carotenoids etc. Therefore, using mango peel waste as raw material to prepare biochar is not only an environmentally friendly method to solve waste problem, but also a potential of use as adsorbent for the removal of toxic metals in wastewater. However, there was no available literature on performance of mango peel biochars for specifically Cd(II) adsorption until now. The aim of present work was thus to investigate the physicochemical properties and Cd removal potential of biochar prepared at different pyrolysis temperatures ranged from 300 to 700 °C in a limited-oxygen environment, examine adsorption kinetics and isotherms of Cd(II) and explore the possible adsorption mechanism of biochar. This study could provide a reference for the resource utilization of mango peel and heavy metal removal from wastewater.
Materials and methods
Experiment reagents
The reagents used in experiments were all analytical grade. CdCl2·2.5H2O, NaOH, NaNO3, HCl, and CaNO3 were purchased from Sinopharm Chemical Regent Co., Ltd, Shanghai, China.Biochar preparation
Mango peels wastes were collected from fruit market in Changzhou, China. Collected mango peels were washed with distilled water several times to remove the dust and other soluble impurities. Washed peels were oven dried at 80 °C till constant weight. Then, peels were grinded into powder and passed through a 40 mesh sieve for subsequent use.The biochar was prepared by a bench top quartz tube electric furnace (temperature range 1200 °C). Mango peel sample (MK) was put into a ceramic sample boat and kept into the quartz tube. Then sample was pyrolyzed at 300, 400, 500, 600 and 700 °C for 2 h under nitrogen atmosphere with a heating rate of 10 °C min−1, respectively. The obtained mango peel biochars (MP) were grinded into powder and passed through a 100-mesh sieve, named as MP300, MP400, MP500, MP600 and MP700, respectively, in accordance with the pyrolysis temperature.
Physicochemical characterization of the biochar
Characterization of the biochar
Ash contents of MP were measured by heating it in a muffle furnace at 800 °C for 4 h. The pH values of MP were measured in deionized water at the ratio of 1![[thin space (1/6-em)]](https://www.rsc.org/images/entities/char_2009.gif) :
:![[thin space (1/6-em)]](https://www.rsc.org/images/entities/char_2009.gif) 20 (w/v) after shaken for 10 h at 150 rpm. Contents of C, H, O and N in MP and MK were measured by elemental analyzer (Vario Microcube, Elementar, Germany). Volatile matter content of MP and MK were measured by Thermal Gravimetric analyzer (TGA) (Labsys Evo, Seteram, France) and the weight loss of MK and MP from 100 °C to 900 °C at 10 °C min−1 heating rate under a nitrogen atmosphere was considered as the volatile matter content. The surface areas and pore size distribution were determined by using the Brunauer–Emmett–Teller (BET) method with a surface area pore analyzer (ASAP2020, Micromeritics, USA). The morphology and structure of MP was observed by scanning electron microscope (SEM) (Supra55, Carl Zeiss AG, Germany). Surface functional groups of MP were measured by Fourier Transform Infrared (FT-IR) spectrometer (IS50, Thermo Fisher Scientific, USA) in the range of 400–4000 cm−1. X-ray diffraction (D/MAX2500, Rigaku, Japan) was used to analyse the crystalline structure of biochars.
20 (w/v) after shaken for 10 h at 150 rpm. Contents of C, H, O and N in MP and MK were measured by elemental analyzer (Vario Microcube, Elementar, Germany). Volatile matter content of MP and MK were measured by Thermal Gravimetric analyzer (TGA) (Labsys Evo, Seteram, France) and the weight loss of MK and MP from 100 °C to 900 °C at 10 °C min−1 heating rate under a nitrogen atmosphere was considered as the volatile matter content. The surface areas and pore size distribution were determined by using the Brunauer–Emmett–Teller (BET) method with a surface area pore analyzer (ASAP2020, Micromeritics, USA). The morphology and structure of MP was observed by scanning electron microscope (SEM) (Supra55, Carl Zeiss AG, Germany). Surface functional groups of MP were measured by Fourier Transform Infrared (FT-IR) spectrometer (IS50, Thermo Fisher Scientific, USA) in the range of 400–4000 cm−1. X-ray diffraction (D/MAX2500, Rigaku, Japan) was used to analyse the crystalline structure of biochars.
Batch adsorption experiments
| Qe = (C0 − Ce) × V/M |
Adsorption kinetics and isotherms
The adsorption kinetics of the biochars for Cd(II) were determined by adding 0.05 g of the biochar to 50 mL polyethylene centrifuge tubes containing 25 mL of the Cd solution (100 mg L−1 Cd(II)). The centrifuge tubes were kept with constant shaking (150 rpm) at room temperature (25 °C) in a constant temperature vibrator. Samples were collected and filtered through 0.45 μm membrane at different time intervals (0, 5, 10, 15, 30, 60, 120, 240, 480, 720, 1440 and 2880 min), then determined adsorption capacity for Cd(II).The dynamic curve is fitted by first-order kinetic equation and second-order dynamic equation.
Pseudo-first-order kinetic model:
ln(Qm − Qe) = ln![[thin space (1/6-em)]](https://www.rsc.org/images/entities/char_2009.gif) Qm − k1t Qm − k1t |
where Qe (mg g−1) is the adsorption capacity at time t (min) and Qm (mg g−1) is the theoretical adsorption capacity by fitting at equilibrium, k1 (min−1) is the rate constant of pseudo-first-order kinetics model and k2 (g mg−1 min−1) is the rate constant of pseudo-second-order kinetics model.
The adsorption isotherms of Cd(II) on the biochars were investigated by adding 0.05 g of the biochars to 50 mL polyethylene centrifuge tubes containing 25 mL of the Cd solution, the Cd concentration ranged from 10 to 300 mg L−1. The centrifuge tubes were kept with constant shaking (150 rpm) at room temperature (25 °C) in a constant temperature vibrator for 24 h. After adsorption, samples were collected and filtered through 0.45 μm membrane and determine the Cd adsorption capacity using the same method.
The isotherm adsorption curves were fitted by Freundlich and Langmuir model.
Langmuir adsorption isotherm model:
| Qe = KFCe1/n |
Effects of biochar dose and initial solution pH on Cd adsorption
In order to explore the effect of biochar dose on adsorption, different biochar dose (1, 2, 10 and 20 g L−1) were added to 100 mg L−1 Cd solution and shaken at 25 °C for 24 h. The effect of initial solution pH on Cd(II) adsorption by biochar was carried out by adjusting the Cd(II) solution pH from 2 to 8 with adding 0.1 M HCl or 100 mg L−1 NaOH, the other step and measurement of Cd concentration were the same as above.Desorption and recycling adsorption experiments
To explore the stability of Cd(II) on biochar after adsorption, the 100 mg biochar (MP500), which had adsorbed Cd(II) completely in different initial Cd(II) concentrations (10–300 mg L−1), was mixed with 20 mL 0.01 mol L−1 NaNO3 under constant shaking (150 rpm) in a flask at 25 °C for 24 h after washing and drying, and then analysed the concentration of Cd(II) in solution.For recycling adsorption experiment, 0.1 mol L−1 HCl was used as the desorption reagent. 200 mg saturated MP500 (100 mg L−1 Cd(II)) was mixed with 20 mL 0.1 mol L−1 HCl with constant shaking (150 rpm) at 25 °C in constant temperature vibrator incubator for 2 h. The adsorbent washed with distilled water to constant pH and dried for constant weight, and were used in next adsorption experiment (100 mg L−1 Cd(II)). The desorption–adsorption experiment was repeated four times. The concentrations of remaining Cd(II) were measured using flame atomic absorption spectrometry (AA-300, PerkinElmer Ltd, USA).
Adsorption mechanism
To further investigate the Cd adsorption mechanisms, MP500 was characterized after adsorption using EDS, XRD and FTIR spectroscopy. The EDS spectra of MP500 before and after adsorption were measured by energy dispersive X-ray spectroscopy (E1462-C2B, EDAX, USA). The crystallographic structures of both before and after adsorption were analysed using an X-ray diffractometer. The surface functional groups on MP500 before and after Cd adsorption were analysed by a FTIR spectrometer (IS50, Thermo Fisher Scientific, USA).Statistical analyse
Each treatment was conducted in triplicate. Data were statistically analysed using SPSS 16.0 and plotted using Origin 8.0, and the data was expressed as the mean ± standard deviation.Results and discussion
Characterization of biochar
| Biochars | Yield (%) | Ash (%) | pH | Elemental analysis | Atomic ratio | |||||
|---|---|---|---|---|---|---|---|---|---|---|
| C (%) | H (%) | N (%) | O (%) | H/C | O/C | (O + N)/C | ||||
| MK | — | — | — | 51.33 | 5.03 | 0.79 | 39.66 | 1.18 | 0.58 | 0.59 |
| MP300 | 43.2 | 5.75 | 6.87 | 73.64 | 4.32 | 1.34 | 14.95 | 0.70 | 0.15 | 0.17 |
| MP400 | 36.3 | 6.68 | 7.32 | 76.48 | 3.48 | 1.09 | 12.27 | 0.55 | 0.12 | 0.13 |
| MP500 | 34.7 | 8.49 | 7.86 | 77.03 | 2.55 | 1.03 | 10.90 | 0.40 | 0.11 | 0.12 |
| MP600 | 30.0 | 8.81 | 8.58 | 77.89 | 2.03 | 0.89 | 10.38 | 0.31 | 0.10 | 0.11 |
| MP700 | 27.0 | 9.04 | 9.06 | 78.61 | 1.62 | 0.80 | 9.93 | 0.25 | 0.09 | 0.10 |
| Biochars | BET Surface area (m2 g−1) | Total pore volume (10−3 cm3 g−1) | Average pore diameter (nm) |
|---|---|---|---|
| MP300 | 2.09 | 1.82 | 3.49 |
| MP400 | 3.74 | 1.91 | 2.04 |
| MP500 | 5.58 | 7.48 | 5.36 |
| MP600 | 5.67 | 4.96 | 3.50 |
| MP700 | 5.74 | 3.66 | 2.56 |
The surface and pore structure of the biochars greatly influences the physical adsorption process, and the diffusion rates for Cd(II) transport from the biochar surface to the internal pores are inconsistent because of the presence of different pore structures.38 Table 2 showed specific surface area, total pore volume and average pore diameter of the MP. The BET surface area increased from 2.09 m2 g−1 to 5.74 m2 g−1 as the pyrolysis temperature increased from 300 °C to 700 °C. A higher surface area is beneficial for the adsorption of heavy metals by biochar. The surface structure of biochar was not well developed at lower pyrolytic temperature. The increase in surface area is mainly due to the destruction of organic functional groups and the formation of micropores in biochars at high temperature pyrolysis.39 However, there was no significant difference in the BET surface area when the pyrolysis temperature ranged from 500 °C to 700 °C (Table 2). Total pore volume and the average pore diameter of biochars increased firstly and then decreased with the increase of the pyrolysis temperature. Among the biochars derived at various pyrolysis temperatures, MP500 had the biggest total pore volume and the average pore diameter (Table 2), which indicate that micropore structures formed more easily in the mango peel biochar obtained at 500 °C. However, Liu et al. reported that the pore volume of wheat straw biochar increased, while the average diameter decreased with increasing pyrolysis temperature.40 Xian et al. also found the surface area and pore volume in mushroom substrate biochars increased with the pyrolysis temperature increased, and the average number of pores decreased.33 Such a different result may be related to the type and property of feedstock.41
Thermogravimetric analysis
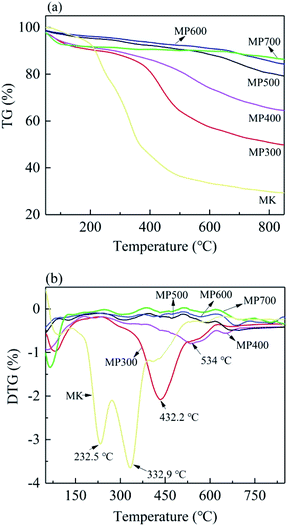
The effect of temperature on MK and MP were analyzed by thermogravimetric analysis. As shown in Fig. 1, the weight loss of MK and MP increased gradually with the increasing pyrolysis temperature (Fig. 1a), which was consistent with the yield (Table 1). The MK contains high content of pectin, cellulose, hemicellulose etc. The weight loss up to 125 °C was due to moisture loss. The weight loss between 125 °C and 190 °C might be due to the removal of bound water and small molecule residues.42 From the DTG curve, the peaks at 232.5 and 332.9 °C might be due to the decomposition of hemicelluloses and cellulose, the peaks at 432 °C and 534 °C might be related to the decomposition of lignin.34,43 The decomposition patterns of MK and MP were obviously different, implying significant transformation from feedstock with the increase of pyrolysis temperature. Compared to MK, the peaks on the DTG curve of all MP at 232.5 °C and 332.9 °C disappeared, indicating that the hemicellulose and cellulose were broken down during pyrolysis process from 200 °C to 380 °C (Fig. 1b). For MP300 and MP400, the temperature range of hemicellulose degradation was slightly overlapped with cellulose degradation, resulting in a curve rather than a clear peak. However, there were clear peaks at 432 °C and 534 °C in the DTG curve of MP300 and MP400, respectively, indicating lignin decomposition. MP500, MP600 and MP700 showed high heat resistance and stability steady as compared to MK. The results of present study were in line with the previous reports.44Surface morphology
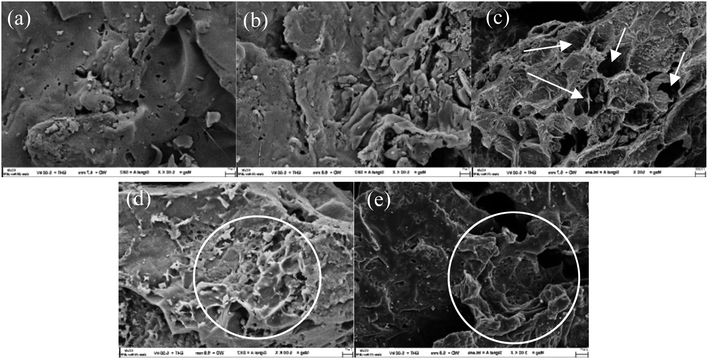
SEM images of biochars were shown in Fig. 2. There were obvious differences in surface morphology among the biochars derived from different pyrolysis temperature. The biochars were smooth and the pores were not obvious at 300 °C. It displayed irregular structure with folding phenomenon at 400 °C. This might be related to insufficient pyrolysis. When the pyrolysis temperature reached to 500 °C, it had a loose and porous structure, which was also confirmed by the larger specific surface area and pore volume for biochars at this pyrolysis temperature. The well-developed porous structure was due to the rapid volatilization of organic components in the biomass and this structure was beneficial to the attachment of metal ions.45 With the further increase of pyrolysis temperature, pore structure gradually appeared to be destroyed and the surface of biochar appeared to be layered stacks, especially at 700 °C. It was consistent with the results from pineapple peel biochar.46Fourier transform infrared (FT-IR) analysis
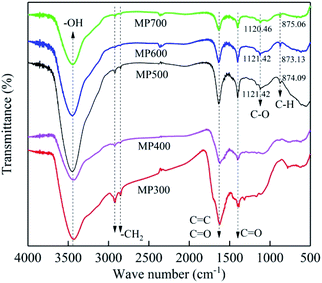
The FTIR spectra of MP300, MP400, MP500, MP600 and MP700 were shown in Fig. 3. The surface of MP contained a large number of functional groups (Fig. 3), which were beneficial to the adsorption by biochar. The broad peak from 3200 cm−1 to 3700 cm−1 was attributed to –OH stretching vibrations, which was found in all biochars, and the peak weakened with increase of pyrolysis temperature. This was mainly due to the alcohols, phenols and bound-water started to detach causing the hydroxyl groups bound by the hydrogen and oxygen to be broken when the pyrolysis temperature increased.47 The peak near 2900 cm−1 corresponds to the –CH2 groups stretch in biopolymers. This peak decreased or latter disappeared at high pyrolysis temperature, which implied cellulose and hemicelluloses (aliphatic compounds) decreased and converted to carbon dioxide, methane and other gases with the increase in temperature.41,48 The peak from 1600 cm−1 to 1650 cm−1 corresponded to the presence of –COOH and C![[double bond, length as m-dash]](https://www.rsc.org/images/entities/char_e001.gif) O stretching.49,50 At high pyrolysis temperature, C
O stretching.49,50 At high pyrolysis temperature, C![[double bond, length as m-dash]](https://www.rsc.org/images/entities/char_e001.gif) O can be broken down and produced by-product gas or liquid, so the peak near 1600 cm−1 decreased.51 The peak at 1400 cm−1 may be associated with the carboxylate C
O can be broken down and produced by-product gas or liquid, so the peak near 1600 cm−1 decreased.51 The peak at 1400 cm−1 may be associated with the carboxylate C![[double bond, length as m-dash]](https://www.rsc.org/images/entities/char_e001.gif) O stretching.52 The new peak appears near 1150 is corresponded to the C–O group when the pyrolysis temperature ranged from 500 to 700 °C.53 With the increase in temperature, the functional groups gradually weakened and partly disappeared, which proved that biochar had better adsorption at low temperature. The new peak at 875 cm−1 was corresponded to aromatic C–H branching when the pyrolysis temperature was above 500 °C.54 These FT-IR results were consistent agreed with the changes observed in elemental composition, indicating that proper pyrolysis temperature produces biochar with higher aromatic structure and fewer polar functional groups. These results imply that pyrolytic temperature significantly influence the surface functional groups of the biochars.
O stretching.52 The new peak appears near 1150 is corresponded to the C–O group when the pyrolysis temperature ranged from 500 to 700 °C.53 With the increase in temperature, the functional groups gradually weakened and partly disappeared, which proved that biochar had better adsorption at low temperature. The new peak at 875 cm−1 was corresponded to aromatic C–H branching when the pyrolysis temperature was above 500 °C.54 These FT-IR results were consistent agreed with the changes observed in elemental composition, indicating that proper pyrolysis temperature produces biochar with higher aromatic structure and fewer polar functional groups. These results imply that pyrolytic temperature significantly influence the surface functional groups of the biochars.
X-ray diffractometer (XRD) spectral analysis
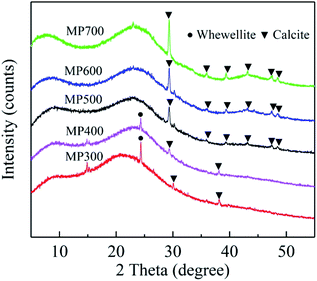
XRD patterns of biochar derived at different pyrolysis temperatures were shown in Fig. 4. The broad peak near 23° is a characteristic peak of the disordered graphite layer structure.55 As the pyrolysis temperature increased, the peak at 25° disappeared, while the peak at 30°, 36°, 39°, 43°, 47°, 48° became more pronounced, which indicate that CaCO3 are well crystallized.18,56Effect of biochar dose
The effect of the dose of MP on the Cd(II) adsorption capacity in aqueous solution was shown in Fig. 5a. Biochar dose had an obvious influence on the adsorption of Cd(II). Cd(II) adsorption capacity decreased with increasing biochar doses. With biochar dose increased from 1 g L−1 to 20 g L−1, the adsorption capacity (mg g−1) decreased from 7.18 ± 0.21 mg g−1 to 2.08 ± 0.12 mg g−1 for MP300, from 9.65 ± 0.23 mg g−1 to 2.23 ± 0.08 mg g−1 for MP400, from 11.62 ± 0.26 mg g−1 to 2.43 ± 0.09 mg g−1 for MP500, from 9.73 ± 0.43 mg g−1 to 2.33 ± 0.04 mg g−1 for MP600, from 9.67 ± 0.26 mg g−1 to 1.98 ± 0.02 mg g−1 for MP700. The results were similar to those reported in other studies.33,57 This may be due to the remaining unsaturated adsorption sites during the adsorption process or excess active sites and lower metal ion concentration at higher biochar dose.33 Significant differences in the Cd(II) adsorption capacity could be observed between the biochars prepared at different temperatures and the adsorption capacity of MP500 was higher than other biochars. At a constant Cd concentration, while at lower biochar dose, all adsorption sites are occupied by Cd(II) completely leading to high adsorption capacity. While at higher biochar dose, excessive adsorption sites lead to Cd(II) can not occupy all sites resulting in lower adsorption capacity.42,53 Combined with the amount and adsorption capacity of biochar, all the subsequent studies were carried out with 2 g L−1 of biochar dose.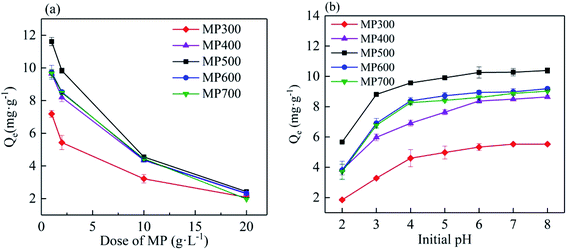 | ||
| Fig. 5 The effect of biochar dose (a) biochar dose 1–20 g L−1, pH (b) (2–8) on the adsorption of Cd(II) by different MP. | ||
Effect of initial solution pH
The initial pH of the solution in adsorption experiments strongly affects the adsorption process of heavy metals ion.58 As shown in Fig. 5b, the adsorption capacity of Cd(II) increased with the increased of initial pH ranged from 2 to 8. The adsorption capacity increased rapidly when the initial solution pH increased from 2 to 4 for all biochars, and then tended to be stable when the initial solution pH increased from 4 to 6. When the pH ranged from 6–8, the adsorption capacity reached equilibrium and had no obvious difference. With the initial pH of the solution from 2 to 8, the adsorption capacity increased from 1.85 mg g−1 to 5.53 mg g−1 for MP300, from 3.83 mg g−1 to 8.64 mg g−1 for MP400, from 5.67 mg g−1 to 10.65 mg g−1 for MP500, from 3.81 mg g−1 to 9.18 mg g−1 for MP600, from 3.71 mg g−1 to 9.08 mg g−1 for MP700. The results are similar to those in previous studies.42,59 The low adsorption capacity at low solution pH was mainly attributed to some functional groups on the surface of biochar which showed positive charges and repelled the polar attraction of Cd(II) in aqueous solution, and a large amount of H+ in the solution which may compete with Cd(II) for adsorption.55 At a constant pH, the adsorption capacity of MP500 was the most among the biochars. In this study, the optimum pH is obtained from 6–8.Adsorption isotherm
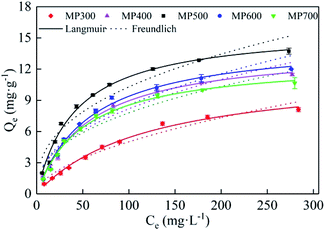
The adsorption isotherm of Cd(II) by MP were shown in Fig. 6. As the initial Cd(II) concentration increased, the adsorption capacity of MP at different temperatures gradually increased and the trend slowed down. As initial concentration increased, the Cd(II) equilibrium adsorption capacity of MP500 was larger than that of other MP, which was related to the microstructure (Table 2) and surface functional groups (Fig. 3). The maximum adsorption capacities (Qmax) were 8.10, 11.48, 13.73, 12.00 and 10.65 mg g−1 for MP300, MP4500, MP500, MP600 and MP700, respectively, when the highest initial Cd2+ concentration was 300 mg L−1 (Fig. 6). Results suggested that the Langmuir model fitted the Cd(II) adsorption data better than the Freundlich model, this indicates that the adsorption process is a monolayer adsorption.60Among all biochars, MP500 exhibited the highest theoretical adsorption capacity. According to the Langmuir model, RL (RL = 1/(1 + KL × C0)) is a dimensionless constant separation factor which can be used to predict whether an adsorption system is favorable or unfavorable.61 The value of RL indicates the type of isotherm. When 0 < RL < 1, it is conducive to adsorption; when RL = 1, the adsorption process is a linear adsorption; when RL > 1, it is not conducive to adsorption; when RL = 0, the adsorption process is irreversible. In this study, the RL values for all MP fell in the range of 0–1, indicating that adsorption of Cd(II) by mango peel biochar was favorable process (Table 3).33,57
| Biochars | Langmuir model | Freundlich model | ||||
|---|---|---|---|---|---|---|
| Qm (mg g−1) | KL (min−1) | R2 | KF (mg(1−n) Ln g−1) | 1/n | R2 | |
| MP300 | 11.90 | 0.0084 | 0.9933 | 0.4037 | 0.5470 | 0.9644 |
| MP400 | 14.09 | 0.0174 | 0.9932 | 1.1408 | 0.4278 | 0.9357 |
| MP500 | 16.01 | 0.0237 | 0.9904 | 1.7436 | 0.3857 | 0.9217 |
| MP600 | 14.86 | 0.0171 | 0.9899 | 1.1556 | 0.4349 | 0.9223 |
| MP700 | 12.87 | 0.0197 | 0.9912 | 1.1921 | 0.4078 | 0.9213 |
Adsorption kinetics
The adsorption kinetics of MP300, MP400, MP500, MP600 and MP700 were shown in the Fig. 7. The adsorption of Cd(II) on MP over time included two processes: a rapid adsorption process in the first 240 min and a slow adsorption process until the equilibrium of adsorption. The adsorption equilibrium for MP300, MP400, MP500, MP600 and MP700 occurred at 240, 480, 120, 480, and 240 min, respectively. At the beginning, the adsorption mainly occurred on the outer surface of biochar, its adsorption mechanism was assumed to be related to physical and chemical adsorption. At the next stage, Cd(II) entered into the pores of biochar and combined with active sites, the adsorption capacity reached saturation gradually. The Cd(II) equilibrium adsorption capacity for MP300, MP400, MP500, MP600 and MP700 was 5.08, 8.22, 9.93, 9.38 and 9.03 mg g−1, respectively, and adsorption capacity for MP500 was larger than that of other MP, which were consistent with the description of FTIR and elemental analysis. Experimental data were fitted by pseudo-first-order and pseudo-second-order kinetics models to analyze adsorption kinetics mechanism. The calculated parameters for two kinetic models were shown in Table 4. The value of R2 for pseudo-second-order model was larger than pseudo-first-order model, which indicated that the adsorption fitted by pseudo-second-order was better than pseudo-first-order model. Furthermore, the adsorption capacity (Qm) obtained by pseudo-second-order model was more consistent with experimental data (Qe). Hence, as per the assumption of pseudo-second-order model it could be inferred that chemisorption is the rate limiting step.62 Similar results have been reported for mushroom substrate and water hyacinth biochars for Cd(II) adsorption.18,33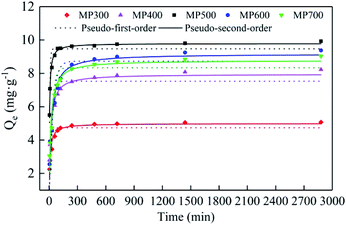 | ||
| Fig. 7 Adsorption kinetics of Cd(II) onto MP: pseudo-first-order model and pseudo-second-order model. | ||
| Biochars | Qea (mg g−1) | Pseudo-first-order | Pseudo-second-order | ||||
|---|---|---|---|---|---|---|---|
| Qm (mg g−1) | k1 (min−1) | R2 | Qm (mg g−1) | k2 (g mg−1 min−1) | R2 | ||
| a The actual adsorption capacity of MP. | |||||||
| MP300 | 5.08 | 4.84 | 0.1224 | 0.9619 | 5.19 | 0.2464 | 0.9979 |
| MP400 | 8.22 | 8.05 | 0.0261 | 0.9015 | 8.38 | 0.1291 | 0.9872 |
| MP500 | 9.93 | 9.74 | 0.1275 | 0.8516 | 9.86 | 0.3387 | 0.9960 |
| MP600 | 9.38 | 8.47 | 0.0298 | 0.8345 | 10.02 | 0.1220 | 0.9970 |
| MP700 | 9.03 | 8.39 | 0.0286 | 0.8725 | 9.26 | 0.2973 | 0.9780 |
Desorption and recycling adsorption
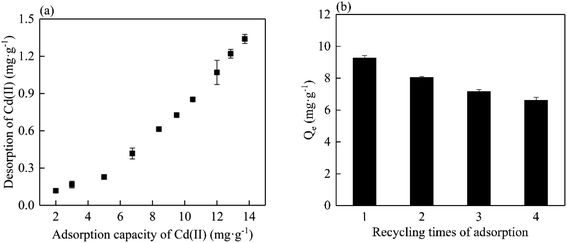
To better understand the binding affinity for Cd(II) for MC500, desorption of Cd(II) was conducted in NaNO3 solution. Fig. 8a revealed that the amount of Cd(II) desorption increased with the initial adsorption capacity of biochar increased, and the maximum desorbed amount of Cd(II) was 1.34 mg g−1 (9.76%). This indicated that MP could bind Cd(II) effectively. The regeneration of the materials is an important parameter to maintain low operation cost during adsorption process. Fig. 8b showed the adsorption capacity of MP500 for Cd(II) after four cycles were 88.2%, 76.6%, 70.0% and 67.7% of initial adsorption capacity (10.5 mg g−1). This result indicated that MP had a potential of regeneration for Cd(II) adsorption. Gradual decrease in re-adsorption might be due to the partial saturation of surface active sites or depletion of surface functional groups.Application of mango peel biochar
Above results indicated that MP could be used to treat wastewater. Table 5 summarized the comparative analysis of adsorption capacities of biochars of the present study with those in previous studies. As can be observed that MP exhibited the moderate capacity in Cd adsorption. Moreover, mango peel wastes as agriculture residues are low-cost and easily achieved. In the future, we will study to improve the adsorption capacity of biochar by modification.| Biochar | Qm (mg g−1) | References |
|---|---|---|
| Giant miscanthus-derived biochar | 13.24 | 29 |
| Rice straw pristine-derived biochar | 12.17 | 63 |
| Household biowaste-derived biochar | 6.22 | 64 |
| Sewage sludge with tea waste-derived biochar | 20 | 65 |
| Wheat straw-derived biochar | 69.8 | 40 |
| Poplar bark-derived biochar | 19.998 | 66 |
| Poplar sawdust-derived biochar | 9.631 | 66 |
| Lucerne-derived biochar | 6.28 | 10 |
| Municipal sewage sludge-derived biochar | 15–25 | 67 |
| Hickory wood-derived biochar | 28.1 | 68 |
| Mango peel-derived biochar | 13.28 | This study |
Mechanism of Cd(II) adsorption
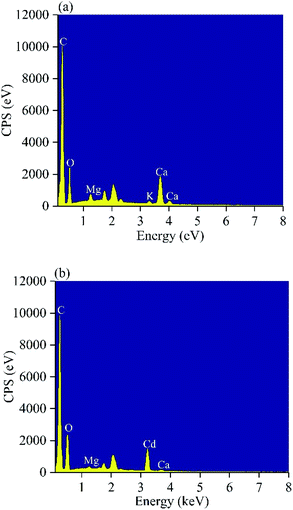
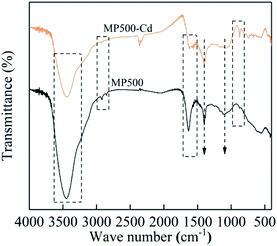
Multiple mechanisms are involved in heavy metal adsorption onto biochar. From the findings of the adsorption kinetics and isotherms of the biochars, the Cd(II) adsorption onto MP was primarily controlled by chemical adsorption. To further reveal the mechanism of MP adsorption, EDS, XRD and FTIR spectra were utilized to analyze the characteristics of MP500 before and after adsorption. Ion exchange is one of the adsorption mechanisms of biochar. Trakal et al. had proved that K+, Na+, Ca2+, and Mg2+ in biochar could be replaced by Cd2+.69 As shown in EDS spectra (Fig. 9), there was the existence of Cd after adsorption, indicating that Cd(II) had been adsorbed on the MP500. Peaks represent K, Ca, and Mg decreased or even disappeared after Cd adsorption, implying that these cations were released from the biochar surface. A similar phenomenon was observed in swine-manure biochar for Cd2+ adsorption.70 The chemical interactions between Cd(II) and the surface of MP500 were analyzed by the FT-IR spectra. As shown in Fig. 10, the adsorption bands of MP500-Cd changed obviously compared with MP500, which indicate that some functional groups participated in the chemical adsorption process. The peak at 3448 cm−1 and 1629 cm−1 weakened obviously, suggesting –OH and –COOH were involved in Cd(II) adsorption process. Similar results have been obtained by many researchers, who reported that the removal of heavy metals was mainly attributed to surface complexation with ionized phenolic –OH or –COOH groups, for the biochars derived from chicken manure and rice straw.71,72 The intensity of the peak (1120 cm−1) decreased indicating that C–O group also react with Cd(II). Peaks at 2919 cm−1 and 2850 cm−1 were also found to decrease after adsorption, which correspond to –CH2. On the other hand, Harvey et al. demonstrated that heavy metals were adsorbed to an oxygen-free biochar surface due to delocalized π electrons from other functional groups (γ-CH, C![[double bond, length as m-dash]](https://www.rsc.org/images/entities/char_e001.gif) C).73 This coordination of Cd2+ with Cπ electrons might occur in MP500, since the intensities of –CH aromatic group changed significantly following adsorption, providing π electrons.58 The observations were supported by H/C and O/C atomic ratios (Table 1).
C).73 This coordination of Cd2+ with Cπ electrons might occur in MP500, since the intensities of –CH aromatic group changed significantly following adsorption, providing π electrons.58 The observations were supported by H/C and O/C atomic ratios (Table 1).
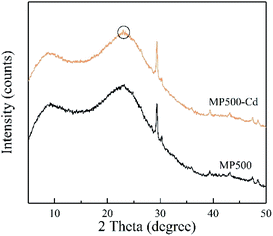
To identify the chemical precipitation for Cd adsorption, MP500 was comparatively analyzed before and after Cd sorption by XRD. As shown in Fig. 11, the small new peaks at 23 degrees were observed in MP500-Cd, which indicated the precipitation of CdCO3 on the surface of MP500.18 This is in accordance with the results obtained by Xu et al. who indicated that the precipitation with CO32− was mainly responsible for the metal removal by dairy-manure biochar.70 Combined with all results, the proposed mechanism involved in Cd(II) adsorption by MP in this study include ion exchange, chemical precipitation and complexation reaction of Cd(II) with oxygen-containing functional groups.
Conclusions
Biochar was derived from mango peel waste biomass and successfully utilized for Cd(II) adsorption. The properties of MP were significantly affected by pyrolytic temperature. Among all biochars obtained at different pyrolysis temperature, MP500 had a maximum adsorption capacity of Cd(II) which was 13.28 mg g−1, indicated that the mango peel biochar can be an effective adsorbing material for removing Cd(II) from wastewater. The adsorption data of biochar fitted well with the pseudo-second-order model and Langmuir adsorption isotherm model. The optimal dose of MP was 2.0 g L−1, pH was 6–8, and adsorption time was 480 min. Mango peel biochar also had a re-adsorption potential. The analysis of EDS, FT-IR and XRD before and after Cd(II) adsorption by MP indicated that cation exchange, complexation reaction of Cd(II) with oxygen-containing functional groups and surface precipitation of Cd carbonates were main mechanism of adsorption. Combined with all of the above results, mango peel waste could be used for biochar production and the produced biochar could be used as an alternative adsorbent for Cd(II) removal form heavy metal wastewater. It could also be helpful for preventing environmental pollution caused by agricultural waste.Conflicts of interest
There are no conflicts to declare.Acknowledgements
This work was supported by the National Natural Science Foundation of China (31460100, 31660477, and 31360413) and Scientific Research Foundation for Talents of Changzhou University (201709 and 201710).Notes and references
- Q. Yang, Z. Li, X. Lu, Q. Duan, L. Huang and J. Bi, Sci. Total Environ., 2018, 642, 690–700 CrossRef CAS.
- P. K. Rai, S. S. Lee, M. Zhang, Y. F. Tsang and K. Kim, Environ. Int., 2019, 125, 365–385 CrossRef CAS.
- J. Wang and C. Chen, Environ. Technol. Rev., 2015, 4, 39–53 CrossRef CAS.
- J. Tang, J. Zhang, L. Ren, Y. Zhou, J. Gao, L. Luo, Y. Yang, Q. Peng, H. Huang and A. Chen, J. Environ. Manage., 2019, 242, 121–130 CrossRef CAS.
- A. Jaiswal, A. Verma and P. Jaiswal, J. Environ. Pathol. Tox., 2018, 37, 183–197 CrossRef.
- D. Kumar, D. S. Malik, S. L. Patel and V. Gupta, Ann. Entomol. Soc. Am., 2019, 1, 66–75 Search PubMed.
- G. Genchi, M. S. Sinicropi, G. Lauria, A. Carocci and A. Catalano, Int. J. Env. Res. Pub. He., 2020, 17, 3782 CrossRef CAS.
- J. Liu, Z. Huang, Z. Chen, J. Sun, Y. Gao and E. Wu, J. Clean. Prod., 2020, 257, 120322 CrossRef CAS.
- Y. Qiu, Q. Zhang, M. Li, Z. Fan, W. Sang, C. Xie and D. Niu, Water Air and Soil Pollution, 2019, 230, 84 CrossRef.
- T. Bandara, J. Xu, I. D. Potter, A. Franks and C. Tang, Chemosphere, 2020, 254, 126745 CrossRef CAS.
- M. Piri, E. Sepehr, A. Samadi, K. Farhadi and M. Alizadeh, Water Environ. Res., 2020 DOI:10.1002/wer.1377.
- X. Pu, L. Yao, L. Yang, W. Jiang and X. Jiang, J. Clean. Prod., 2020, 265, 121822 CrossRef CAS.
- M. Iqbal, A. Saeed and S. I. Zafar, J. Hazard. Mater., 2009, 164, 161–171 CrossRef CAS.
- H. He, Z. H. Xiang, X. J. Chen, H. Chen, H. Huang, M. Wen and C. Yang, Int. J. Environ. Sci. Te., 2018, 15, 1491–1500 CrossRef CAS.
- Y. Cheng, C. Yang, H. He, G. Zeng, K. Zhao and Z. Yan, J. Environ. Eng., 2016, 142, C4015001 CrossRef.
- Y. Huang, C. Yang, Z. Sun, G. Zeng and H. He, RSC Adv., 2015, 5, 11475–11484 RSC.
- L. Gao and J. L. Goldfarb, RSC Adv., 2019, 9, 16018–16027 RSC.
- W. Guo, Y. Ai, B. Men and S. Wang, Int. J. Environ. Sci. Te., 2017, 14, 1889–1896 CrossRef CAS.
- Y. Zhu, B. Yi, Q. Yuan, Y. Wu, M. Wang and S. Yan, RSC Adv., 2018, 8, 19917–19929 RSC.
- P. Wang, Y. Yin, Y. Guo and C. Wang, RSC Adv., 2016, 6, 10615–10624 RSC.
- M. Choudhary, R. Kumar and S. Neogi, J. Hazard. Mater., 2020, 392, 122441 CrossRef CAS.
- F. Zhang, X. Wang, D. Yin, B. Peng, C. Tan, Y. Liu, X. Tan and S. Wu, J. Environ. Manage., 2015, 153, 68–73 CrossRef CAS.
- S. Ali, M. Rizwan, M. B. Shakoor, A. Jilani and R. Anjum, Chemosphere, 2020, 243, 125330 CrossRef CAS.
- Y. Hong, Z. Xu, C. Feng, D. Xu and F. Wu, B. Environ. Contam. Tox., 2019, 103, 848–853 CrossRef CAS.
- J. Shang, X. Kong, L. L. He, W. Li and Q. Liao, Int. J. Environ. Sci. Te., 2016, 13, 2449–2458 CrossRef CAS.
- Z. Cui, Y. Ren, W. Wang, L. Zhang, L. Zhang, X. Wang and J. He, Environ. Sci., 2020, 7, 3315–3325 Search PubMed.
- C. Kalinke, A. S. Mangrich, L. H. Marcolino-Junior and M. F. Bergamini, J. Hazard. Mater., 2016, 318, 526–532 CrossRef CAS.
- T. Chen, Y. Zhang, H. Wang, W. Lu, Z. Zhou, Y. Zhang and L. Ren, Bioresour. Technol., 2014, 164, 47–54 CrossRef CAS.
- W. K. Kim, T. Shim, Y. S. Kim, S. Hyun, C. Ryu, Y. Park and J. Jung, Bioresour. Technol., 2013, 138, 266–270 CrossRef CAS.
- N. Das and A. Bishayee, Crit. Rev. Food Sci., 2020, 1–27 CrossRef CAS.
- M. H. A. Jahurul, I. S. M. Zaidul, K. Ghafoor, F. Y. Al-Juhaimi, K. L. Nyam, N. A. N. Norulaini, F. Sahena and A. K. Mohd Omar, Food Chem., 2015, 183, 173–180 CrossRef CAS.
- W. Ng, B. S. E. Wong, G. H. Baeg, C. H. Wang and Y. S. Ok, J. Hazard. Mater., 2019, 365, 178–185 CrossRef.
- S. Wei, M. Zhu, X. Fan, J. Song, K. Li, W. Jia and H. Song, Chemosphere, 2019, 218, 624–631 CrossRef CAS.
- J. Wei, C. Tu, G. Yuan, Y. Liu, D. Bi, L. Xiao, J. Lu, B. K. G. Theng, H. Wang and L. Zhang, Environ. Pollut., 2019, 251, 56–65 CrossRef CAS.
- J. Tang, S. Zhang, X. Zhang, J. Chen, X. He and Q. Zhang, Sci. Total Environ., 2020, 731, 138938 CrossRef CAS.
- A. T. Tag, G. Duman, S. Ucar and J. Yanik, J. Anal. Appl. Pyrol., 2016, 120, 200–206 CrossRef CAS.
- Y. Xian, J. Wu, G. Yang, R. Liao, X. Zhang, H. Peng, X. Yu, F. Shen, L. Li and L. Wang, RSC Adv., 2018, 8, 28002–28012 RSC.
- Y. Choi and E. Kan, Chemosphere, 2019, 218, 741–748 CrossRef CAS.
- I. D. Manariotis, K. N. Fotopoulou and H. K. Karapanagioti, Ind. Eng. Chem. Res., 2015, 54, 9577–9584 CrossRef CAS.
- L. Liu and S. Fan, Environ. Sci. Pollut. R., 2018, 25, 8688–8700 CrossRef CAS.
- H. I. Yang, K. Lou, A. U. Rajapaksha, Y. S. Ok, A. O. Anyia and S. X. Chang, Environ. Sci. Pollut. R., 2018, 25, 25638–25647 CrossRef CAS.
- H. Li, S. A. A. Mahyoub, W. Liao, S. Xia, H. Zhao, M. Guo and P. Ma, Bioresour. Technol., 2017, 223, 20–26 CrossRef CAS.
- L. Zhao, X. Cao, O. Masek and A. R. Zimmerman, J. Hazard. Mater., 2013, 256, 1–9 Search PubMed.
- Z. Chen, T. Liu, J. Tang, Z. Zheng, H. Wang, Q. Shao, G. Chen, Z. Li, Y. Chen and J. Zhu, Environ. Sci. Pollut. R., 2018, 25, 11854–11866 CrossRef CAS.
- A. R. A. Usman, A. S. Abduljabbar, M. Vithanage, Y. S. Ok, M. Ahmad, M. Ahmad, J. Elfaki, S. S. Abdulazeem and M. I. Alwabel, J. Anal. Appl. Pyrol., 2015, 115, 392–400 CrossRef CAS.
- A. Shakya and T. Agarwal, J. Mol. Liq., 2019, 293, 111497 CrossRef CAS.
- H. N. Tran, S. You and H. Chao, Waste Manage. Res., 2016, 34, 129–138 CrossRef CAS.
- K. B. Cantrell, P. G. Hunt, M. Uchimiya, J. M. Novak and K. S. Ro, Bioresour. Technol., 2012, 107, 419–428 CrossRef CAS.
- J. Song, Q. He, X. Hu, W. Zhang, C. Wang, R. Chen, H. Wang and A. Mosa, Environ. Sci. Pollut. R., 2019, 26, 13221–13234 CrossRef CAS.
- J. Zhang and P. Zheng, RSC Adv., 2015, 5, 17768–17774 RSC.
- H. Wang, C. Fang, Q. Wang, Y. Chu, Y. Song, Y. Chen and X. Xue, RSC Adv., 2018, 8, 16260–16268 RSC.
- N. K. Niazi, I. Bibi, M. Shahid, Y. S. Ok, E. D. Burton, H. Wang, S. M. Shaheen, J. R. Rinklebe and A. Lüttge, Environ. Pollut., 2018, 232, 31–41 CrossRef CAS.
- J. Yan, Y. Xue, L. Long, Y. Zeng and X. Hu, Environ. Sci. Pollut. R., 2018, 25, 34674–34683 CrossRef CAS.
- N. Liu, Y. Zhang, C. Xu, P. Liu, J. Lv, Y. Liu and Q. Wang, J. Hazard. Mater., 2020, 384, 121371 CrossRef CAS.
- J. Wu, J. Yang, P. Feng, G. Huang, C. Xu and B. Lin, Chemosphere, 2020, 246, 125734 CrossRef CAS.
- V. Vimal, M. Patel and D. Mohan, RSC Adv., 2019, 9, 26338–26350 RSC.
- A. Shakya, A. Nunezdelgado and T. Agarwal, J. Environ. Manage., 2019, 251, 109570 CrossRef CAS.
- R. Wang, D. Huang, Y. Liu, Z. Peng, G. Zeng, C. Lai, P. Xu, C. Huang, C. Zhang and X. Gong, RSC Adv., 2016, 6, 106201–106210 RSC.
- R. Wang, D. Huang, Y. Liu, C. Zhang, C. Lai, G. Zeng, M. Cheng, X. Gong, J. Wan and H. Luo, Bioresour. Technol., 2018, 261, 265–271 CrossRef CAS.
- Y. Li, Z. Wang, X. Xie, J. Zhu, R. Li and T. Qin, Colloid. Surface. Physicochem. Eng. Aspect., 2017, 514, 126–136 CrossRef CAS.
- H. Jalayeri and F. Pepe, Ecotoxicol. Environ. Saf., 2019, 168, 64–71 CrossRef CAS.
- X. Cui, S. Fang, Y. Yao, T. Li, Q. Ni, X. Yang and Z. He, Sci. Total Environ., 2016, 562, 517–525 CrossRef CAS.
- S. Bashir, J. Zhu, Q. Fu and H. Hu, Environ. Sci. Pollut. R., 2018, 25, 11875–11883 CrossRef CAS.
- Z. Jinwei, J. Ecol. Rural Environ., 2012, 28, 181–186 Search PubMed.
- S. Fan, H. Li, Y. Wang, Z. Wang, J. Tang, J. Tang and X. Li, Res. Chem. Intermed., 2018, 44, 135–154 CrossRef CAS.
- Y. Zhu, H. Liang, R. Yu, G. Hu and F. Chen, Water, 2020, 12, 1117 CrossRef CAS.
- T. Chen, Y. Zhang, H. Wang, W. Lu, Z. Zhou, Y. Zhang and L. Ren, Bioresour. Technol., 2014, 164, 47–54 CrossRef CAS.
- Y. Liu, H. Qin, L. Li, G. Pan, X. Zhang, J. Zheng, X. Han and X. Yu, J. Ecol. Environ. Sci., 2012, 21, 146–152 Search PubMed.
- L. Trakal, V. Veselska, I. Safařik, M. Vitkova, S. Cihalova and M. Komarek, Bioresour. Technol., 2016, 203, 318–324 CrossRef CAS.
- X. Xu, X. Cao, L. Zhao, H. Wang, H. Yu and B. Gao, Environ. Sci. Pollut. R., 2013, 20, 358–368 CrossRef CAS.
- J. H. Park, G. Choppala, N. Bolan, J. Chung and T. Chuasavathi, Plant Soil, 2011, 348, 439–451 CrossRef CAS.
- J. Jiang, R. K. Xu, T. Y. Jiang and Z. Li, J. Hazard. Mater., 2012, 229, 145–150 CrossRef.
- O. R. Harvey, B. E. Herbert, R. D. Rhue and L. Kuo, Environ. Sci. Technol., 2011, 45, 5550–5556 CrossRef CAS.
| This journal is © The Royal Society of Chemistry 2020 |


