 Open Access Article
Hyper oxygen incorporation in CeF3: a new intermediate-band photocatalyst for antibiotic degradation under visible/NIR light†
Bing Hana,
Siqi Yu a,
Dian Zhao
 ab,
Yunchao Loua,
Jiayang Gaoa,
Zhe Liua,
Zhiyu Wang
 *a and
Guodong Qian
 *a
*a
aState Key Laboratory of Silicon Materials, Department of Materials Science and Engineering, Zhejiang University, Hangzhou 310027, China. E-mail: wangzhiyu@zju.edu.cn; gdqian@zju.edu.cn
bKey Laboratory of the Ministry of Education for Advanced Catalysis Materials, College of Chemistry and Life Sciences, Zhejiang Normal University, Jinhua, 321004, China
First published on 22nd October 2020
Abstract
Intermediate-band semiconductors perform functions similar to natural photosynthesis by combining two photons to achieve a higher electron excitation. In this study, a strategy was developed to prepare a high oxygen-doped CeF3 (CeF3-O) nanomaterial that exhibits photocatalytic activity under visible/NIR light for the first time. The homogeneous doping oxygen atoms were verified to efficiently modify the band structure of CeF3. DFT calculation predicted the formation of an intermediate band within CeF3 upon homogeneous doping of O at interstitial sites. The interaction between F and O atoms generates an intermediate band, which divides the total bandgap of CeF3-O into two sub-bandgaps at about 1.7 eV and 2.9 eV, enabling CeF3-O photocatalysis under visible light and NIR light. Reflectance spectra evidenced that the same bandgaps exist. The photocatalytic activities of CeF3-O were tested by wavelength-controlled light. The rate constants of TC-HCl photodegrading under visible/NIR light are 12.85 × 10⁻³ min−1 and 1.28 × 10⁻³ min−1, respectively. The two-step electron transfer was also obviously confirmed in visible-light photocatalysis. In conclusion, the high oxygen doping builds a more applicable band structure of CeF3-O for photocatalytic performance, charge transfer and special light response for visible/NIR light.
1. Introduction
A large number of semiconductor photocatalysts have been investigated to achieve the goal of degrading organic pollutants into non-toxic products by solar energy.1–3 On the basis of photocatalysis, the photodegradation efficiency of semiconductor-based photocatalysts is mainly determined by its bandgap, the position of conduction band (CB) and valence band (VB), and photogenerated carrier transfer.4,5 Due to poor penetration of ultraviolet light in water, long-wave sunlight is more suitable for organic pollutant photodegradation. Meanwhile, for improving the solar utilization, semiconductor photocatalysts have been modified by the methods of ion doping, Z-scheme and quantum dots to broaden the solar response range.6–9The visible light activity of semiconductor photocatalysts, in particular TiO2, has been improved by metal and non-metal doping for several decades.10,11 The doping energy levels in this band structure just try to decrease the bandgap in order to extend spectral absorption to the visible region. However, the potential of the ˙OH/H2O reaction is 2.72 eV vs. NHE. This demands that semiconductor photocatalysts take on a high enough VB, where holes react with water molecules to generate oxygen radicals. The reduced bandgap of the ion-doped photocatalyst is unconducive to the generation of oxygen radicals. Thus, the Z-scheme heterojunction has been rapidly developed for the photodegradation of organic pollutants to combine two low-energy photons to achieve a higher energy electron excitation with a broader sunlight illumination.12,13
With the same two-photon absorbing manner, the intermediate band scheme has increased the current of solar cells, which implements the two-photon working principle.14 Different from the Z-scheme, intermediate band scheme does not spatially separate the two absorptions, so that a smaller electron-transfer barrier exists, taking advantage of full electronic transferring.15 An important way to achieve the intermediate band scheme is to introduce intermediate band levels in a host semiconductor via hyper doping.16 Different from the light ion doping of the previously reported photocatalyst TiO2, this essentially requires a high enough concentration of doping ions to ensure that the inserted levels could have a delocalized character to form a true band. However, it has been verified that these doping ions can reduce nonradiative recombination.17 In the past years, several intermediate band scheme materials are used as solar cells and photocatalysts.
The rare-earth compounds with huge characteristic f–f and f–d transitions are perfect luminescent materials with high photoelectric conversion efficiency and long lifetime of excited state due to its rich electrons and energy levels.18,19 All the time, the research of rare earth photocatalysts focus on CeO2 and rare earth-based perovskites, some in connection with CeF3.20–22 CeF3-based composite photocatalysts could convert visible light into ultraviolet light by efficient upconversion emissions of CeF3, enhancing the photocatalytic activity under visible light.23,24 It has been hardly regarded as a feasible photocatalyst by itself and rarely used in NIR light photocatalysis due to its wide bandgap.25 The larger lattice space of CeF3 makes it to be an ideal host semiconductor material for hyper doping. The mechanism of the intermediate band scheme shows a viable way to synthesize a novel CeF3 photocatalyst. Considering about the interaction between Ce atoms and other non-metal atoms, oxygen may be easier to be introduced as a doping atom and may easily modify CeF3.
Modified CeF3 applied in photocatalysis is an important extension for photocatalysts. Herein, we focus on a special process to investigate a CeF3-O photocatalyst (CeF3 with a hyper oxygen doping). Open-framework H25.5(NH4)10.5Ce9O27F18 was required as the precursor and synthesized under simpler conditions than that ever reported.26 The introduction of oxygen efficiently modified the electronic band gap structure, generating an intermediate band. An obvious two-step electron transfer was observed in the photocatalysis process. CeF3-O with high-concentration doped oxygen up to 18.7 mol% exhibited a porous structure and activity for tetracycline hydrochloride (TC-HCl) photodegradation under both visible and NIR light.
2. Methods
2.1 Materials and analysis methods
Cerium(IV) diammonium nitrate ((NH4)2Ce(NO3)6), ammonium fluoride (NH4F), and tetracycline hydrochloride (TC-HCl) were purchased from Sinopharm Chemical Reagent Co. Ltd. All reagents were of analytical grade and used without further purification. Deionized water was used throughout the experiments.SEM (scanning electron microscopy) images were acquired using a Hitachi S4800 field-emission scanning electron microscope. XRD (X-ray diffraction) patterns were recorded using a Shimadzu XRD-7000 X-ray diffractometer equipped with a Cu Kr radiation source at a scanning rate of 1° min−1. PL (photoluminescence) spectra were recorded using a Hitachi F-4600 fluorescence spectrometer. UV-vis spectra and UV-vis diffuse reflectance spectra were recorded using an Agilent Cary 5000 spectrophotometer. XPS (X-ray photoelectron spectroscopy) spectra were recorded using a Thermo Fisher Scientific ESCALAB 250XI and the binding energies were calibrated by C 1s 284.8 eV. The BET surface area was estimated using a Micromeritics ASAP 2020 adsorption porosimeter based on the nitrogen isotherms at 77 K. TG (thermogravimetric) analysis was carried out using a NETZSCH TG 209 thermal analyzer at a heat rate of 5 °C min−1 in the air. Photoelectrochemical estimates were completed using a Chenhua CHI660E electrochemical workstation.
2.2 Synthesis of CeF3-O nanoparticles
In a typical synthesis procedure, 0.27 g (NH4)2Ce(NO3)6 was dissolved in 20 mL deionized water. Subsequently, 0.445 g NH4F was added under rapid stirring and white precipitates were formed immediately. The mixture was transferred into a Teflon bottle and held in a stainless-steel vessel to further seal. Then, the stainless-steel vessel was placed in a thermostatted oven and heated at 150 °C for 6 h to produce the precursor H25.5(NH4)10.5Ce9O27F18. After heating, the precursor was collected, washed with deionized water and dried. Finally, the dried precursor was calcined at 260 °C, 270 °C and 280 °C, respectively for 1 h at a heat rate of 1 °C min−1 in the air atmosphere.2.3 Photocatalytic degradation and active species measurements
The photocatalytic degradation was assessed in a 50 mL TC-HCl (20 mg L−1) solution with 20 mg photocatalyst. The reactant mixture was cooperated with magnetic stirring and kept in darkness for 30 min to achieve the adsorption–desorption equilibrium between CeF3-O and TC-HCl. Then, the solution was illuminated using a PLS-SXE 300 Xenon lamp with a UV-cutoff filter (>400 nm). After different irradiation intervals, 2 mL sample was taken and followed by centrifugation. The TC-HCl solution concentration was analysed by UV-vis spectrophotometry. The RhB photodegradations followed the same method.2.4 Photoelectrochemical test
Photoelectrochemical measurements were performed with a standard three-electrode configuration using CeF3-O-coated ITO (area: 1 cm2) as the working electrode, a Pt plate as the counter electrode, a saturated calomel electrode as the reference electrode, and 0.1 M Na2SO4 as the electrolyte. A xenon lamp was utilized to supply light, which was cut off by filters (λ > 400 nm or λ > 680 nm). First, 10 mg photocatalyst was dispersed by 1800 μL ethanol and 100 μL Nafion solution (5 wt%) under sonication to make the homogeneous ink, then 50 μL ink was pipetted on the ITO surface to gain films.2.5 Theoretical calculations
Density functional theory (DFT) calculations were performed using the Vienna ab initio simulation package (VASP) by generalized gradient approximation (GGA) with Perdew–Burke–Ernzerhof (PBE) functions.27–30 Spin polarization was considered and the energy cutoff was set to 520 eV. The energy and force convergence criterion were set to 1 × 10⁻⁷ eV and 1 × 10⁻⁴ eV Å−1, respectively. The DFT+U method proposed by Dudarev et al. was adopted with a (U–J) value of 5.0 eV to describe the strongly correlated f-electrons of Ce.31 van der Waals corrections (DFT-D2 method proposed by Grimme) were also incorporated to characterize the long-range interactions.323. Results and discussion
3.1 Characterization of the obtained CeF3-O
We prepared the H25.5(NH4)10.5Ce9O27F18 precursor by mixing and heating (NH4)2Ce(NO3)6 and NH4F aqueous solution (Fig. S1a†). Then, the dried precursor was calcined at various temperatures. The detailed XRD patterns of the obtained samples are shown in Fig. S1b.† The diffraction peaks of samples match well with CeF3. However, after calcination at 260 °C, the precursor decomposes incompletely; while after calcination at 280 °C, CeO2 is observed. Fig. 1a shows the characteristic diffraction peaks of CeF3 obtained by calcination at 270 °C. Interestingly, the positions of diffraction planes in this CeF3 are slightly different from the standard (Table 1), which indicates that the lattice distortions are formed.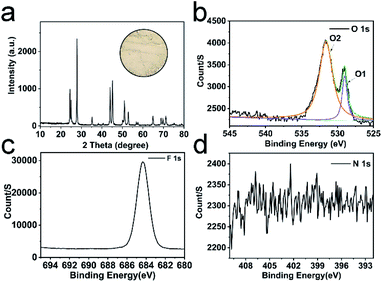 | ||
| Fig. 1 XRD pattern of CeF3 calcined at 270 °C (JCPDS card no. 08-0045), the inset is the optical image of CeF3 calcined at 270 °C (a); XPS spectra of O 1s (b), F 1s (c) and N 1s (d). | ||
| Lattice plane | (110) | (300) | (302) | (221) | (214) | (304) | (115) | (411) |
| 2θ (degree) of standard | 25.06° | 44.05° | 51.02° | 52.96° | 64.98° | 68.90° | 69.74° | 71.30° |
| 2θ′ (degree) of 270 °C | 25.00° | 43.98° | 50.92° | 52.88° | 64.88° | 68.86° | 69.68° | 71.14° |
To evaluate the lattice distortion of this CeF3, XPS spectra of elemental O, F, N and Ce were provided. The doping ratio of O is up to 18.7 mol% (Table S1†), which may have a huge impact on the lattice. Two typical peaks of O at 529.0 and 531.6 eV (labelled as O1, O2) in Fig. 1b are attributed to lattice oxygen and chemisorbed oxygen, respectively.33 The Ce 3d XPS spectra (Fig. S2†) display Ce 3d3/2 and 3d5/2 states assigned to more Ce3+ and fewer Ce4+.34,35 The main peak of F 1s (Fig. 1c) at 684.4 eV shifts towards the lower binding energy compared with the standard value of 685.7 eV, which suggests the banding between Ce and the doping O. Moreover, no crystal phase of rare earth oxides is surveyed in the XRD patterns, showing that doped O was homogeneously distributed at interstitial sites. Thus, this CeF3 doped with O is named by CeF3-O. The CeF3-O appears in pale pink (Fig. 1a inset) to enhance the absorption of visible light. The N 1s peak does not appear in the XPS spectrum (Fig. 1d), suggesting that the colour's diversity is due to the appearance of oxygen. The FTIR spectra (Fig. S3†) further confirm the structural change. Compared with the commercial CeF3, two sharp bands of CeF3-O located at 3280 and 1426 cm−1 with strong intensity are attributed to the stretching and bending vibrations of –OH, respectively. It forms from the oxygen of CeF3-O, which have affinities with water molecules in the air. The typical peak at 574 cm−1 is the Ce–O stretching vibration. The above-mentioned results reveal that the oxygen atom is the chief reason of lattice distortion, and its hyper doping ratio and Ce–O bonding may create the intermediate band and have great influence on the performance of the photocatalyst.
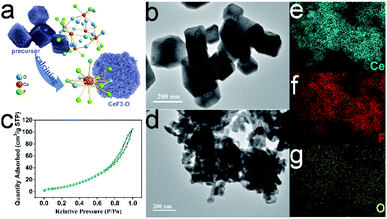
The precursor H25.5(NH4)10.5Ce9O27F18 has a special open-framework structure, which is constituted by six CeO6F2 dodecahedra (Fig. 2a and S4a†).26 The basic building unit of CeO6F2 provides a major factor for homogeneous oxygen-doped CeF3-O preparation. Further characterization by TEM obviously reveals that the precursor presents a hollow rhombohedral structure at a scale ranging from 100–400 nm (Fig. 2b and S4b†). During the calcination process, the precursor gradually decomposed into smaller nanoparticles. The rhombohedral structure is still kept and built up by CeF3-O nanoparticles, when calcination was completed (Fig. 2d). Besides, the element mappings demonstrate the homogeneous distribution of cerium, fluorine and oxygen elements in CeF3-O (Fig. 2e–g). It was also found that the surface area of CeF3-O was 39.3 m2 g−1, and a type-IV isotherm with an H3 hysteresis loop is presented in Fig. 2c. Such porous structures with a larger surface area might play a positive role in photocatalysis, which can possess efficient exposure and active sites with the substrate.
3.2 Energy gap analysis and intermediate band
The first-principles pseudopotential methods based on DFT were carried out to understand the influence of doping O on the band structure and electronic properties of CeF3-O. On the basis of the XPS test, it is assumed that there is an oxygen atom in the CeF3-O structure doping per CeF3 at interstitial sites. The model is shown in Fig. 3a and S12.† The calculated band structure and DOS of pristine CeF3 and CeF3-O (Fig. 3 and S5†) confirm the changes attributed to oxygen doping. Unlike the direct band gap of CeF3, CB and VB are located at different Brillouin zones. CeF3-O changes into an indirect band gap. A new energy level generates at about 1.2 eV as an intermediate band. The density of states (DOS) diagrams of CeF3-O (Fig. 3d and S7†) are displayed to reveal the contributions of every participant orbital to the band. It can be seen that the intermediate band mainly comprises the dopant O 2p and F 2p unoccupied molecular orbitals by reason of the close-range between O2− and F− ions. The maximum of VB is composed of dopants O 2p, F 2p and Ce 4f occupied molecular orbitals. The minimum of CB principally originates from the Ce 5d and 4f states. The charge density distributions of pristine CeF3 and CeF3-O on the [001] plane agree with the previous calculations of bandstructure and DOS (Fig. S8†). For pristine CeF3, electronic charges transfer from electropositive Ce atoms to the adjacent electronegative F atoms, forming ionic bonds. For CeF3-O, O exhibits lighter electronegativity and more electrons transfer from Ce atoms to other types of atoms.Moreover, two new energy gaps exist. The broader one between the intermediate band and VB is 2.9 eV, which is the main reason for the pale pink colour. The narrow one calculated by the intermediate band and CB is 1.8 eV. Both of them enable CeF3-O with visible light absorption. Simultaneously, when O is doped into CeF3, the electrons transferring from the VB to CB can be effortless to jump a tiny energy gap. That is favourable for the electron–hole pair generation and separation. These calculation results may indicate that CeF3-O possesses photocatalytic activity in the visible-light region.
These calculated values based on DFT are generally verified. Fig. 3b shows the optical bandgaps of CeF3-O generated from the diffuse reflectance spectrum by the Kubelka–Munk equation.36,37 The chief bandgap estimated from the intercept of the tangent to the plot is around 2.9 eV, while a tail bandgap was evaluated to be 1.7 eV, making the possibility of TC-HCl photodegradation under NIR light irradiation. The bandgap values of reflectance spectra are well coincided with the values obtained from the calculation.
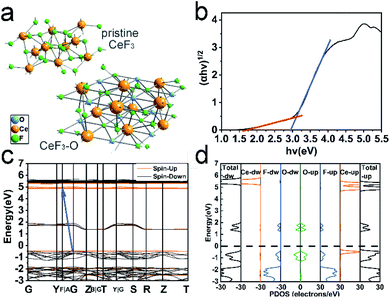 | ||
| Fig. 3 Schematic of pristine CeF3 and CeF3-O crystal structures. The interacting O atoms were labeled in blue (a); the optical band gaps of CeF3-O using the Kubelka–Munk function (b); DFT-calculated band structure of CeF3-O, details in Fig. S5† (the blue arrow points from VB to CB) (c); the total and partial DOS of CeF3-O (d). | ||
3.3 Photocatalytic performance of CeF3-O under visible/near-infrared light and its two-photon absorption
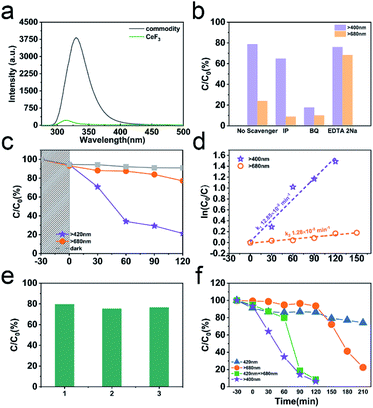
The PL emission of CeF3-O is completely quenched compared to commodity CeF3 (Fig. 4a). The commodity CeF3 exhibits a heavy emission peak at 330 nm ascribed to the high electron–hole pair recombination rate, while CeF3-O shows a very low intensity. In the absence of O2− ions as nonradiative centres, electrons and holes remain spatially diffusing. This results in increasing the life time of charge carriers and demonstrates the appearance of photocatalytic performance by CeF3-O.For evaluating the photocatalytic performance, a significant TC-HCl photocatalytic degradation efficiency is observed in CeF3-O (Fig. 4c). In the darkness, the TC-HCl absorption of CeF3-O is about 9.0%, while the process of CeF3-O degrading TC-HCl takes 120 min and boasts a 78.7% efficiency rate under visible light. Under the same conditions, the degrading ratio under NIR light is 22.8%. The degradation with time is fitted by a pseudo-first-order kinetic model:38
To further understand the photocatalytic mechanism, the trapping experiments in the photocatalytic process under visible and NIR light are displayed in Fig. 4b. BQ, EDTA 2Na and IP are used to scavenge ˙O2−, h+ and ˙OH species, respectively.39–41 The addition of IP scavenges ˙OH and has little effect on the TC-HCl degradation. The ˙OH contribution is exiguous compared to ˙O2−. By adding EDTA 2Na, to a more extent, the reaction is 75.9% of TC-HCl degradation. The degradation in the presence of BQ is 17.6%, suggesting that the photocatalytic performance is suppressed significantly and ˙O2− is the main active species in this photocatalytic process. Like the results under visible light, the degradations under NIR light in the presence of IP and BQ are both below 10%, showing that the photocatalytic performance is almost terminated. It testifies that there are barely ˙OH and ˙O2− at this process. The addition of EDTA 2Na captures h+ and reduces the carrier recombination, increasing the degradation up to 68.2%. No matter under visible or NIR light, ˙O2− is the key to degrade TC-HCl. Thus, photogenerated electron in a suitable potential of CB can engender ˙O2− to participate in the redox reaction for TC-HCl degradation.
To further figure out the intermediate band, other degradations of RhB are tested by using different cutoff filters (Fig. 4f). The degradations are just 25.9% (λ = 420 nm) and 77.6% (λ > 680 nm) after illumination lasting 240 min, individually. By the dual light sources, the degradation is completed in 120 min, which is concomitant with the results in the range of visible light. This means that the photocatalysis follows obvious two-photon absorption. When only the light (λ > 680 nm) irradiates, electrons absorb 1.7 eV energy and transfer from VB to intermediate band, bringing out an oxidation–reduction reaction. However, this progress is of low efficiency. After addition of the irradiation at 420 nm, the rate of photocatalytic reaction rapidly increases, which may attribute to the second photon absorption. In this process, redundant electrons absorb 2.9 eV energy and transfer from the intermediate band to CB, carrying on another oxidation–reduction reaction. The intermediate band scheme makes the photocatalytic reaction more efficient under visible light.
3.4 Electrochemistry properties and the proposed photocatalytic mechanism
Faster separation and transfer of photogenerated carriers can achieve much better photocatalysis property. The Nyquist impedance plots for CeF3-O under light irradiation are displayed (Fig. 5a). The arc radius of CeF3-O under visible light is smaller, which demonstrates that CeF3-O possesses a finer electronic conductivity in photoexcited state and a less obstruction for the transfer of photogenerated carries.42,43 A Mott–Schottky test was applied to describe the carrier density upon the Schottky barrier between electrolytes and electrodes, which could further confirm semiconductor types and flat band potential. Fig. 5b exhibits the Mott–Schottky plots for CeF3-O, which displays a positive slope. It is the characterization of the n-type semiconductor. Based on the following equation:44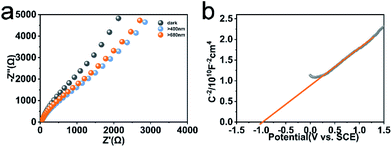 | ||
| Fig. 5 EIS spectra of CeF3-O without or with light (λ > 400 nm and λ > 680 nm) (a). Mott–Schottky plots of the CeF3-O (b). | ||
The flat band potential of CeF3-O can be calculated to be −1.00 eV vs. SCE, which is −0.76 eV vs. NHE. CB can be negative about 0.1–0.4 eV in comparison to flat band.45,46 Thus, CB of the CeF3-O is noted at −0.86 eV. According to the band structure and active species experiments, the VB position of CeF3-O (+3.74 eV vs. NHE) is more positive than E (˙OH/OH−) (+2.38 eV vs. NHE) and E (˙OH/H2O) (+2.72 eV vs. NHE). Holes generated in VB can easily react with water molecules adsorbed on the surface of photocatalyst or hydroxyls to form ˙OH radicals. Meanwhile, the CB position (−0.86 eV) is negative by contrast with E (O2/˙O2−) (−0.33 eV vs. NHE); electrons in CB react with O2 to engender ˙O2− radicals. For the intermediate band, the position +2.04 eV is above E (H+, O2/H2O2) (+0.94 eV vs. NHE), and electrons could react with H+ and O2 to produce H2O2, slowly degrading TC-HCl.
All above decidedly elucidate the reason for the visible-light-spectrum-response photocatalytic activity of CeF3-O. The whole process can be broken into three steps (illustrated in Fig. 6):
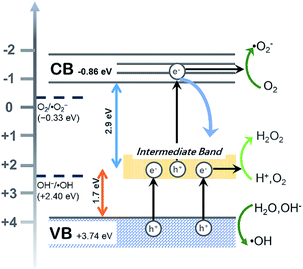 | ||
| Fig. 6 Proposed photocatalytic mechanism by the CeF3-O photocatalyst under visible light irradiation. | ||
(i) The intermediate band is generated in the new band structure, which not only can be an electron acceptor but also an electron donor. (ii) Electrons absorb a certain energy and transfer from VB to the intermediate band, leaving an electron vacancy; the electron–hole pair separates. Parts of oxidation–reduction reaction run in VB and a new CB of intermediate band. (iii) The redundant electrons absorb another certain energy and transfer once more from the intermediate band to CB to occupy the electron vacancy, producing the electron hole pair in the CB and VB. The electron–hole pair separates again, resulting in another oxidation–reduction reaction.
4. Conclusion
In summary, CeF3-O is presented for the first time as a photocatalyst under visible and NIR irradiation. The special process to investigate CeF3-O is based on the way of thermal control decomposing the precursor H25.5(NH4)10.5Ce9O27F18, which is synthesized differently from that ever reported. CeF3-O, with high-concentration oxygen dopants up to 18.7 mol%, exhibits a porous structure and favourable activities for TC-HCl photodegradation. Besides, the test confirms that the main active species in visible light photocatalysis is ˙O2−and NIR light is e−.The introduction of oxygen is confirmed to largely modify the electronic band gap structure, which is verified by simulated calculation and experimental results. Compared to CeF3, CeF3-O comprises a new intermediate band. Two narrow band gaps are formatted at about 1.7 eV and 2.9 eV, making photocatalysis follow the obvious two-step electron transfer. More importantly, these results indicated that oxygen doping can modify the band structure and electronic property of CeF3-O for photocatalytic performance, transfer charge easily as well as broaden the light response region, even in the near-infrared region. It is believed that this method has great significance for exploring an enlightening pathway to design and synthesize porous photocatalysts in the visible and NIR regions.
Conflicts of interest
There are no conflicts to declare.Acknowledgements
This work is supported by the National Natural Science Foundation of China (51872258). We also acknowledge Key Laboratory of the Ministry of Education for Advanced Catalysis Materials of Zhejiang Normal University for DFT calculation.Notes and references
- Z. Xing, J. Zhang, J. Cui, J. Yin, T. Zhao, J. Kuang, Z. Xiu, N. Wan and W. Zhou, Appl. Catal., B, 2018, 225, 452–467 CrossRef CAS.
- A. D. Liyanage, S. D. Perera, K. Tan, Y. Chabal and K. J. Balkus, ACS Catal., 2014, 4, 577–584 CrossRef CAS.
- Z. Wang, M. Chen, D. Huang, G. Zeng, P. Xu, C. Zhou, C. Lai, H. Wang, M. Cheng and W. Wang, Chem. Eng. J., 2019, 374, 1025–1045 CrossRef CAS.
- T.-W. Liao, S. W. Verbruggen, N. Claes, A. Yadav, D. Grandjean, S. Bals and P. Lievens, Nanomaterials, 2018, 8, 30 CrossRef.
- J. Li and N. Wu, Catal. Sci. Technol., 2015, 5, 1360–1384 RSC.
- X. Guan and L. Guo, ACS Catal., 2014, 4, 3020–3026 CrossRef CAS.
- X. Hu, G. Zhang, C. Yin, C. Li and S. Zheng, Mater. Res. Bull., 2019, 119, 110559 CrossRef CAS.
- H. Guo, C.-G. Niu, D.-W. Huang, N. Tang, C. Liang, L. Zhang, X.-J. Wen, Y. Yang, W.-J. Wang and G.-M. Zeng, Chem. Eng. J., 2019, 360, 349–363 CrossRef CAS.
- H. Xu, Y. Jiang, X. Yang, F. Li, A. Li, Y. Liu, J. Zhang, Z. Zhou and L. Ni, Mater. Res. Bull., 2018, 97, 158–168 CrossRef CAS.
- M. R. D. Khaki, M. S. Shafeeyan, A. A. A. Raman and W. M. A. W. Daud, J. Environ. Manage., 2017, 198, 78–94 CrossRef CAS.
- Q. Sun, J. Zhang, P. Wang, J. Zheng, X. Zhang, Y. Cui, J. Feng and Y. Zhu, J. Renew. Sustain. Energy, 2012, 4, 023104 CrossRef.
- J. Qu, X. Wang, Y. Zhang and G. Yuan, Sol. Energy, 2018, 170, 124–131 CrossRef CAS.
- J. Zhang, M. Yan, X. Yuan, M. Si, L. Jiang, Z. Wu, H. Wang and G. Zeng, J. Colloid Interface Sci., 2018, 529, 11–22 CrossRef CAS.
- A. Luque, A. Martí and C. Stanley, Nat. Photonics, 2012, 6, 146–152 CrossRef CAS.
- A. Luque and A. Martí, Adv. Mater., 2010, 22, 160–174 CrossRef CAS.
- R. Lucena, J. C. Conesa, I. Aguilera, P. Palacios and P. Wahnón, J. Mater. Chem. A, 2014, 2, 8236–8245 RSC.
- E. Antolín, A. Martí, J. Olea, D. Pastor, G. González-Díaz, I. Mártil and A. Luque, Appl. Phys. Lett., 2009, 94, 042115 CrossRef.
- J. Liu, A. M. Kaczmarek and R. Van Deun, Chem. Soc. Rev., 2018, 47, 7225–7238 RSC.
- B. del Rosal, E. Ximendes, U. Rocha and D. Jaque, Adv. Opt. Mater., 2017, 5, 1600508 CrossRef.
- M. Zeng, Y. Li, M. Mao, J. Bai, L. Ren and X. Zhao, ACS Catal., 2015, 5, 3278–3286 CrossRef CAS.
- A. Krukowska, G. Trykowski, W. Lisowski, T. Klimczuk, M. J. Winiarski and A. Zaleska-Medynska, J. Catal., 2018, 364, 371–381 CrossRef CAS.
- H. Miao, G. F. Huang, L. Xu, Y. C. Yang, K. Yang and W. Q. Huang, RSC Adv., 2015, 5, 95171–95177 RSC.
- C. Tang, W. Hou, E. Liu, X. Hu and J. Fan, J. Lumin., 2014, 154, 305–309 CrossRef CAS.
- J. Wan, L. Sun, E. Liu, J. Fan, X. Hu, C. Pu, J. Li and X. Du, Mater. Lett., 2016, 169, 189–192 CrossRef CAS.
- C. Tang, J. Fan, E. Liu and W. Hou, IOP Conf. Ser. Earth Environ. Sci., 2018, 189, 052061 CrossRef.
- R. Yu, W. Dan, N. Kumada and N. Kinomura, Cheminform, 2010, 32, 3527–3529 Search PubMed.
- G. Kresse and J. Furthmüller, Phys. Rev. B, 1996, 54, 11169–11186 CrossRef CAS.
- G. Kresse and J. Furthmüller, Comput. Mater. Sci., 1996, 6, 15–50 CrossRef CAS.
- J. P. Perdew, J. A. Chevary, S. H. Vosko, K. A. Jackson, M. R. Pederson, D. J. Singh and C. Fiolhais, Phys. Rev. B, 1992, 46, 6671–6687 CrossRef CAS.
- J. P. Perdew, K. Burke and M. Ernzerhof, Phys. Rev. Lett., 1996, 77, 3865–3868 CrossRef CAS.
- S. L. Dudarev, G. A. Botton, S. Y. Savrasov, C. J. Humphreys and A. P. Sutton, Phys. Rev. B, 1998, 57, 1505–1509 CrossRef CAS.
- S. Grimme, J. Comput. Chem., 2006, 27, 1787–1799 CrossRef CAS.
- X. She, H. Xu, H. Wang, J. Xia, Y. Song, J. Yan, Y. Xu, Q. Zhang, D. Du and H. Li, Dalton Trans., 2015, 44, 7021–7031 RSC.
- F. ç. Larachi, J. Pierre, A. Adnot and A. Bernis, Appl. Surf. Sci., 2002, 195, 236–250 CrossRef CAS.
- R. Zhang, Q. Zhong, W. Zhao, L. Yu and H. Qu, Appl. Surf. Sci., 2014, 289, 237–244 CrossRef CAS.
- Y. Sang, Z. Zhao, M. Zhao, P. Hao, Y. Leng and H. Liu, Adv. Mater., 2015, 27, 363–369 CrossRef CAS.
- W. Zhao, W. Ma, C. Chen, J. Zhao and Z. Shuai, J. Am. Chem. Soc., 2004, 126, 4782–4783 CrossRef CAS.
- J.-P. Simonin, Chem. Eng. J., 2016, 300, 254–263 CrossRef CAS.
- J. Hu, X. Li, X. Wang, Q. Li and F. Wang, Dalton Trans., 2019, 48, 8937–8947 RSC.
- Y. Zhang, L. Luo, Z. Shi, X. Shen, C. Peng, J. Liu, Z. Chen, Q. Chen and L. Zhang, ChemCatChem, 2019, 11, 2855–2863 CrossRef CAS.
- M. Curti, A. Kirsch, L. I. Granone, F. Tarasi, G. López-Robledo, D. W. Bahnemann, M. M. Murshed, T. M. Gesing and C. B. Mendive, ACS Catal., 2018, 8, 8844–8855 CrossRef CAS.
- B. Li, C. Lai, G. Zeng, L. Qin, H. Yi, D. Huang, C. Zhou, X. Liu, M. Cheng, P. Xu, C. Zhang, F. Huang and S. Liu, ACS Appl. Mater. Interfaces, 2018, 10, 18824–18836 CrossRef CAS.
- J. Di, J. Xia, Y. Ge, L. Xu, H. Xu, J. Chen, M. He and H. Li, Dalton Trans., 2014, 43, 15429–15438 RSC.
- X.-J. Wen, C.-G. Niu, L. Zhang, C. Liang and G.-M. Zeng, Appl. Catal., B, 2018, 221, 701–714 CrossRef CAS.
- Y. Matsumoto, J. Solid State Chem., 1996, 126, 227–234 CrossRef CAS.
- X.-J. Wen, C.-G. Niu, L. Zhang, C. Liang, H. Guo and G.-M. Zeng, J. Catal., 2018, 358, 141–154 CrossRef CAS.
Footnote |
| † Electronic supplementary information (ESI) available. See DOI: 10.1039/d0ra06107g |
| This journal is © The Royal Society of Chemistry 2020 |

