 Open Access Article
A green synthesis of nanocatalysts based on reduced graphene oxide/magnetic nanoparticles for the degradation of Acid Red 1†
Fatemeh Sadeghab,
Nikolaos Politakosa,
Estibaliz González de San Romána,
Oihane Sanzc,
Iñigo Perez-Miqueoc,
Sergio Enrique Moya d and
Radmila Tomovska
 *ae
*ae
aPOLYMAT, Departamento de Química Aplicada, Facultad de Ciencias, Químicas, University of the Basque Country UPV/EHU, Joxe Mari Korta, Center - Avda. Tolosa, 72, San Sebastian, 20018, Spain. E-mail: radmila.tomovska@ehu.es
bDepartment of Chemistry, Faculty of Sciences, University of Sistan and Baluchestan, P.O. Box 98135 674, Zahedan, Iran
cDepartamento de Química Aplicada, Facultad de Ciencias, Químicas, University of the Basque Country, UPV/EHU, P. Manuel de Lardizabal 3, San Sebastian, 20018, Spain
dCenter for Cooperative Research in Biomaterials (CIC biomaGUNE), Basque Research and Technology Alliance (BRTA), Paseo de Miramon 182, 20014 Donostia San Sebastián, Spain
eIkerbasque, Basque Foundation for Science, Maria Diaz de Haro 3, Bilbao, 48013, Spain
First published on 22nd October 2020
Abstract
The increasing amount of organic dye-polluted wastewater from the textile industry makes the development of techniques for the efficient purification and reuse of wastewater an urgent issue. Accordingly, solid adsorbents based on three-dimensional (3D) reduced graphene oxide (rGO) aerogels combined with magnetic nanoparticles (rGO@Fe3O4) appear to be potential materials, which offer fast and efficient discoloration of dye solutions by dye adsorption, simultaneously acting as Fenton reaction nanocatalysts, and thus may eliminate organic dyes. In this work, 3D rGO@Fe3O4 aerogel nanocatalysts were synthesized via a low-energy, simple, one-step in situ method, in which GO and FeSO4·7H2O were simultaneously reduced. Consequently, monolithic porous nanocatalyst 3D structures were obtained, with a specific surface area of 241 m2 g−1 and pore volume 0.39 cm3 g−1. The nanocatalysts were applied for the degradation of Acid Red 1 azo-dye in aqueous solution in the presence of hydrogen peroxide, without the need for external energy. The effect of the adsorbent dose, and concentration of dye and peroxide on the dye removal was studied. The degradation of the dye was monitored by matrix-assisted laser desorption/ionization time-of-flight mass spectrometry. It was found that an increase in the amount of peroxide allowed complete degradation of the dye together with high molar mass side-products with a conjugated aromatic structure. The good nanocatalyst performance was explained based on the charge-transfer complex established between rGO and the magnetic nanoparticles, allowing the regeneration of ferrous ions during the Fenton process.
1. Introduction
The uncontrollable contamination of natural water bodies in the last few decades has increased the demand for wastewater purification and reuse as urgent issues. One of the most significant sources of water pollution is the textile and paper pulp industries due to the extend consumption of various types of organic dyes,1–3 which are considered among the most dangerous chemical compounds found in industrial effluents.4–6 Thus, different physical, chemical and biological methods, such as electrochemical methods, adsorption, bacteria-degradation, and photocatalysis have been developed to remove dyes from wastewater.7–12 Among them, adsorption technology has attracted significant attention due to its low price and easy access to a wide range of adsorbents, such as activated carbon, porous carbon, zeolites, and clays.13,14 Meanwhile, graphene-based adsorbents have attracted attention in the field of water purification because of their unique features, such as high surface area, excellent mechanical and thermal resistance, thermal and electrical conductivity, favorable physical–chemical stability, and wide choice and diverse structures.15–17 Among the various graphene structures, aerogels with a three-dimensional (3D) assembly show great promise for a wide range of applications due to their high porosity, high specific surface area and ultra-low density together with excellent mechanical and thermal resistance, which make them extraordinary adsorbents for a variety of applications.18 Nevertheless, the isolation of the aerogel from the solution after the purification process is challenging. Magnetic nanoparticles have shown to be very useful for this purpose, and thus have been recognized as the dominant component of environmental clean-up technologies due to their excellent magnetic properties, which allow easy recycling of these nanostructures from the bed.19–21 The use of the magnetic nanoparticles on an rGO aerogel bed increases the efficiency of adsorption-based purification technologies.22–25 Moreover, the presence of magnetic nanoparticles within the structures allows the adsorbed dye to be degraded via the Fenton oxidation process,26 which in the presence of peroxides without the need for external energy, results in the degradation of dyes via the production of active ˙OH radicals in the aqueous dye solution. On the other hand, the embedding of magnetic nanoparticles in rGO aerogels result in an improved adsorption efficiency27 and catalytic performance in the photo-Fenton reaction for the degradation of organic dyes.28–30For the synthesis of hybrid aerogels based on rGO and magnetic nanoparticles (3D rGO@Fe3O4 NPs), the hydrothermal method is usually employed, which involves a prolonged reaction time (8–20 h) and exposing the reaction mixture to high temperature (180–200 °C).30–34 The synthetic methods developed to date require high energy consumption, resulting in a significant environmental impact. The degradation of various organic dyes by the photo Fenton process has been reported in the literature; however, only the discoloration of the aqueous solution was monitored by UV spectrophotometry, and no details on the degradation products were revealed and no analysis to distinguish between the dye quantities eliminated by adsorption and by degradation was performed.
In the present work, we proposed a very simple and low-energy consuming in situ technique for the synthesis of hybrid rGO@Fe3O4 aerogels based on the simultaneous reduction of GO and the ferrous sulfate heptahydrate precursor for the magnetic nanoparticles in an aqueous dispersion. The in situ method for the creation of rGO/Fe3O4 hybrids is well known.35,36 However, herein, we went one step further in order to decrease the energy consumption performing simultaneous thermal and chemical reduction. The addition of the reducing agent (ascorbic acid) allowed us to decrease the reaction temperature to 90 °C and decrease the reduction time to 2 h. To the best of our knowledge, this is the first time this method is used for the synthesis of 3D hybrid rGO@Fe3O4 aerogels. Moreover, the in situ method may generate more intimated contact between both rGO and the Fe3O4 NPs since it was reported that iron ions bond with the oxygen functional groups of GO by coordination, which positively affects the catalytic activity of the resulting hybrid nanocatalysts in the Fenton reaction. The proposed 3D material has a monolithic structure, and thus permitted easy implementation in aqueous dye solutions and prevented secondary pollution due to materials leakage during the operation.
The performance of the 3D rGO@Fe3O4 aerogel was demonstrated for the removal of Acid Red 1 (AR1) from an aqueous solution. AR1 is an azo dye with well-known resistivity towards biological degradation.37 The degradation process was monitored by matrix-assisted laser desorption/ionization time-of-flight mass spectrometry (MALDI-TOF MS). It was determined that all the AR1 in solution was degraded, as well as most of the high molar mass secondary degradation products containing conjugated aromatic rings. The excellent catalytic activity of 3D rGO@Fe3O4 was explained based on the charge transfer complex formation between the magnetic nanoparticles and rGO.
2. Experimental
2.1. Materials
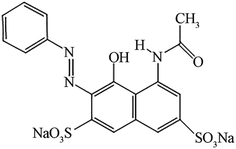
Ferrous sulfate heptahydrate (FeSO4·7H2O, ≥99%), ammonium hydroxide (NH3 H2O, 28–30%), vitamin C or L-ascorbic acid (AsA) (≥99.0%), polyvinylpyrrolidone (PVP; MW 10![[thin space (1/6-em)]](https://www.rsc.org/images/entities/char_2009.gif) 000), hydrogen peroxide (H2O2, 35 wt%) and Acid Red 1 (AR1, dye content, 60%) were purchased from Sigma-Aldrich and used as received without further purification. The dye with the formula C18H13N3Na2O8S2 has an MW of 509.42 and its chemical structure is presented in Fig. 1.
000), hydrogen peroxide (H2O2, 35 wt%) and Acid Red 1 (AR1, dye content, 60%) were purchased from Sigma-Aldrich and used as received without further purification. The dye with the formula C18H13N3Na2O8S2 has an MW of 509.42 and its chemical structure is presented in Fig. 1.
Graphene oxide (GO) aqueous dispersion, 4 mg mL−1 (>90%, monolayer) in the pH range of 2.2–2.5 was purchased from Graphenea. Elemental analysis showed that GO contained 49–56% carbon and 41–50% oxygen. De-ionized water was used for the preparation of all aqueous solutions.
3. Synthesis of 3D reduced graphene oxide/Fe3O4 nanocatalyst
Initially, 50 g of GO dispersion (4 mg mL−1) was ultrasonicated (Hielscher Sonicator, UIS250v) at an amplitude of 70% and energy pulsed at 0.5 Hz for 1 h. The reduction was performed via the addition of ascorbic acid (0.8 g) in the presence of PVP (1.5 g) to prevent re-stacking of the rGO nanoplatelets at 90 °C overnight. The structures were formed within 2 h. Consequently, neat rGO hydrogels were formed. To produce the nanocatalyst structures, prior to the reduction, 0.2 M FeSO4·7H2O was added to the rGO dispersion (molar ratio of rGO![[thin space (1/6-em)]](https://www.rsc.org/images/entities/char_2009.gif) :
:![[thin space (1/6-em)]](https://www.rsc.org/images/entities/char_2009.gif) Fe3O4 = 1
Fe3O4 = 1![[thin space (1/6-em)]](https://www.rsc.org/images/entities/char_2009.gif) :
:![[thin space (1/6-em)]](https://www.rsc.org/images/entities/char_2009.gif) 2) and the pH was adjusted to 11 with NH3 H2O.
2) and the pH was adjusted to 11 with NH3 H2O.
After the reduction, the as-prepared 3D neat rGO and rGO@Fe3O4 hydrogels were purified by a dialysis process for one week, changing the water each day until the water exhibited a constant conductivity. In this process, the reaction products and excess PVP were removed from the structures, in addition to the magnetic nanoparticles, which were not strongly anchored onto the rGO structure. Finally, the structures were frozen with liquid nitrogen, and subsequently freeze-dried (lyophilizated) for 3 days to completely remove the water. The whole synthetic procedure is presented in Fig. 2.
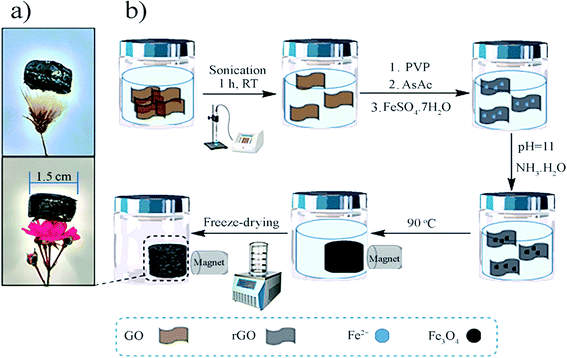 | ||
| Fig. 2 (a) Photos of the 3D rGO@Fe3O4 aerogel monolithic structure with a diameter of 1.5 cm placed on flowers and (b) preparation scheme of the 3D rGO@Fe3O4 aerogel. | ||
4. Characterization
To determine the morphology of the aerogels, scanning electron microscopy (SEM) (Model Hitachi TM3030 tabletop) operated at a voltage of 15 kV and equipped with an energy dispersive X-ray spectroscopy unit (EDX) was used. Thermal gravimetric analysis (TGA) was performed with an SDT Q500 TGA instrument (TA Instruments) under a nitrogen atmosphere using the following temperature program: heating from 25 °C to 800 °C at a heating rate of 10 °C min−1. The Brunauer–Emmett–Teller (BET) surface area and pore size distribution were measured using a Micromeritics ASAP 2020 instrument. The samples were degassed prior to the measurements at 120 °C for 5 h and then the measurements were conducted at 77 K under N2.XPS experiments were performed using a SPECS Sage HR 100 spectrometer with a non-monochromatic X-ray source (aluminium Kα line of 1486.7 eV energy and 252 W) placed perpendicular to the analyzer axis and calibrated using the 3d5/2 line of Ag with a full width at half maximum (FWHM) of 1.1 eV. The selected resolution for the spectra was 15 eV pass energy and 0.15 eV per step. All measurements were performed in an ultra-high vacuum (UHV) chamber at a pressure around 8 × 10⁻⁸ mbar. For the Fe2p and Fe3p regions, the pass energy was 10 eV with 15 acquisitions.
4.1. Degradation of Acid Red 1 by Fenton reaction
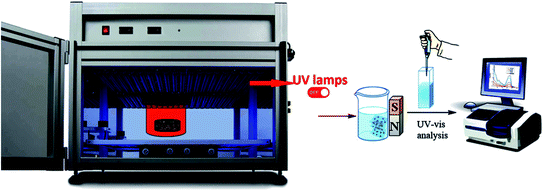
The discoloration of an aqueous solution of AR1 was carried out using both neat rGO and the 3D rGO@Fe3O4 aerogel for 3 h. The aerogel was placed in the AR1 aqueous solution and the beaker was enclosed within a UV chamber (BS-04, Opsytec Dr Groebel), in which the UV light was switched off during the experiment (Experimental, Scheme 1). The initial dye concentration was varied in the range of 0.01–0.12 mg mL−1. In 10 mL dye solution, different quantities of aerogel was added (10–30 mg). The degradation of the dye was performed in the dark using the 3D rGO@Fe3O4 aerogel as a nanocatalyst in presence of different quantities of H2O2 in the range of 0 to 0.2 M (2 mL).The discoloration of the dye solution was monitored using a UV/vis spectrophotometer (Shimadzu model UV-2550, 230 V). During the experiments, a small quantity of the reaction mixture was extracted at certain intervals to obtain the kinetic curve of the discoloration process. After the discoloration experiment, the aerogel was collected from the solution, and then the concentration of dye in the residual solution was determined based on the disappearance of the characteristic absorption peak of AR1 at 506 nm. The calibration curve was prepared and used to determine the changes in the dye concentration (Fig. S1, ESI†).
The percentage removal (% R) of AR1 from the aqueous solution was calculated according to the following equation:38,39
 | (1) |
The aqueous solution after the discoloration experiments was subjected to MALDI-TOF-MS analysis to determine the dye degradation and the intermediate and final products. The MALDI-TOF MS measurements were performed on a Bruker Autoflex Speed system (Bruker, Germany) equipped with a Smartbeam-II laser (Nd:YAG, 355 nm, 2 kHz). Spectra were acquired in the reflection mode and each mass spectrum was the average of 10![[thin space (1/6-em)]](https://www.rsc.org/images/entities/char_2009.gif) 000 shots. The laser power was adjusted during the experiments. Each sample was characterized as received after the Fenton reaction using 9-aminoacridine (9aa, Sigma-Aldrich) as the matrix dissolved in THF at a concentration of 10 mg mL−1. The samples were mixed with the matrix in a ratio of 10
000 shots. The laser power was adjusted during the experiments. Each sample was characterized as received after the Fenton reaction using 9-aminoacridine (9aa, Sigma-Aldrich) as the matrix dissolved in THF at a concentration of 10 mg mL−1. The samples were mixed with the matrix in a ratio of 10![[thin space (1/6-em)]](https://www.rsc.org/images/entities/char_2009.gif) :
:![[thin space (1/6-em)]](https://www.rsc.org/images/entities/char_2009.gif) 2 (matrix/sample). Approximately 0.5 μL of the obtained solution was spotted by hand on a ground steel target plate and allowed to dry in air.
2 (matrix/sample). Approximately 0.5 μL of the obtained solution was spotted by hand on a ground steel target plate and allowed to dry in air.
Spectra were accumulated and processed using the FlexControl (v3.4) and FlexAnalysis software (v3.4), respectively. Peaks were detected in SNAP mode with a signal-to-noise threshold of 3.00 before being processed with a Savitzky–Golay smoothing algorithm (0.05 m/z width, one cycle) and “TopHat” baseline subtraction. External calibration was performed in quadratic mode with a mixture of different polystyrene standards (PS, Varian).
5. Results and discussions
5.1. Characteristics of the aerogels
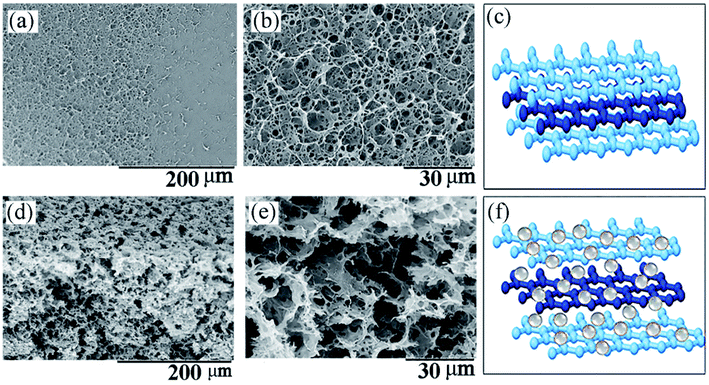
When the GO aqueous dispersion was subjected to the reduction process with AsA, due to the loss of the oxygen functionalities from the surface of GO, a significant augmentation in the hydrophobicity of the platelets occurred. They were already incompatible with the water solvent and spontaneously self-assembled into 3D porous nanostructures.40,41 When this process was performed in the presence of the FeSO4·7H2O precursor for the Fe3O4 NPs, as a result of the simultaneous reduction of GO and the precursor, hydrophobic rGO nanoplatelets decorated with Fe3O4 NPs were assembled into a 3D composite nanostructure. Subsequently, the as-obtained 3D structures were swollen in water and then dried using the freeze-drying technique, resulting the formation of ultralow density aerogels. Fig. 2a presents the photos the 3D aerogels with a diameter of 1.5 cm and thickness of 0.5 cm placed on top of flowers. The magnetic nature of the structure, demonstrating the presence of Fe3O4 NP within it, was proven by exposing the material in aqueous solution to an external magnet. As shown in Fig. S2 in the ESI,† the structure was completely attracted by the magnet and separated on one side of the vessel. Since there was no other magnetic component within the 3D rGO@Fe3O4, it was concluded that the magnetic nanoparticles were formed within the aerogel.The SEM images of the neat rGO 3D structure and the nanocatalyst 3D rGO@Fe3O4 are shown in Fig. 3. The neat rGO (Fig. 3a) exhibited low porosity and a uniform surface morphology made of re-aggregated rGO platelets. Under higher magnification, as shown in Fig. 3b, the micrometer diameter pores could be observed. Fig. 3c shows the proposed model structure of the neat rGO aerogel, demonstrating that the rGO nanoplatelets are re-stacked and closely packed, as observed in Fig. 3a and b. In contrast, as shown in Fig. 3d and e, the SEM images of the 3D rGO@Fe3O4 nanocatalyst aerogel demonstrate its more porous structure and sponge-like fluffy morphology, even under a lower magnification. This structure was formed due to the presence of the magnetic nanoparticles, which act as spacers between the graphene nanoplatelets, partially preventing the re-aggregation of rGO. A model structure of the 3D rGO@Fe3O4 aerogel is shown in Fig. 3f, which presents the nanoparticle spacers and how they prevent aggregation based on Fig. 3d and e. It is worth mentioning that the freeze-dried technique was selected in order to preserve the porous structure during the drying process. Conventional drying by heating induced further re-aggregation of the structure, resulting in more compact structures and loss in porosity, as shown in Fig. S3, ESI.†
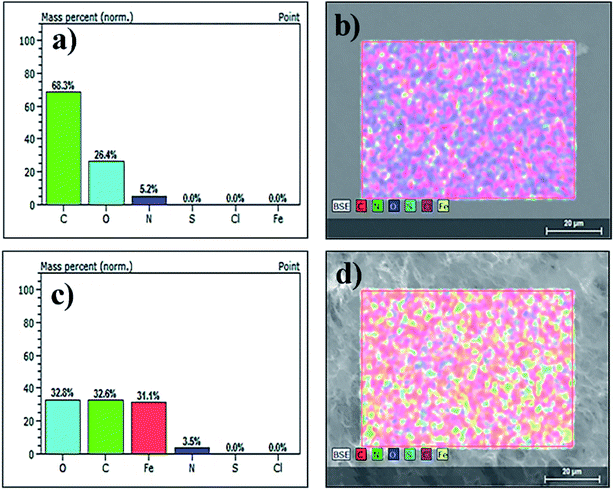
The elemental composition of the aerogels was analyzed by EDX. The corresponding EDX maps of the neat rGO shown in Fig. 4a and b reveal the presence of carbon, oxygen and nitrogen with the content of 68.3 wt%, 26.4 wt% and 5.2 wt%, respectively. The decrease in the amount of C (32.6 wt%) and increase in the amount of O (32.8 wt%) together with appearance of Fe (31.1 wt%) in Fig. 4c and d clearly show that the Fe3O4 nanoparticles were incorporated in the nanocatalyst aerogel and uniformly distributed over the rGO platelets (Fig. 4d).
The porosity and the specific surface area of the nanostructures were determined via nitrogen adsorption–desorption experiments. The nitrogen adsorption–desorption isotherms of the prepared neat rGO structure and the 3D rGO@Fe3O4 nanocatalyst are presented in Fig. S4, ESI.† As indicated, both aerogels present type IV isotherms with a type H3 hysteresis loop according to the IUPAC classification, which show that the aerogels are mesoporous structures. As can be observed from Fig. S4 in the ESI,† the amount of nitrogen adsorbed initially increased slowly with an increase in the gas pressure, indicating monolayer adsorption. Then, the sudden increase in the amount of adsorbed gas at a relative pressure close to 1 indicates multilayer adsorption at higher pressures. This behavior is typical for carbon-based adsorbents.42 The BET surface area, pore volume and pore size of both the neat rGO and 3D rGO@Fe3O4 nanocatalysts are displayed in Table 1. The addition of the magnetic nanoparticles to the rGO platelets improved the available specific surface area of the 3D structure. This is likely due to two reasons, namely the presence of the magnetic nanoparticles as spacers prevented the aggregation of the nanoplatelets and the formation of a higher number of smaller pores, as shown in Fig. S5 in the ESI.†
| Sample | Surface area (m2 g−1) | Total pore volume (cm3 g−1) | Equivalent pore size (nm) |
|---|---|---|---|
| Neat rGO | 205 | 0.71 | 13.7 |
| 3D rGO@Fe3O4 | 241 | 0.39 | 6.4 |
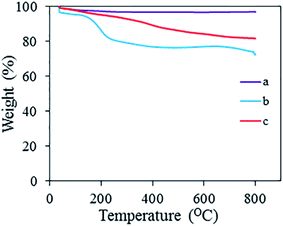
Fig. 5 shows the TGA thermographs for Fe3O4, neat rGO and 3D rGO@Fe3O4 nanocatalyst. In general, a high percentage of residuals was obtained. Magnetic nanoparticles are very stable up to 800 °C, and thus the addition of nanoparticles to rGO significantly improved the thermal stability of the nanocatalyst aerogel. It gradually lost about 17% of its mass up to 800 °C, starting with the evaporation of moisture at 100 °C, the loss of the oxygen functionalities present in rGO at 250 °C, followed by the loss of adsorbed PVP at 350 °C, after which a small fraction of the graphene structure was lost at 800 °C. According to Fig. 5, the neat rGO contained a greater quantity of oxygen functional groups (corresponding to the loss between 100 °C and 250 °C) than the hybrid aerogel.
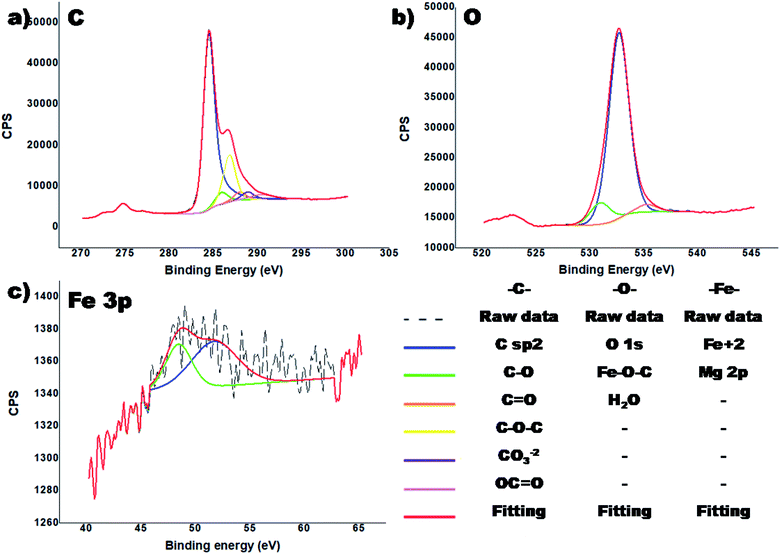
The XPS analysis on the sample was conducted to verify the bonding between rGO and the magnetic nanoparticles, and the results are presented in Fig. 6.
In the C1s region (Fig. 6a), a relatively narrow peak was observed, which after fitting showed that the main contributions are from the C![[double bond, length as m-dash]](https://www.rsc.org/images/entities/char_e001.gif) C (68.6%) in the aromatic ring of the graphemic structure (284.6 eV) and C–O–C (17.9%, 286.1 eV). In Fig. 6a, different types of carbons were observed, including C–O (4.6%), C
C (68.6%) in the aromatic ring of the graphemic structure (284.6 eV) and C–O–C (17.9%, 286.1 eV). In Fig. 6a, different types of carbons were observed, including C–O (4.6%), C![[double bond, length as m-dash]](https://www.rsc.org/images/entities/char_e001.gif) O (3.0%), CO3−2 (2.9%) and OC
O (3.0%), CO3−2 (2.9%) and OC![[double bond, length as m-dash]](https://www.rsc.org/images/entities/char_e001.gif) O (3.0%). The presence of an Fe–C bond was not detected, which would have appeared at around 283 eV.43 In the O 1s region (Fig. 6b), a wide peak was observed. Based on the literature data, the most probable bonding energy of the bond Fe–O–C is within the general range of 531–533 eV.43 Moreover, there are other publications that state the peak for this bond appears at 529.6 eV (ref. 44 and 45) and that of the Fe–O bond at 529.1 eV.45 In our case the peak observed at 530.9 eV is assigned to the Fe–O–C bond. This demonstrates that the magnetic nanoparticles were strongly (covalently) bonded to the rGO aerogel.
O (3.0%). The presence of an Fe–C bond was not detected, which would have appeared at around 283 eV.43 In the O 1s region (Fig. 6b), a wide peak was observed. Based on the literature data, the most probable bonding energy of the bond Fe–O–C is within the general range of 531–533 eV.43 Moreover, there are other publications that state the peak for this bond appears at 529.6 eV (ref. 44 and 45) and that of the Fe–O bond at 529.1 eV.45 In our case the peak observed at 530.9 eV is assigned to the Fe–O–C bond. This demonstrates that the magnetic nanoparticles were strongly (covalently) bonded to the rGO aerogel.
In the region of Fe 2p, no Fe was observed, which possibly is because of the low penetration depth of X-rays (up to 10 nm) since the iron oxide nanoparticles were incorporated deeply in the 3D rGO structure, and thus could not be detected by XPS. Nevertheless, in the Fe 3p region, a low intensity peak of Fe+2 was observed (Fig. 6c). The observed binding energy of 52 eV provides information about the presence of the Fe2+ valence form.
5.2. Discoloration of Acid Red 1 aqueous solution
The adsorption of organic dye onto the surface of solid adsorbents, where it may be subsequently degraded, is an important step that affects the degradation process. Therefore, we performed a study on the adsorption of the dye on the neat rGO and nanocatalyst 3D rGO@Fe3O4 in order to determine the concentration limits and to optimize the necessary quantity of the aerogel. Initially, 10 mg of both aerogels were placed in 10 mL AR1 aqueous solution with a concentration of 0.01 mg mL−1. The solution was completely discolored within 60 min by the neat rGO aerogel and 30 min by the nanocatalyst aerogel. The kinetic curves of the discoloration process are shown in Fig. 7. It is clear that in the case of the 3D rGO@Fe3O4 aerogel, the process was much faster. This is likely due to the higher available BET surface area and smaller pores (Table 1) compared to the neat rGO. On the other hand, the AR1 molecules are negatively charged because of the presence of two sulfonic groups. Since the surface of rGO contains carboxylic groups, which bear electro-negative character, repulsion of AR1 may have occurred. According to the TGA results (Fig. 5), the hybrid contained less oxygen functionalities, and thus, it was less negatively charged than neat rGO structure, providing improved attraction between the hybrid aerogel and AR1. This further supports the observed results of increased adsorption of the dye on the hybrid aerogel compared to the neat rGO.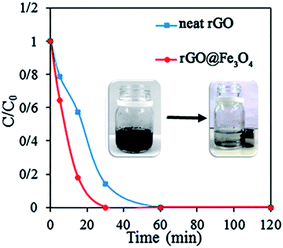 | ||
| Fig. 7 Comparison of the removal of AR1 with a concentration of 0.01 mg mL−1 from aqueous solution by 10 mg of neat rGO and 3D rGO@Fe3O4 aerogel. | ||
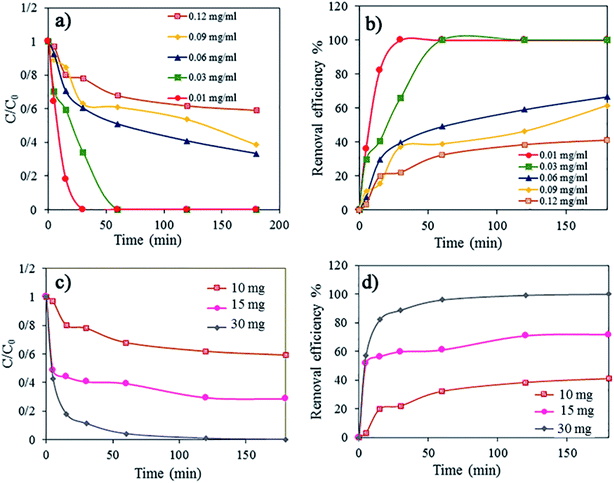
Furthermore, the effect of the dye concentration and amount of 3D rGO@Fe3O4 nanocatalyst adsorbent on the rate of dye adsorption and discoloration of an aqueous solution of AR1 was studied (Fig. 8). The dye concentration was changed in the range of 0.01 to 0.12 mg mL−1. According to Fig. 8a, where the kinetics of dye adsorption is shown as a function of dye concentration, the rate of the dye adsorption at the beginning of the process was not affected significantly. However, after this initial period, in which the dye concentration dropped sharply, the adsorption process was much slower, and thus, the percentage of dye removal decreased (Fig. 8b). This effect was more pronounced at higher dye concentrations, indicating that the process is slower and less efficient in the case of more concentrated solutions. For the solution with a dye concentration of 0.03 mg mL−1, the dye adsorption was 100% and no dye residuals were found in the final aqueous solution after treatment. For a higher concentration, the adsorption decreased to 66.67% for 0.06 mg mL−1, 61.42% for 0.09 mg mL−1, and 40.96% for 0.12 mg mL−1. This is likely due to the saturation of the adsorption sites within the aerogel, where this process occurs sooner in a more concentrated dye solution. Thus, to demonstrate this, we increased the quantity of the adsorbent, the nanocatalyst 3D rGO@Fe3O4 aerogel, from 10 mg to 15 mg and 30 mg (Fig. 8c and d, respectively). Indeed, the higher dosage of adsorbent resulted in faster adsorption initially and a higher process efficiency. It was found that 30 mg of adsorbent was sufficient for the complete discoloration of 10 mL aqueous dye solution with a concentration of 0.12 mg mL−1, which was the highest dye concentration in this study.
5.3. Acid Red 1 degradation by Fenton process over 3D rGO@Fe3O4 nanocatalyst and H2O2
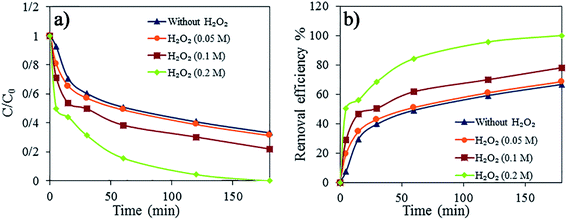
For the degradation of the dye, the 3D rGO@Fe3O4 aerogel was used as a nanocatalyst for the Fenton oxidation reaction using H2O2. The effect of the peroxide concentration (0.01–0.2 M) on the discoloration and degradation efficiency was studied (Fig. 9). H2O2 plays a very important role as a source of hydroxyl radicals in the Fenton reaction.46,47Fig. 9a and b present the dye degradation kinetics and dye removal efficiency in 0.06 mg mL−1 AR1 aqueous solution, respectively. The degradation of AR1 was faster and more efficient with an increase in the concentration of H2O2 because excess H2O2 produced a higher number ˙OH radicals, even though the nanocatalyst dosage was the same. Within the reaction times studied here, the complete discoloration was achieved only in the case of the highest concentration of peroxide (0.2 M).
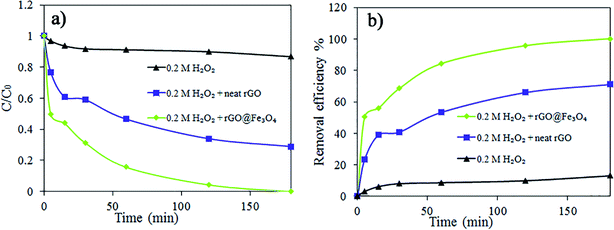
The performance of 3D rGO@Fe3O4 was compared with that of neat rGO in the presence of H2O2 and with only H2O2 (Fig. 10). A much faster process was observed when the nanocatalyst was used. In the case of neat rGO, there was no creation of ˙OH and dye degradation, and therefore the decline in the amount of AR1 observed in Fig. 10 is likely a result of dye adsorption within the 3D structure of neat rGO. On the other hand, when only H2O2 was used, almost no discoloration or degradation occurred. The dye removal efficiency was 13.20% for H2O2 without adsorbent, 71.06% for neat rGO aerogel in the presence of H2O2 and 100% for the 3D rGO@Fe3O4 nanocatalyst aerogel in the presence of H2O2.
To obtain further information about the degradation of AR1 by the Fenton reaction, the initial AR1 aqueous solution with a concentration 0.06 mg mL−1 and three aqueous solutions obtained after the degradation experiments with different H2O2 concentrations (0.05, 0.1 and 0.2 M) were analyzed by MALDI-TOF. The results are presented in Fig. 11. It is worth mentioning that the MALDI-TOF MS technique is very useful for the present aim because there is a lack of fragmentation, which was beneficial to understand the degradation pathway of AR1.
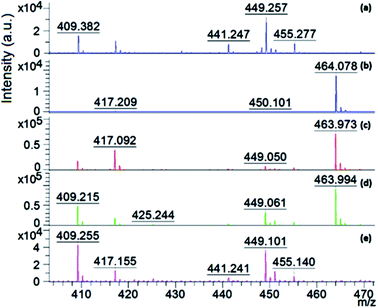 | ||
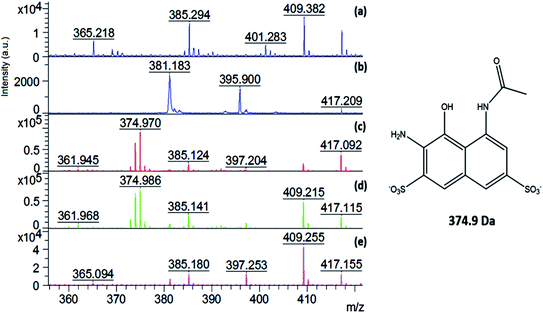
| Fig. 11 Comparison of the average mass spectra of: (a) 9aa (matrix), (b) initial AR1 solution; and aqueous solution after AR1 degradation with (c) 0.05 M H2O2, (d) 0.1 M H2O2, and (e) 0.2 M H2O2. | ||
Fig. 11 shows that the characteristic m/z for the AR 1 ([M − 2Na + H]) species at m/z 464 appeared in all the spectra, except for the aqueous solution after the degradation experiment using 0.2 M H2O2. This demonstrates that all the AR1 present in this solution was fully degraded, which a is clear indication that the Fenton reaction was very efficient in the case of the highest investigated peroxide concentration, even without additional energy (UV light for example).28–30,48
Moreover, the degradation products were also studied via MALDI-TOF-MS. As shown in Fig. 12, the mass spectra in the region of 356–420 m/z is the same species shown in Fig. 11. It can be observed in Fig. 12c–e there are additional peaks that are not present in Fig. 12a (the matrix) and Fig. 12b (the initial AR1 solution). This means that the observed peaks represent new compounds formed during the dye degradation process, and hence indicate the formation of side degradation products. Fig. 12c and d show a degradation product at the m/z of 375, which is probably the first degradation product obtained after the cleavage of the azo bond. It is assigned to a naphthalenic compound, the structure of which is presented in Fig. 12. The lack of this peak in Fig. 12e demonstrates that when 0.2 M H2O2 was used, the main degradation products of AR1 were also decomposed.
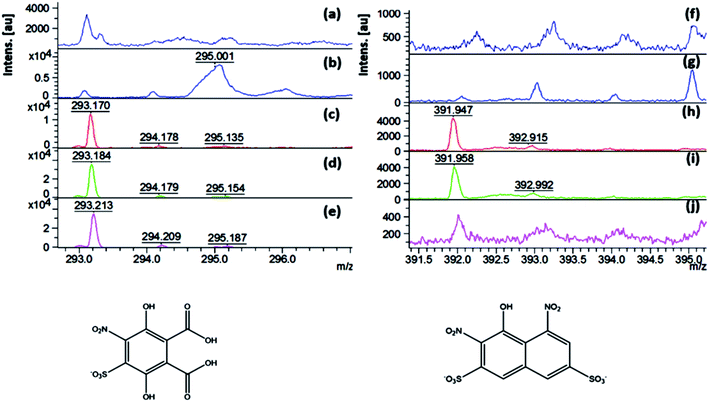
Additional peaks corresponding to the degradation products after the Fenton reaction were observed at the m/z of 293 and 392 in Fig. 13c, d, h and i, respectively. The degradation product observed at 392 m/z was probably formed after deamination and oxidation of the naphthalenic compound with an m/z of 374, the structure of which is shown in Fig. 13, bottom left. The lack of this compound in the aqueous solution after the degradation reaction with 0.2 M H2O2 (Fig. 13j) indicates that this product was also degraded when the highest studied concentration of peroxide was used. However, the degradation product identified at 293 m/z was observed in the spectra of all the aqueous solutions after degradation with different concentrations of H2O2 (Fig. 13c–e). This peak is assigned to the product presented in Fig. 13, bottom right. Even though the conjugated aromatic rings were destroyed by the Fenton reactions, there were still aromatic side-products present in the solutions. Thus, this requires further optimization of the amount of nanocatalyst, peroxide concentration and treatment time. Besides, we were unable to detect small molecules such as CO2 and SO4, which are products expected due to complete dye mineralization, probably due to the ionic suppression of the matrix.
The degradation pathway of AR1 has already been described in the literature.49 The identified degradation products in the present work show that the Fenton degradation process studied here followed the AR1 degradation path proposed previously,49 even though we observed only a few of the products observed in that work. This is likely due to the efficiency of the 3D rGO@Fe3O4 nanocatalyst aerogel, which further degraded many of the side products.
To the best of our knowledge, although the photo Fenton degradation of organic dyes in aqueous solution over 3D rGO@Fe3O4 aerogel nanocatalysts was previously studied, the full degradation of the organic dyes was not reported,30,48 and there were numerous side products present in the system.48
The enhanced performance of the 3D rGO@Fe3O4 aerogel presented herein is probably a result of the process of simultaneous reduction of GO and FeSO4·7H2O, which allowed more intimate contact of the nanoparticles and rGO platelets. This process was performed under relatively mild conditions (90 °C), which gave rise to the formation of C–O–Fe covalent bonding.50 On the other hand, it was demonstrated experimentally51 and theoretically52 that magnetic nanoparticles established a charge transfer complex with graphene, which likely is even more functional when both components bond as intimately as in our case.
The magnetic nanoparticles contain Fe in the divalent state, as demonstrated by the XPS measurements (Fig. 6), and hence the mechanism of the Fenton process for the removal of pollutants from solution occurs according to eqn (2) and (3).53
| H2O2 + Fe2+ → Fe3+ + ˙OH + −OH | (2) |
| RHX + ˙OH → X− + oxidation products (incl. CO2 + H2O) | (3) |
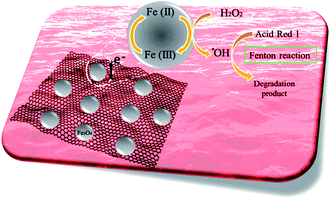
During this process, the catalytic decomposition of hydrogen peroxide (H2O2) as the oxidant and iron ions (Fe2+) as the catalyst in an acidic environment results in the generation of the hydroxyl radical (˙OH), which is the basis of the oxidizing power of the Fenton system. The presence of rGO and the charge transfer complex established with the iron ions probably helps in the regeneration of the ferrous irons, improves the overall catalyst activity and promotes the degradation of the dye and subsequent side products. Fig. 14 schematically shows the Fenton degradation of AR1 over 3D rGO@Fe3O4.
6. Conclusion
A nanocatalyst based on a monolithic 3D rGO@Fe3O4 aerogel was synthesized via the simultaneous thermal and chemical reduction of GO and FeSO4·7H2O, which in one step, self-assembled in a 3D nanocatalyst sponge-like structure. The SEM morphology analysis showed that when the magnetic nanoparticles were incorporated in rGO, the developed structure was more porous because the nanoparticles present between the individual rGO nanoplatelets acted as spacers. Consequently, the BET surface area increased from 205 cm2 g−1 in the neat rGO structure to 241 cm2 g−1 in 3D rGO@Fe3O4.Subsequently, rGO@Fe3O4 was applied as a Fenton nanocatalyst for the removal of the AR1 organic dye from simulated aqueous solutions in the presence of H2O2. The nanocatalyst dosage, and dye and peroxide concentrations were studied as reaction parameters. The AR1 degradation process was evaluated via MALDI-TOF MS. It was found that at a lower peroxide concentration, AR1 was still present in the aqueous solution after the degradation experiment, together with side products that still contained conjugated aromatic rings. At the highest peroxide concentration studied in this work, the dye was completely degraded together with the conjugated aromatic side products, even though some small aromatic molecules could be still observed in the solution. We believe that by optimizing the nanocatalyst dosage, reaction time and peroxide concentration, the degradation would be complete. In comparison with the literature results on the use of similar rGO@Fe3O4 aerogels for the degradation of different dyes, on the one hand, complete dye degradation has not been reported to date, and on the other hand, numerous side large molecule aromatic products were identified. The improved performance of the nanocatalyst herein was attributed to the simultaneous reduction of GO and FeSO4·7H2O, resulting in intimate contact between both components and creation of charge transfer complex. This complex was beneficial for the process of ferrous ion regeneration, speeding up the redox process and improving the activity of the nanocatalyst.
Conflicts of interest
There are no conflicts to declare.Acknowledgements
The authors gratefully acknowledge the financial support by NATO (SfP project G4255), Spanish Government (CTQ2016-80886-R, RTI2018-096294-B-C32 and CTQ2015-73901-JIN), and Basque Government (GV IT999-16 and IT1069-16).References
- D. Pokhrel and T. Viraraghavan, Treatment of pulp and paper mill wastewater-a review, Sci. Total Environ., 2004, 333, 37–58 CrossRef CAS.
- G. Thompson, J. Swain, M. Kay and C. Forster, The treatment of pulp and paper mill effluent: a review, Bioresour. Technol., 2001, 77, 275–286 CrossRef CAS.
- G. Ciardelli, L. Corsi and M. Marcucci, Membrane separation for wastewater reuse in the textile industry, Resour., Conserv. Recycl., 2001, 31, 189–197 CrossRef.
- A. K. Verma, R. R. Dash and P. Bhunia, A review on chemical coagulation/flocculation technologies for removal of colour from textile wastewaters, J. Environ. Manage., 2012, 93, 154–168 CrossRef CAS.
- A. Tehrani-Bagha, N. Mahmoodi and F. Menger, Degradation of a persistent organic dye from colored textile wastewater by ozonation, Desalination, 2010, 260, 34–38 CrossRef CAS.
- K.-T. Chung, Azo dyes and human health: a review, J. Environ. Sci. Health, Part C: Environ. Carcinog. Ecotoxicol. Rev., 2016, 34, 233–261 CrossRef CAS.
- X. Chen, Z. Wu, D. Liu and Z. Gao, Preparation of ZnO photocatalyst for the efficient and rapid photocatalytic degradation of azo dyes, Nanoscale Res. Lett., 2017, 12, 143 CrossRef.
- A. Rostami-Vartooni, M. Nasrollahzadeh, M. Salavati-Niasari and M. Atarod, Photocatalytic degradation of azo dyes by titanium dioxide supported silver nanoparticles prepared by a green method using Carpobrotus acinaciformis extract, J. Alloys Compd., 2016, 689, 15–20 CrossRef CAS.
- V. K. Gupta, R. Saravanan, S. Agarwal, F. Gracia, M. M. Khan, J. Qin and R. Mangalaraja, Degradation of azo dyes under different wavelengths of UV light with chitosan-SnO2 nanocomposites, J. Mol. Liq., 2017, 232, 423–430 CrossRef CAS.
- E. Brillas and C. A. Martínez-Huitle, Decontamination of wastewaters containing synthetic organic dyes by electrochemical methods. An updated review, Appl. Catal., B, 2015, 166, 603–643 CrossRef.
- V. Sreedharan and K. V. B. Rao, Biodegradation of textile Azo dyes, in Nanoscience and biotechnology for environmental applications, Springer, Cham, 2019, vol. 22, pp. 115–139 Search PubMed.
- P. Ilgin and O. Ozay, Novel stimuli-responsive hydrogels derived from morpholine: synthesis, characterization and absorption uptake of textile azo dye, Iran. Polym. J., 2017, 26, 391–404 CrossRef CAS.
- G. Crini, E. Lichtfouse, L. D. Wilson and N. Morin-Crini, Adsorption-oriented using conventional and non-conventional adsorbents for wastewater treatment, in Green Adsorbents Pollut. Removal. Environ. Chem. a Sustain. World, ed. N. Grégorio, C. Lichtfouse, E. D. Wilson and L. Morin-Crini, Springer Nature, Basingstoke, UK, 2018, pp. 23–71 Search PubMed.
- A. A. Adeyemo, I. O. Adeoye and O. S. Bello, Adsorption of dyes using different types of clay: a review, Appl. Water Sci., 2017, 7, 543–568 CrossRef CAS.
- D. Robati, B. Mirza, M. Rajabi, O. Moradi, I. Tyagi, S. Agarwal and V. Gupta, Removal of hazardous dyes-BR12 and methyl orange using graphene oxide as an adsorbent from aqueous phase, Chem. Eng. J., 2016, 284, 687–697 CrossRef CAS.
- T. X. H. Le, M. Bechelany, S. Lacour, N. Oturan, M. A. Oturan and M. Cretin, High removal efficiency of dye pollutants by electron-Fenton process using a graphene based cathode, Carbon, 2015, 94, 1003–1011 CrossRef CAS.
- T. V. T. P. Van Thinh and T. D. N. L. G. Bach, Preparation of graphene oxide-XFe2O4 (X = Co, Mn, Ni) nanocomposites and their application in adsorption organic dye from aqueous solution, J. Mater. Sci. Surf. Eng., 2017, 5, 619–621 Search PubMed.
- G. Gorgolis and C. Galiotis, Graphene aerogels: a review, 2D Mater., 2017, 4, 032001 CrossRef.
- Z. Wang, J. Guo, J. Ma and L. Shao, Highly regenerable alkali-resistant magnetic nanoparticles inspired by mussels for rapid selective dye removal offer high-efficiency environmental remediation, J. Mater. Chem. A, 2015, 3, 19960–19968 RSC.
- H. R. Rajabi, H. Arjmand, H. Kazemdehdashti and M. Farsi, A comparison investigation on photocatalytic activity performance and adsorption efficiency for the removal of cationic dye: quantum dots vs. magnetic nanoparticles, J. Environ. Chem. Eng., 2016, 4, 2830–2840 CrossRef CAS.
- M. Faraji, M. Shabanian and F. Aryanasab, Efficient removal of anionic dyes from aqueous media using newly in situ synthesized triazine-based nitrogen-rich network-modified magnetic nanoparticles, J. Iran. Chem. Soc., 2018, 15, 733–741 CrossRef CAS.
- H. V. Tran, L. T. Bui, T. T. Dinh, D. H. Le, C. D. Huynh and A. X. Trinh, Graphene oxide/Fe3O4/chitosan nanocomposite: a recoverable and recyclable adsorbent for organic dyes removal. Application to methylene blue, Mater. Res. Express, 2017, 4, 035701 CrossRef.
- Y. H. Chang, Y. F. Yao, H. Luo, L. Cui and L. J. Zhi, Magnetic Fe3O4-GO nanocomposites as highly efficient Fenton-like catalyst for the degradation of dyes, Int. J. Nanomanuf., 2014, 10, 132–141 CrossRef CAS.
- D. Shan, S. Deng, C. Jiang, Y. Chen, B. Wang, Y. Wang, J. Huang, G. Yu and M. R. Wiesner, Hydrophilic and strengthened 3D reduced graphene oxide/nano-Fe3O4 hybrid hydrogel for enhanced adsorption and catalytic oxidation of typical pharmaceuticals, Environ. Sci.: Nano, 2018, 5, 1650–1660 RSC.
- T. Peik-See, A. Pandikumar, L. H. Ngee, H. N. Ming and C. C. Hua, Magnetically separable reduced graphene oxide/iron oxide nanocomposite materials for environmental remediation, Catal. Sci. Technol., 2014, 4, 4396–4405 RSC.
- P. V. Nidheesh, R. Gandhimathi and S. T. Ramesh, Degradation of dyes from aqueous solution by Fenton processes: a review, Environ. Sci. Pollut. Res., 2013, 20, 2099–2132 CrossRef CAS.
- N. Singh, S. Riyajuddin, K. Ghosh, S. K. Mehta and A. Dan, Chitosan-graphene oxide hydrogels with embedded magnetic iron oxide nanoparticles for dye removal, ACS Appl. Nano Mater., 2019, 2, 7379–7392 CrossRef CAS.
- G. U. Rehman, A. Ismail, P. Goh, M. R.-D. Arzhandi and N. Ismail, Aptes and teos modified binary recyclable hybrid Fe3O4@GO nanocomposite for photocatalytic dye removal, J. Teknol., 2018, 80, 157–164 Search PubMed.
- X. Yang, W. Chen, J. Huang, Y. Zhou, Y. Zhu and C. Li, Rapid degradation of methylene blue in a novel heterogeneous Fe3O4@rGO@TiO2-catalyzed photo-Fenton system, Sci. Rep., 2015, 5, 10632 CrossRef.
- Y. Feng, T. Yao, Y. Yang, F. Zheng, P. Chen, J. Wu and B. Xin, One-step preparation of Fe2O3/reduced graphene oxide aerogel as heterogeneous Fenton-like catalyst for enhanced photo-degradation of organic dyes, ChemistrySelect, 2018, 3, 9062–9070 CrossRef CAS.
- Y. Li, R. Zhang, X. Tian, C. Yang and Z. Zhou, Facile synthesis of Fe3O4 nanoparticles decorated on 3D graphene aerogels as broad-spectrum sorbents for water treatment, Appl. Surf. Sci., 2016, 369, 11–18 CrossRef CAS.
- C. Hu, Z. Mou, G. Lu, N. Chen, Z. Dong, M. Hu and L. Qu, 3D graphene–Fe3O4 nanocomposites with high-performance microwave absorption, Phys. Chem. Chem. Phys., 2013, 15, 13038–13043 RSC.
- Y. Ye, D. Yin, B. Wang and Q. Zhang, Synthesis of three-dimensional Fe3O4/graphene aerogels for the removal of arsenic ions from water, J. Nanomater., 2015, 2015, 1–6 CrossRef.
- X. Liu, J. Li, J. Sun and X. Zhang, 3D Fe3O4 nanoparticle/graphene aerogel for NO2 sensing at room temperature, RSC Adv., 2015, 5, 73699–73704 RSC.
- B. Qiu, Q. Li, B. Shen, M. Xing and J. Zhang, Stöber-like method to synthesize ultradispersed Fe3O4 nanoparticles on graphene with excellent Photo-Fenton reaction and high-performance lithium storage, Appl. Catal., B, 2016, 183, 216–223 CrossRef CAS.
- A. H. Gonçalves, P. H. Siciliano, O. C. Alves, D. V. Cesar and C. A. Henriques, A. B. Gaspar, Synthesis of a magnetic Fe3O4/RGO composite for the rapid photo-Fenton discoloration of indigo carmine dye, Topics in Catalysis, ed. H.-J. Freund and G. Somorjai, Springer, 2020, DOI:10.1007/s11244-020-01277-0.
- G. M. Shaul, T. J. Holdsworth, C. R. Dempsey and K. A. Dostal, Fate of water soluble azo dyes in the activated sludge process, Chemosphere, 1991, 22, 107–119 CrossRef CAS.
- C. H. C. Tan, S. Sabar and M. H. Hussin, Development of immobilized microcrystalline cellulose as an effective adsorbent for methylene blue dye removal, S. Afr. J. Chem. Eng., 2018, 26, 11–24 Search PubMed.
- M. Dahiru, Z. U. Zango and M. A. Haruna, Cationic dyes removal using low-cost banana peel biosorbent, Am. J. Mater. Sci., 2018, 8, 32–38 Search PubMed.
- N. Ormategui, A. Veloso, G. P. Leal, S. Rodriguez-Couto and R. Tomovska, Design of stable and powerful nanobiocatalysts, based on enzyme laccase immobilized on self-assembled 3D graphene/polymer composite hydrogels, ACS Appl. Mater. Interfaces, 2015, 7, 14104–14112 CrossRef CAS.
- N. Toshikj, N. Politakos, A. Veloso, E. G. de San Román, T. Cordero-Lanzac, Z. Qin, G. P. Leal and R. Tomovska, Visible light photocatalysts based on manganese doped TiO2 integrated within monolithic reduced graphene oxide/polymer porous monolith, ChemistrySelect, 2020, 5, 5873–5882 CrossRef CAS.
- F. J. Sotomayor, K. A. Cychosz, M. Thommes and F. Sotomayor, Characterization of micro/mesoporous materials by physisorption: concepts and case studies, Acc. Mater. Surf. Res., 2018, 3, 34–50 Search PubMed.
- D. Lee, O.-S. Kwon and S. H. Song, Tailoring the performance of magnetic elastomers containing Fe2O3 decorated carbon nanofiber, RSC Adv., 2017, 7, 45595–45600 RSC.
- A. Bhatnagar, S. K. Pandey, A. K. Vishwakarma, S. Singh, V. Shukla, P. K. Soni, M. Shaz and O. Srivastava, Fe3O4@graphene as a superior catalyst for hydrogen de/absorption from/in MgH2/Mg, J. Mater. Chem. A, 2016, 4, 14761–14772 RSC.
- Y. Hua, S. Wang, J. Xiao, C. Cui and C. Wang, Preparation and characterization of Fe3O4/gallic acid/graphene oxide magnetic nanocomposites as highly efficient Fenton catalysts, RSC Adv., 2017, 7, 28979–28986 RSC.
- X. Jiang, L. Li, Y. Cui and F. Cui, New branch on old tree: green-synthesized RGO/Fe3O4 composite as a photo-Fenton catalyst for rapid decomposition of methylene blue, Ceram. Int., 2017, 43, 14361–14368 CrossRef CAS.
- H.-Y. Xu, Y. Wang, T.-N. Shi, X.-L. He and S.-Y. Qi, Process optimization on methyl orange discoloration in Fe3O4/RGO-H2O2 Fenton-like system, Water Sci. Technol., 2018, 77, 2929–2939 CrossRef CAS.
- W. Wang, Q. He, K. Xiao and L. Zhu, Electrostatic self-assembly of Fe3O4/GO nanocomposites and their application as an efficient Fenton-like catalyst for degradation of rhodamine B, Mater. Res. Express, 2018, 5, 035510 CrossRef.
- X. Florenza, A. M. S. Solano, F. Centellas, C. A. Martínez-Huitle, E. Brillas and S. Garcia-Segura, Degradation of the azo dye Acid Red 1 by anodic oxidation and indirect electrochemical processes based on Fenton's reaction chemistry. Relationship between decolorization, mineralization and products, Electrochim. Acta, 2014, 142, 276–288 CrossRef CAS.
- N. A. Zubir, C. Yacou, J. Motuzas, X. Zhang and J. C. D. Da Costa, Structural and functional investigation of graphene oxide–Fe3O4 nanocomposites for the heterogeneous Fenton-like reaction, Sci. Rep., 2014, 4, 4594 CrossRef.
- I. Lyubutin, A. Baskakov, S. Starchikov, K.-Y. Shih, C.-R. Lin, Y.-T. Tseng, S.-S. Yang, Z.-Y. Han, Y. L. Ogarkova and V. Nikolaichik, Synthesis and characterization of graphene modified by iron oxide nanoparticles, Mater. Chem. Phys., 2018, 219, 411–420 CrossRef CAS.
- B. Das, B. Choudhury, A. Gomathi, A. K. Manna, S. Pati and C. Rao, Interaction of inorganic nanoparticles with graphene, ChemPhysChem, 2011, 12, 937–943 CrossRef CAS.
- M.-h. Zhang, H. Dong, L. Zhao, D.-x. Wang and D. Meng, A review on Fenton process for organic wastewater treatment based on optimization perspective, Sci. Total Environ., 2019, 670, 110–121 CrossRef CAS.
Footnote |
| † Electronic supplementary information (ESI) available. See DOI: 10.1039/d0ra06311h |
| This journal is © The Royal Society of Chemistry 2020 |

