 Open Access Article
Sulphur-doped activated carbon as a metal-free catalyst for acetylene hydrochlorination
Xueyan Qi *ab,
Weifeng Chenc and
Jinli Zhang
 *b
*b
aCollege of Materials Science and Engineering, Hebei University of Engineering, Handan 056038, Hebei, PR China. E-mail: qixueyan001@163.com
bSchool of Chemical Engineering and Technology, Tianjin University, Tianjin 300072, PR China. E-mail: zhangjinli@tju.edu.cn
cThe 718th Research Institute of China Shipbuilding Heavy Industry Corporation, Handan 056027, Hebei, PR China. E-mail: chen228@tju.edu.cn
First published on 18th September 2020
Abstract
A series of sulfur-doped spherical activated carbon (SAC) catalysts were prepared with phenyl disulfide (C12H10S2) as a sulfur source for acetylene hydrochlorination. The S-doped catalyst exhibits preferable catalytic performance compared to that of the blank carrier with the reaction conditions of GHSV of 90 h−1 and at 180 °C. The catalysts were characterized by N2 adsorption/desorption (BET), elemental analysis (EA), thermogravimetric analysis (TG), temperature-programmed desorption (TPD), Raman spectrum (Raman) and X-ray photoelectron spectroscopy (XPS). The results indicate that the presence of sulfur species is favorable to promote the ability of reactant adsorption and inhibit carbon deposition. In addition, the electronic and chemical properties of catalysts were investigated by density functional theory (DFT) simulation. It is illustrated that the introduction of sulfur species can not only change the spin density and charge density but also create more active sites on a carrier. The single sulfur doped carbon material catalysts were designed for the first time and the desirable results make it a green catalyst for the industrial application of acetylene hydrochlorination.
1. Introduction
Mercury chloride is the efficient catalyst used for acetylene hydrochlorination for the production of vinyl chloride monomers in China. However, the mercury based catalysts cause environmental problems and are toxic to human beings. Therefore, it is urgent and indispensable to explore environment friendly non-mercury catalysts to replace HgCl2 catalysts for acetylene hydrochlorination.It is worth mentioning that the noble metal chloride catalysts were investigated in the past decades for the reaction, with significant results achieved.1–9 Au-based catalysts and Ru-based catalysts have attracted considerable research attention due to the superior catalytic activity for acetylene hydrochlorination. On the other hand, the noble metal catalysts are also facing serious challenges for the reason of high price, poor stability, and limited storage which hampered industrial application. Therefore, the heteroatom-doped carbon catalysts have been studied by many investigation groups.
The p-block elements of N, B, P, or S create electron-donating or electron-accepting sites on carbon materials due to the induction of a redistribution of p-electrons, which influence the adsorption properties on the carbon-based catalysts. In recent years, N-doped carbon materials have been widely studied as metal-free catalysts for acetylene hydrochlorination reaction. The group of Bao10 investigated a nanocomposite of nitrogen-doped carbon derived from silicon carbide (SiC@N–C) as catalyst, which exhibited considerable performance during a 150 hour test. Li et al. prepared11 g-C3N4/AC catalyst which displays excellent catalytic performance and revealed that the nitrogen atom of the g-C3N4/AC catalyst is the active site for the HCl. Although N-doped carbon material has superiority catalytic activity, it still cannot be compared with Au-based catalysts. The dual doping strategy was investigated to improve the N-doped carbon catalytic activity for acetylene hydrochlorination by many excellent research groups.
Dai et al. reported12 that N, B dually doped graphene and the catalyst could promote HCl adsorption, which showed a catalytic activity that was little lower than Au-based catalyst. Li's group13 proposed the co-doped carbon catalyst by the doping element of sulfur and nitrogen, that the introduction of sulfur improved the pyridinic N content effectively in N-doped carbon material. Zhu et al. investigated14 the sulphur and nitrogen dual-doped carbon catalyst, the presence of sulphur enhanced the catalytic activity of catalyst for the synergistic effect between S and N.
Overall, the interaction between N and S inspired us to research the effect of only S-doped carbon materials for the reaction. Diphenyl disulfide has a relatively simple structure and two S atoms in the molecule are covalently linked. In consideration of the doping of sulfur in activated carbon, there is no obstacle for the doping process due to the presence of two benzene rings. Herein, we selected diphenyl disulfide as the sulfur source to modified activated carbon and designed sulfur-doped carbon catalysts, combined with the DFT simulation method to study the effect of S species on the catalyst.
2. Experimental
2.1. Material
Phenyl disulfide (C12H10S2) was purchased from Beijing Bailingwei Technology Development Co., Ltd. Pitch-based spherical activated carbon (marked as SAC, 20–40 mesh) was purchased from Shanghai Huiheda Investment Management Co., Ltd. Ethanol (purity 99.7%) and sodium hydroxide (purity 96%) were purchased from Tianjin Guangfu Fine Chemical Research Institute. The reaction gas (HCl and C2H2, purity all about 99.99%) were purchased from Tianjin Dongxiang Special Gas Co., Ltd. All of the materials were used without further purification.2.2. Catalyst preparation
A certain amount of SAC was roasted at a heating rate of 5 °C min−1 ranging from 25 °C to 800 °C in an Ar atmosphere for 120 min and then dropped down to room temperature, the final sample denoted as B-SAC. Phenyl disulfide (1 g) was dissolved in ethanol solution (20 ml) and then the solution was dropwise added into 10 g B-SAC with stirring. After that, the mixture was set aside for 12 h in room temperature, followed by evaporation at 60 °C for 12 h and desiccation at 120 °C for 12 h. The sample was calcined at particular temperature (600 °C, 700 °C, 800 °C and 900 °C, respectively) for 2 h at the heating rate of 5 °C min−1 under flowing Ar to finally obtain the catalysts, denoted as 3% S/B-SAC (600), 3% S/B-SAC (700), 3% S/B-SAC (800), 3% S/B-SAC (900), respectively. On the other hand, the catalysts with different loading content of phenyl disulfide were prepared by using the same method. The obtained catalysts were denoted as 6% S/B-SAC (800), 9% S/B-SAC (800), 12% S/B-SAC (800), respectively.2.3. Catalyst characterization
Brunauer–Emmett–Teller (BET) specific surface areas were measured by using a Quantachrome Autosorb Automated Gas Sorption System (Quantachrome Instruments, USA). The catalysts were degassed at 300 °C for 4 h and then analyzed via liquid nitrogen adsorption at −196 °C.Thermogravimetric analysis (TGA) of samples was investigated using a TG-DTA 2 thermal analyzer (METTLER TOLEDO, Switzerland). The sample was heated from 35 °C to 900 °C with a heating rate of 10 °C min−1 under the air atmosphere.
Elemental Analysis (EA) was conducted using a Vario Micro analysis instrument. Raman spectra were measured using a DXR Raman micro-scope (DXR microscope, Thermo Fisher, USA) with the He–Ne laser emitter at wavelength of 633 nm.
Temperature-programmed desorption (TPD) was performed using an AutoChem BET TPR/TPD (Quantachrome Instruments AMI-90). The samples (150 mg) were treated under pure C2H2, HCl and C2H3Cl gas at 180 °C for 4 h. The obtained samples were performed on the instrument over the temperature range 30–900 °C with a heating rate of 10 °C min−1 and a He flow rate of 25 ml min−1.
X-ray photoelectron spectroscopy (XPS) was carried out on a Thermo ESCALAB 250Xl (Thermo Fisher Scientific, USA), with the C 1s peak at 284.4 eV as the internal standard.
2.4. Catalyst tests
The catalyst performance evaluation was carried out in a fixed-bed microreactor (i.d. of 10 mm). A CKW-1100 temperature controller (Chaoyang Automation Instrument Factory, Beijing, China) was used to regulate the temperature of the reaction. The reactor was purged into an appropriate amount of nitrogen to remove the air and water in the system before the reaction. Hydrogen chloride gas was passed through the heating reactor to activate the catalyst (3.0 ml) with the temperature of 150 °C and the flow rate of 25 ml min−1 for 30 min. Subsequently, the HCl and C2H2 with a molar ratio of 1.1 were fed through the reactor vessel, producing a gas hourly space velocity (GHSV, C2H2) of 90 h−1 under the reaction temperature of 180 °C. The exit gas mixture was passed through an absorption bottle containing NaOH solution, followed by the analysis using a Beifen 3420A gas chromatograph.3. Results and discussion
3.1. Performance of S-doped carbon catalysts
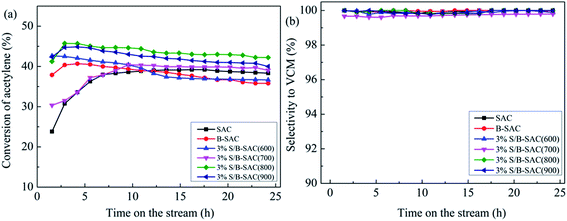
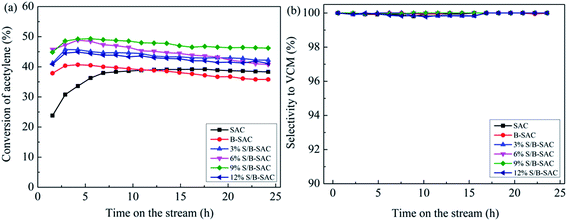
The catalytic activities of the obtained catalysts have been evaluated under the same condition. First, the evaluation results of the 3% S-doped catalysts under the treatment condition with different calcination temperature were shown in Fig. 1(a). As the reference sample, B-SAC shows an initial acetylene conversion of 40% and decreases to 35% after 24 h reaction. Compared with B-SAC, the C2H2 conversion of S-doped catalysts was improved with different degree. 3% S/B-SAC (800) exhibits the most favorable catalytic activity with the acetylene conversion of 47%, which still maintain at 42% after 24 h. As for 3% S/B-SAC (600), 3% S/B-SAC (700) and 3% S/B-SAC (900), acetylene conversion of 36%, 38% and 39% were achieved after 24 h reaction, respectively. The selectivity to vinyl chloride over all the catalysts is higher than 99% (Fig. 1(b)). The result indicates that the catalytic activity increases until the increasing of calcination temperature at 800 °C. The 3% S/B-SAC (900) catalyst shows lower acetylene conversion than that of 3% S/B-SAC (800) catalyst. It may be due to higher calcination temperature resulting in the collapse of pore, which covering the active sites. To sum up, the optimum calcination temperature is 800 °C.The catalytic performance of the catalysts with different sulfur contents are shown in Fig. 2(a). There is no regular variation of C2H2 conversion for all S-doped catalysts. Over 3% S/B-SAC, 6% S/B-SAC, 9% S/B-SAC and 12% S/B-SAC catalysts, the acetylene conversion is respectively 45%, 48%, 50% and 44% at 5 h, whereas it decreases to 42%, 41%, 46% and 41% after 24 h. It can be seen that 9% S/B-SAC catalyst exhibits the optimal activity, indicating that the S-doped carbon catalyst can suitable for the metal-free catalysts used in the acetylene hydrochlorination reaction. For comparing the catalytic activity with that of the considerable sulphur and nitrogen dual-doped carbon catalysts, we list the detail contents in Table 1. Both of the two N and S dual-doped carbon catalysts exhibit preferable catalytic activity. The 9% S/B-SAC catalyst also shows excellent activity at relatively lower reaction temperature and higher GHSV condition. In addition, it is worth mentioning that the acetylene conversion only reduced by approximately 2% after 9 h, 4% after 24 h of reaction for 9% S/B-SAC catalyst. It can be seen that S-doped carbon catalyst has better stability for the reaction.
3.2. Catalyst characterization
| Catalyst | SBET (m2 g−1) | Total pore volume (cm3 g−1) | ||
|---|---|---|---|---|
| Fresh | Used | Fresh | Used | |
| SAC | 1149 | 1077 | 0.661 | 0.627 |
| B-SAC | 830 | 755 | 0.352 | 0.328 |
| 3% S/B-SAC | 722 | 679 | 0.321 | 0.304 |
| 6% S/B-SAC | 659 | 607 | 0.302 | 0.275 |
| 9% S/B-SAC | 589 | 556 | 0.273 | 0.256 |
| 12% S/B-SAC | 524 | 482 | 0.229 | 0.207 |
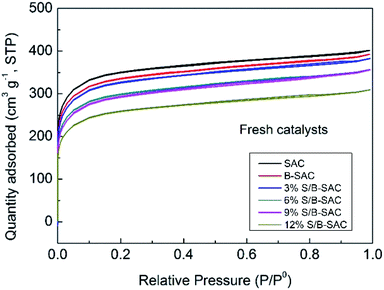
As listed in Table 2, the specific surface areas and total pore volumes of the fresh S-doped catalysts decrease with the increasing of sulfur doping content. The phenomenon is caused by the dilution effect, the more pores of supports are filled or blocked after the more loading active species.15 By observing the pore structure data between the fresh and used catalysts, the variation trend of the specific surface areas and the total pore volume of the catalysts are shown below. The variation trend of the specific surface areas (ΔSBET %) of the catalysts are following the order: 12% S/B-SAC (8.0) > 6% S/B-SAC (7.8) > 3% S/B-SAC (5.9) > 9% S/B-SAC (5.6). The changes of the total pore volume (ΔVtotal %) show the same trend in the following order: 12% S/B-SAC (9.6) > 6% S/B-SAC (9.2) > 3% S/B-SAC (6.2) > 9% S/B-SAC (6.0). For the results, the variation of the BET data and the activity may be due to the collapse of pore structure or carbon deposition on the catalysts during the reaction.
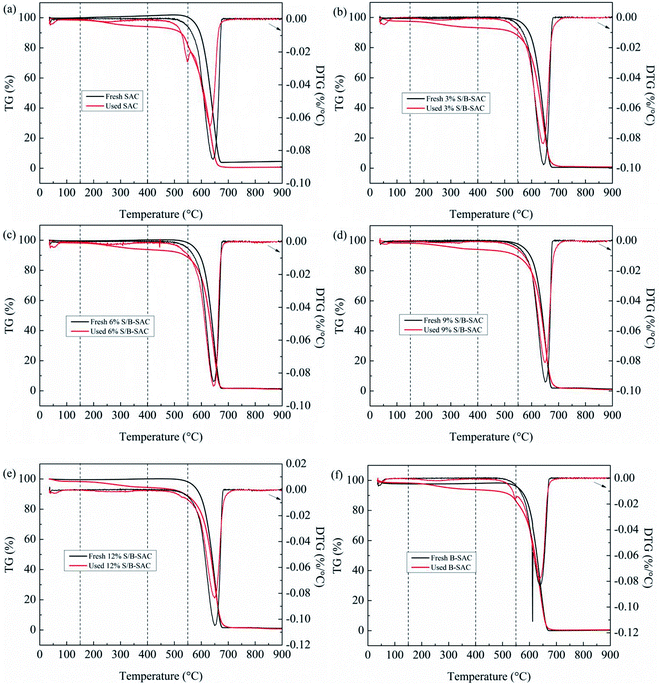
TGA was performed to evaluate the amount of coke deposition on the surface of the used catalysts. As seen in Fig. 4, all of the catalysts have a slight weight loss before 150 °C, due to very little water existing on the surface of the fresh and used samples. For the 3% S/B-SAC sample (Fig. 4b), the fresh catalyst shows the weight loss of 1%, whereas, there is apparent weight loss of 9.4% for the used catalyst during the temperature range of 150–500 °C. The significant change of the mass loss for the fresh and used catalyst is attributed to carbon deposition combustion. At the temperature higher than 500 °C, both of the fresh and used 3% S/B-SAC show rapid weight loss due to the combustion of activated carbon. All the other catalysts have the same variation tendency in mass compare to the 3% S/B-SAC catalyst in the same temperature range.
In order to obtain coke deposition of every sample, the previous calculation method16 is adopted and the computed consequences are listed in Table 3. The relative amount of deposited coke is following the order: 9% S/B-SAC (7.8) < 6% S/B-SAC (8.2) < 3% S/B-SAC (8.4) < 12% S/B-SAC (8.8). Combining with the BET results, it is concluded that the doping of sulfur in the activated carbon can inhibit the formation of coke deposition and subsequently enhance the catalytic activity.
| Catalysts | Amount of carbon deposition (%) |
|---|---|
| SAC | 16 |
| B-SAC | 10 |
| 3% S/B-SAC | 8.4 |
| 6% S/B-SAC | 8.2 |
| 9% S/B-SAC | 7.8 |
| 12% S/B-SAC | 8.8 |
| Sample | Bulk content (wt%) | |||
|---|---|---|---|---|
| C | H | N | S | |
| SAC | 96.30 | 0.964 | 0.27 | 0.16 |
| B-SAC | 96.91 | 0.950 | 0.29 | 0.15 |
| 3% S/B-SAC | 95.80 | 0.865 | 0.28 | 0.40 |
| 6% S/B-SAC | 96.06 | 0.837 | 0.30 | 0.80 |
| 9% S/B-SAC | 95.57 | 0.796 | 0.33 | 1.29 |
| 12% S/B-SAC | 94.12 | 0.752 | 0.28 | 1.87 |
| Used SAC | 92.64 | 1.077 | 0.28 | 0.12 |
| Used B-SAC | 91.72 | 1.061 | 0.28 | 0.11 |
| Used 3% S/B-SAC | 91.44 | 1.019 | 0.28 | 0.36 |
| Used 6% S/B-SAC | 91.26 | 0.981 | 0.28 | 0.69 |
| Used 9% S/B-SAC | 90.30 | 0.962 | 0.33 | 1.08 |
| Used 12% S/B-SAC | 90.62 | 0.950 | 0.27 | 1.65 |
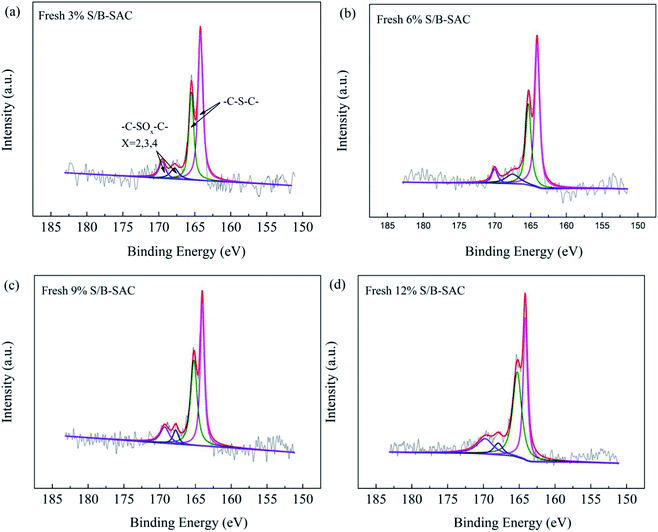
Further, XPS was carried out to identify the chemical states and the types of sulfur active species for S-doped carbon catalysts. As shown in Fig. 5 and Table 5, the XPS S 2p was deconvoluted into two different sulfur species, the peak at 164–166 eV and 167–170 eV correspond to C–S–C and C–SOx–C (x = 2, 3, 4), respectively.17
| Catalyst | –C–S–C (eV) | –C–S–C (%) | |
|---|---|---|---|
| Fresh 3% S/B-SAC | 164.2 | 165.4 | 75.36 |
| Fresh 6% S/B-SAC | 164.0 | 165.2 | 83.66 |
| Fresh 9% S/B-SAC | 164.0 | 165.2 | 85.19 |
| Fresh 12% S/B-SAC | 164.1 | 165.2 | 79.49 |
| –C–SOx–C (x = 2, 3, 4) (eV) | –C–SOx–C (%) | ||
|---|---|---|---|
| Fresh 3% S/B-SAC | 167.8 | 169.8 | 24.64 |
| Fresh 6% S/B-SAC | 167.8 | 170.0 | 16.34 |
| Fresh 9% S/B-SAC | 167.7 | 169.7 | 14.81 |
| Fresh 12% S/B-SAC | 167.9 | 169.7 | 20.51 |
Table 5 shows the binding energies and the relative amounts of sulfur species clearly, for the 3% S/B-SAC catalyst, the relative amount of C–S–C species is 75.36% and C–SOx–C species is 24.64%. It can be found that the content of C–S–C species is increased with the increasing of sulfur precursor content. The 9% S/B-SAC catalyst contains C–S–C species of 85.19% and C–SOx–C species of 14.81%, which has the maximum content of C–S–C species. Combing with the active data of catalysts, it can be speculated that the sulfur species of C–S–C could be the catalytic active site for the reaction. For the previous study, oxidize sulfur can be converted to sulfide under the treatment condition of calcinations for carbon materials. Due to the close electroneutrality for sulfur and carbon, the C–S bonds are predominately at the edge or the defect sites and the presence of defect sites promotes the reaction.18
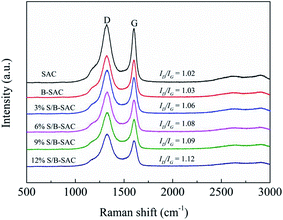
To further elucidate the correlations among the existence form of sulfur and catalytic activity, and ensure the catalytic active sites of the catalyst, the Raman spectroscopy was analyzed. The consequences are shown in Fig. 6, the ID/IG value of the S-doped carbon catalysts increases with increasing doping amount of sulfur. It can be illustrated that the S replaced C on the surface of carbon and created more defect sites.18 Combing with the analysis results of XPS, we speculate that the C–S bond should be an important catalytic active site for promoting acetylene hydrochlorination.
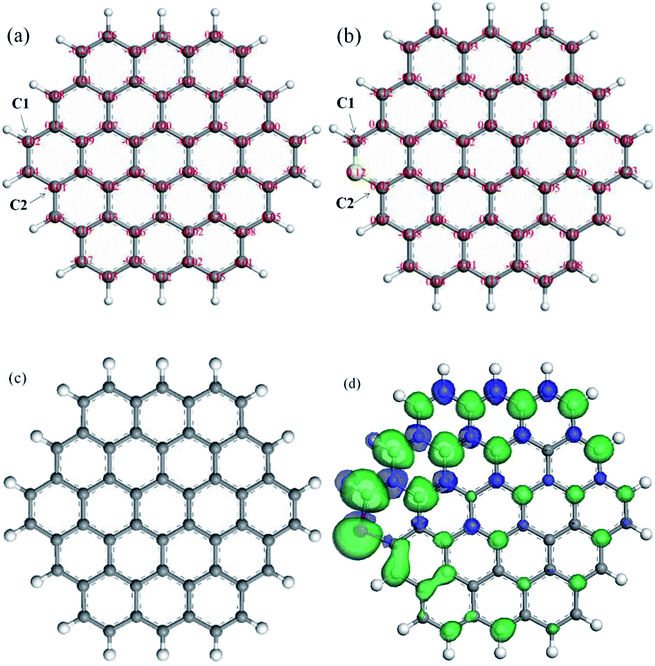
Zhang et al. reported19 that the spin density should be more important in determining the catalytic active sites, which can be studied by density functional theory (DFT). Therefore, the method of DFT simulation is adopted to investigate the influence of sulfur doping on electronic and chemical properties of carbon. The on-site Bader charge of undoped and doped model carbon layer are exhibited in Fig. 7(a) and (b). After the replacement of C atom to S atom on the edge of the activated carbon layer, the two C atoms, which is adjacent to S atom is named C1 and C2. The electric charge density of C1 and C2 is −0.02 and −0.01 for the undoped model carbon layer, respectively. For the doped model carbon layer, the electric charge density of C1 and C2 is −0.38 and 0.02, respectively. The doping of S on carbon can change charge density and broken the chemical inertia to a certain extent of carrier, which promotes the electron transfer between carrier surface and reactants. Fig. 7(c) and (d) show the spin density isosurface of undoped and doped model carbon layer. It can be observed clearly that the C atom adjacent to S atom on the doped model carbon layer exhibits obvious variation of spin density, which compares with that of the undoped model carbon layer. Zhang et al. reported19 that S-doped carbon materials would induce a larger spin and charge density to neighboring carbon and create more active sites of the ORR reaction. Combined with the DFT simulation results, we believe that S-doped carbon catalyst promotes the reaction and the C–S bond at the edge or the defect sites is the active sites for acetylene hydrochlorination.
| Catalyst | Desorption area | Desorption temperature (°C) |
|---|---|---|
| SAC | 2215.8 | 355 |
| B-SAC | 2595.9 | 356 |
| 9% S/B-SAC | 3141.2 | 371 |
| Catalyst | Desorption area | Desorption temperature (°C) |
|---|---|---|
| SAC | 29![[thin space (1/6-em)]](https://www.rsc.org/images/entities/char_2009.gif) 188.4 188.4 |
134 |
| B-SAC | 29![[thin space (1/6-em)]](https://www.rsc.org/images/entities/char_2009.gif) 499.7 499.7 |
128 |
| 9% S/B-SAC | 28![[thin space (1/6-em)]](https://www.rsc.org/images/entities/char_2009.gif) 645.0 645.0 |
128 |
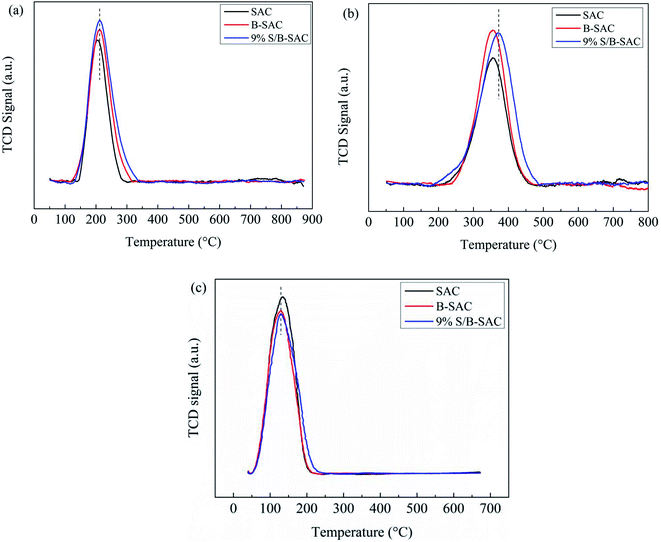
The detail results are listed in Table 6. It can be illustrated that the doping of sulfur on carbon enhancing the ability of hydrogen chloride adsorption. Fig. 8(c) shows the VCM-TPD profiles of the fresh SAC, B-SAC and 9% S/B-SAC catalysts. The VCM area of the 9% S/B-SAC catalyst is measured to be less than that of the other samples and the concrete results are shown in Table 7. In summary, the doping of sulfur on carbon not only enhances the adsorption of the reactants, but also promotes desorption of VCM product.
4. Conclusions
In summary, a series S-doped catalyst were prepared and applied in acetylene hydrochlorination. The 9% S/B-SAC catalyst exhibited obvious catalytic performance, compared to the blank carrier with the conditions of GHSV (C2H2) of 90 h−1 and at 180 °C. The presence of sulfur species inhibited the formation of coke deposition and enhanced the ability of reactants adsorption. The characterizations indicated that the C–S bond at the edge or the defect sites was the active sites for the reaction. The study of DFT showed that the doping of S on carbon changed charge density and broken the chemical inertness to a certain extent of carrier, which promoted the electron transfer between carrier surface and reactants. Finally, it is the first report of single sulfur doping activated carbon to catalytic acetylene hydrochlorination. The desirable results are expected to encourage further investigation of S-doped catalysts by changing the source of sulfur or doping with other heteroatom.Conflicts of interest
There is no conflicts to declare.Acknowledgements
We gratefully acknowledge the financial supported by the Major State Basic Research Development Program (No. 2012CB720302) and NSFC (21176174).References
- G. J. Hutchings, J. Catal., 1985, 96, 292 CrossRef CAS.
- M. Conte, A. F. Carley, G. Attard, A. A. Herzing, C. J. Kiely and G. J. Hutchings, J. Catal., 2008, 257, 190–198 CrossRef CAS.
- K. Zhou, W. Wang, Z. Zhao, G. Luo, J. T. Miller, M. Wong and F. Wei, ACS Catal., 2014, 4, 3112 CrossRef CAS.
- H. Zhang, B. Dai, W. Li, X. Wang, J. Zhang, M. Zhu and J. Gu, J. Catal., 2014, 316, 141–148 CrossRef CAS.
- P. Johnston, N. Carthey and G. J. Hutchings, J. Am. Chem. Soc., 2015, 137, 14548–14557 CrossRef CAS.
- X. Qi, W. Li, J. Gu, C. Guo and J. Zhang, RSC Adv., 2016, 6, 105110–105118 RSC.
- J. Zhao, S. Gu, X. Xu, T. Zhang, Y. Yu, X. Di, J. Ni, Z. Pan and X. Li, Catal. Sci. Technol., 2016, 6, 3263–3270 RSC.
- S. Shang, W. Zhao, Y. Wang, X. Li, J. Zhang, Y. Han and W. Li, ACS Catal., 2017, 7, 3510–3520 CrossRef CAS.
- Z. Zhao, M. Li, L. Zhang, L. Dai and Z. Xia, Adv. Mater., 2015, 27, 6834–6840 CrossRef CAS.
- X. Li, X. Pan, Y. Liang, P. Ren, X. Wu, L. Sun, F. Jiao and X. Bao, Nat. Commun., 2014, 5(1), 1–7 Search PubMed.
- X. Li, Y. Wang, L. Kang, M. Zhu and B. Dai, J. Catal., 2014, 311, 288–294 CrossRef CAS.
- B. Dai, K. Chen, Y. Wang, L. Kang and M. Zhu, ACS Catal., 2015, 5, 2541–2547 CrossRef CAS.
- X. Dong, S. Chao, F. Wan, Q. Guan, G. Wang and W. Li, J. Catal., 2018, 359, 161–170 CrossRef CAS.
- J. Wang, F. Zhao, C. Zhang, L. Kang and M. Zhu, Appl. Catal., A, 2018, 549, 68–75 CrossRef CAS.
- H. Zhang, B. Dai, X. Wang, W. Li, Y. Han, J. Gu and J. Zhang, Green Chem., 2013, 15, 829 RSC.
- B. Nkosi, M. D. Adams, N. J. Coville and G. J. Hutchings, J. Catal., 1991, 128(2), 378–386 CrossRef CAS.
- H. C. Chang, H. P. Sung and I. W. Seong, Green Chem., 2011, 13, 406 RSC.
- Z. Yang, Z. Yao, G. Li, G. Feng, H. Nie, Z. Liu, X. Zhou, X. Chen and S. Huang, ACS Nano, 2012, 6(1), 205–211 CrossRef CAS.
- L. Zhang, J. Niu, M. Li and Z. Xia, J. Phys. Chem. C, 2014, 118, 3545–3553 CrossRef CAS.
| This journal is © The Royal Society of Chemistry 2020 |

