 Open Access Article
A reclaimed piezoelectric catalyst of MoS2@TNr composites as high-performance anode materials for supercapacitors†
Xiaona Zhaoab,
Yuanchao Leia,
Gang Liua,
Libing Qiana,
Xiaowei Zhanga,
Yunjie Pinga,
Hongjing Lia,
Qing Hana,
Pengfei Fang *a and
Chunqing He
 a
a
aSchool of Physics and Technology, Key Laboratory of Nuclear Solid State Physics Hubei Province, Wuhan University, Wuhan 430072, China. E-mail: fangpf@whu.edu.cn; Fax: +86 27 6875 2003; Tel: +86 27 6875 2003
bSchool of Remote Sensing and Information Engineering, Wuhan University, Wuhan 430072, China
First published on 22nd October 2020
Abstract
A piezoelectric catalyst of the MoS2@TNr composite (MoS2 nanosheets composited with TiO2 nanorods) was synthesized by a two-step hydrothermal method, and can be recycled and reused as an advanced anode material for supercapacitors. In the dark, the MoS2@TNr composite exhibited ultra-fast piezoelectric catalytic performance and good cycle stability on dye degradation; within 10 min, nearly all rhodamine B (50 mL, 20 ppm) was removed from the solution with the assistance of magnetic stirring. After the 5 cycle degradation reaction, the catalyst was reclaimed and applied to electrochemical testing, which showed better supercapacitor capacitance properties than the fresh catalyst due to the introduction of oxygen vacancies generated from the piezoelectric degradation process. The reclaimed catalyst demonstrated an excellent specific capacitance of 249 F g−1 at 1 A g−1, and 92% capacitance retention after 10![[thin space (1/6-em)]](https://www.rsc.org/images/entities/char_2009.gif) 000 cycles. Furthermore, as the current density increased to 30 A g−1, the capacitance could maintain 58% of the initial value. Thus, it can be concluded that the abandoned catalysts may serve as a potential electrode material for energy storage; simultaneously, the reutilization could eliminate secondary pollution and decrease the energy consumption in efficiency.
000 cycles. Furthermore, as the current density increased to 30 A g−1, the capacitance could maintain 58% of the initial value. Thus, it can be concluded that the abandoned catalysts may serve as a potential electrode material for energy storage; simultaneously, the reutilization could eliminate secondary pollution and decrease the energy consumption in efficiency.
1. Introduction
With the continuous depletion of fossil fuels, as well as the increasing global environmental pollution problems, the demand for renewable energy or new energy technology is becoming more and more urgent.1–4 Since the rapidly progressive development of human society urgently requires efficient, clean and sustainable energy, many researchers have tried to explore new techniques for energy conversion and storage. Nowadays, it is well known that capacitors and batteries are two of the most common energy storage devices, although the relatively low energy density of capacitors and the low power density of batteries, frequently limit their practical applications.5–8 Supercapacitors are potential candidates for energy storage devices, which have the potential to compensate for the gap between traditional capacitors and rechargeable batteries by virtue of their unique advantages such as high power density and energy density, long cycle life, safety and environmental friendliness.9–11 As such, there is no doubt that the supercapacitor will become one of the most promising energy storage devices in the near future, and it is worth mentioning that the key to improving the electrochemical performance of the supercapacitor is to develop a high-powered electrode material.In recent years, MoS2 nanomaterials, especially MoS2 nanosheets, have been considered among the most promising electrode materials for supercapacitors due to their great surface hydrophilicity and high electrical conductivity.12–14 However, MoS2 nanosheets, with single- or few-layers, which have abundant active sites located at the exposed edges, are quite unstable and agglomerate easily. They are not conducive to electron transfer among different layers that are connected by van der Waals forces so that in pure multilayer MoS2 nanosheets, the free electrons have to hop through each layer to reach to the active edge sites, which results in a much higher electron resistance, thus greatly weakening the electrochemical performance.14–17 Therefore, it is a necessary but challenging task to achieve stable prepared MoS2 nanomaterials via a suitable synthetic method. As discussed in previous works,18–24 to obtain edge-exposed ultra-thin MoS2 nanosheets, the growth of the MoS2 nanosheets is limited to the surface of TiO2 nanorods (TNr). As a substrate for the nucleation and growth of the MoS2 nanosheets, TNr with abundant anatase nanoparticles generated on the surface effectively inhibited the agglomeration of the MoS2 nanosheets. Since the one-dimensional (1D) nanorod structure is highly ordered, it is beneficial for the transmission of electrons because the electrons can selectively transfer along the one-dimensional nanorods due to the quantum confinement in the transverse direction, and simultaneously shorten the transport distance of the electrolyte ions.25 The TiO2 nanostructure also exhibited good stability in electrochemical reactions other than the substrate function, which greatly improved the stability of the MoS2/TiO2 composites and effectually promoted the sustainable utilization of electrode materials.26–28
Considering that the MoS2@TNr composites exhibit excellent piezoelectric catalytic degradation performance, and fully extend the utilization of materials in practical application, the electrochemical properties of the recycled MoS2@TNr catalyst for supercapacitor testing were further explored in this study. On the one hand, the reuse of the abandoned catalysts collected after the piezoelectric catalytic degradation process for the typical energy storage devices could largely eliminate secondary pollution of the natural environment. On the other hand, the reclaimed catalyst serving as a potential electrode material for energy storage may beneficially promote the development of renewable energy technology, as well as decrease the energy consumption to some extent. Hence, the MoS2@TNr composite is expected to act as an excellent multifunctional material to solve both the environmental pollution and energy shortage problems.
2. Experimental details
2.1 Preparation of the catalysts
First, 0.8 g commercial P25 (anatase 80%; rutile 20%; ≥98.0%, Aladdin) was put into 50 mL NaOH (≥98.0%, Aladdin) solution (10 M); after ultrasonically dispersing for 10 min, the mixture was hydrothermally reacted at 220 °C for 24 h. After the hydrothermal reaction, the resultant precipitate was cooled to room temperature and washed several times with deionized water until it became neutral. Subsequently, the white precipitate was transferred to HCl (≥37.0%, Aladdin) solution (1 M) and stirred continually for 2 h. After washing, the precipitate was dried at 70 °C for 12 h, and then after grinding, the samples were collected and designated as TNr.The TNr prepared above was transferred into 50 mL H2SO4 (98.0%, Aladdin) solution (0.2 M) and reacted at 100 °C for 12 h. The precipitate was then repeatedly washed with deionized water until it was neutral, and the product was denoted as TNraid.
Here, 0.4 g Na2MoO4·2H2O (99.0%, Macklin) and 0.8 g CH3CSNH2 (≥99.0%, Aladdin) were put into 50 mL deionized water and stirred until completely dissolved. Subsequently, 0.8 g TNraid was weighed and added to the solution with continuous stirring until well mixed. The pH of the solution was adjusted to 6, then the mixed solution was hydrothermal reacted at 220 °C for 24 h, the obtained black precipitate was repeatedly washed with deionized water, followed by drying at 70 °C. Finally, the reaction product was labeled as MoS2@TNr. For reference, the bare TNr without adding any Mo and S sources was prepared using the same procedure mentioned above.
2.2 Piezoelectric catalytic degradation
Firstly, rhodamine B (RhB, ≥97.0%, Aladdin) dye solution of 20 ppm was prepared. Then, 0.05 g catalyst was added to 50 mL of dye solution prepared above, and then the solution was rapidly stirred in the dark. The stirring rate of the magnetic stirrer was controlled at 600 rpm. After 10 min, the extracted mixed solution was separated by centrifugation and 0.8 mL supernatant was diluted with deionized water to 3.2 mL, then the absorbance of the supernatant dye was measured by the ultraviolet-visible spectrophotometer. The piezoelectric catalytic degradation procedures of other dye solutions like methylene blue (MB, ≥98.0%, Macklin) and crystal violet (CV, ≥96.0%, Aladdin) were exactly the same.2.3 Supercapacitors
![[thin space (1/6-em)]](https://www.rsc.org/images/entities/char_2009.gif) :
:![[thin space (1/6-em)]](https://www.rsc.org/images/entities/char_2009.gif) 1
1![[thin space (1/6-em)]](https://www.rsc.org/images/entities/char_2009.gif) :
:![[thin space (1/6-em)]](https://www.rsc.org/images/entities/char_2009.gif) 1. After grinding in the N-methyl pyrrolidone (NMP, ≥99.5%, Macklin) solvent for at least half an hour, the mixture was uniformly spread onto a 1.0 cm × 1.5 cm clean nickel foam sheet, in which a 1 cm × 1 cm area was partially coated with the black mud above. The nickel foam sheet was dried in a vacuum oven at 80 °C for 12 h and after drying, it was pressed for 30 s onto a thin sheet at a pressure of 10 MPa. The mass m2, was obtained and the deviation between m2 and m1 (m = m2 − m1) was the mass of the applied black mud, and the mass of the active material coated on the electrode can be determined as follows: m = (m2 − m1) × 0.8 × 100%.
1. After grinding in the N-methyl pyrrolidone (NMP, ≥99.5%, Macklin) solvent for at least half an hour, the mixture was uniformly spread onto a 1.0 cm × 1.5 cm clean nickel foam sheet, in which a 1 cm × 1 cm area was partially coated with the black mud above. The nickel foam sheet was dried in a vacuum oven at 80 °C for 12 h and after drying, it was pressed for 30 s onto a thin sheet at a pressure of 10 MPa. The mass m2, was obtained and the deviation between m2 and m1 (m = m2 − m1) was the mass of the applied black mud, and the mass of the active material coated on the electrode can be determined as follows: m = (m2 − m1) × 0.8 × 100%.The specific capacitance was calculated according to the discharge time by the following formula:
 | (1) |
2.4 Characterization
The morphology was probed by an S-4800 field emission scanning electron microscope (SEM, 5.0 kV, Hitachi, Japan). The transmission electron microscopy (TEM) and high-resolution transmission electron microscopy (HRTEM) with energy-dispersive spectroscopy (EDS) were conducted using a JEM-2100F electron microscope (JEOL, 2000 kV, Japan). The crystal structure was analyzed by an X-ray diffractometer (XRD, Rigaku D/MAX 2500PC, Cu Kα, 40 kV, 250 mA, wavelength 1.5406 Å). The X-ray photoelectron spectroscopy (XPS) was conducted using a Kratos XSAM800 spectrometer, and the composition and valence state of the elements in the composites material were measured by Mg Kα irradiation. The Brunauer–Emmett–Teller (BET) specific surface area analysis was conducted (77 K, JW–BK) and Barrett–Joyner–Halenda (BJH) adsorption pore size distribution curves were determined by N2 adsorption analysis (Micromeritics ASAP 2020M). The electrochemical performance tests involved in this experiment were all conducted on the electrochemical workstation (CHI660, Shanghai Chen Hua Instrument Co. Ltd.), and all experiments used the three-electrode system. The positron annihilation experiments were carried out via fast–fast coincidence positron annihilation lifetime spectroscopy (PALS) with a time resolution of 0.230 ns for the full width at half maximum (FWHM), and 1 million counts were collected for each spectrum. The total organic carbon (TOC) was measured using a Shimadzu TOC-VCPH analyzer (vario TOC, DKSH China) to determine the mineralization extent. The chemical oxygen demand (COD) was measured by a COD instrument (JJG 6G, Jingjing, China). The absorbance of the dye solution was measured by an ultraviolet-visible spectrophotometer (Hitachi U 3900, Hitachi, Japan).3. Results and discussion
3.1 Morphology and phase structures
Fig. 1 reveals the structure and morphological transformation process from TNr to TNraid and then to the MoS2@TNr composite by SEM and TEM images. During a hydrothermal reaction at a high temperature of 220 °C, the commercial three-dimensional (3D) P25 nanoparticles (NPs) were completely transformed into a 1D nanorod-like structure with a smooth surface that was evenly distributed for the entire view; the length was dozens to hundreds of micrometers, while the diameter was about several hundred nanometers. The detailed synthesis process is shown in Fig. S1,† and the crystal phase exhibited by the XRD pattern is shown in Fig. S2.† The characteristic diffraction peaks corresponding to the TiO2 crystalline phases completely disappeared, whereas the characteristic peaks assigned to the monoclinic phases of H2Ti3O7 at 2θ: 10.9°, 25.1° and 48.8° appeared, which were respectively related to the crystal planes of T (200), T (110) and T (020) (JCPDS file 00-36-0654).29–32 A new peak, differing from the T (110) plane of H2Ti3O7, appeared at around 2θ = 25.3° in the TNraid; since it matched perfectly with the A (101) lattice plane of TiO2, it was inferred that part of H2Ti3O7 dehydrated into the anatase phase TiO2 through the surface modification procedure. As shown in Fig. 1(b) and (e), abundant bright diamond shaped particles appeared and were uniformly attached to the nanorod surface, although there was no significant change in the 1D structure. Combined with the XRD results above, the particulate matter on the TNraid surface might belong to the anatase phase TiO2, which was speculated to be formed by the dehydration of H2Ti3O7 (3TiO2·H2O) during the surface modification process.33–35 The introduction of anatase overcame the lattice mismatch barriers between TiO2 and MoS2 and provided high binding energy sites for the nucleation and growth of MoS2 nanosheets.36–40 Fig. 1(c) and (f) respectively show the SEM and TEM images of the MoS2@TNr composites; the single- and few-layered MoS2 nanosheets were firmly attached to the TNr surface due to high lattice matching and the effects of strong polar groups generated on the MoS2 surface.41 The morphological differences highlight the important role of TNr as a support material in the formation process of the two-dimensional (2D) MoS2 nanosheets, and the -Mo will probably bond with the broken Ti–O bond to form a new Mo–O–Ti bond; thus, the MoS2 nanosheets in the MoS2@TNr composites may share a stable structure during the electrochemical reaction.42,43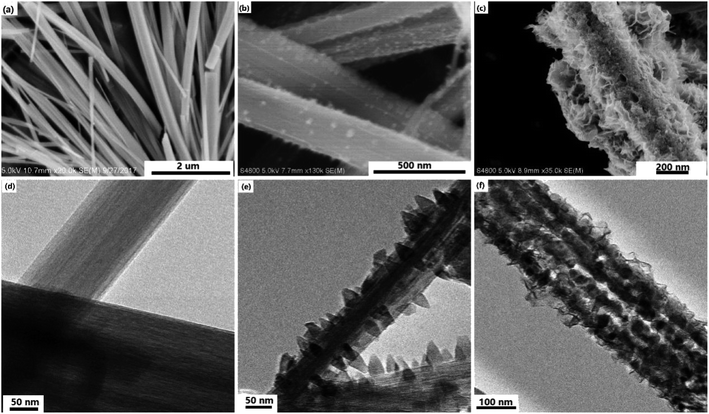 | ||
| Fig. 1 SEM images of TNr (a), TNraid (b) and the MoS2@TNr composites (c); and TEM images of TNr (d), TNraid (e) and MoS2@TNr composites (f). | ||
The HRTEM micrographs are shown in Fig. 2(a) and (b); the single- and few-layered MoS2 nanosheets were tightly coated onto the TNr surface, with the active edges being fully exposed. As shown in Fig. 2(b), the thin MoS2 nanosheets with the lattice spacing of 0.62 nm and 0.64 nm corresponding to the (002) plane of MoS2 were dispersed along the TiO2 nanorods.44 Since it was supposed to be the main crystal phase of the TNr, the interlinear spacing of d = 0.35 nm in accordance with the anatase phase A (101) of TiO2 was observed to cover the whole view below the MoS2 nanosheets, and no thick fringes belonging to H2Ti3O7 were observed.45,46 Corresponding to the XPS results below, the EDS results (shown in the inset) revealed the coexistence of the Mo, S, Ti and O. The XRD patterns of the MoS2@TNr composites are shown in Fig. 2(c); characteristic diffraction peaks at 13.8° and 34.5° related to the (002) and (100) crystal planes of MoS2 were observed in the MoS2@TNr composites, which confirmed the successful synthesis of the composite material. The surface chemical nature and bonding configuration were systematically characterized by XPS analysis, the C 1s peak at 284.6 eV assigned to impurities from the air was used for calibration; as shown in Fig. 2(d), the fully scanned spectra further proved the co-existence of Mo and S other than the Ti, O and C.
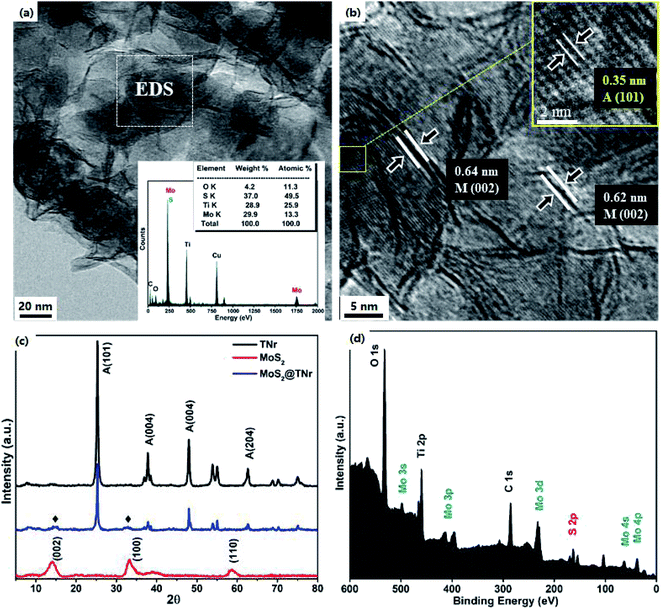 | ||
| Fig. 2 TEM image (a) and EDS spectrum (insert picture) and HRTEM image (b); XRD patterns (c), and XPS spectra for survey spectrum of the MoS2@TNr composites (d). | ||
3.2 Piezoelectric catalytic degradation
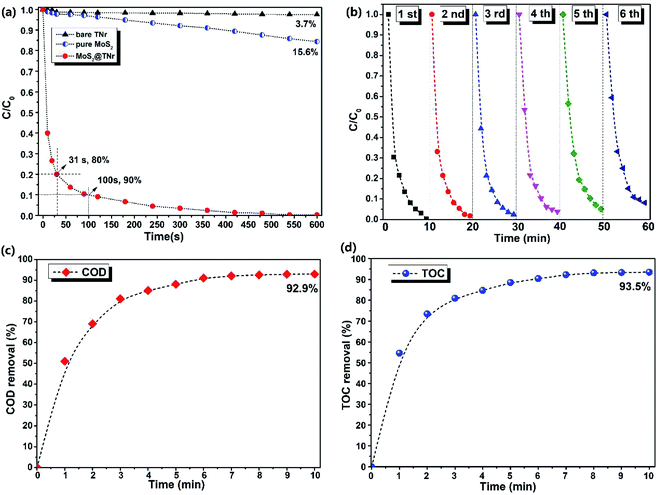
The piezoelectric catalytic performance of the MoS2@TNr composite catalyst here was evaluated by the degradation of dye solutions like RhB, MB and CV, and the results are shown in Fig. 3 and S3.† In the dark, the magnetic stirrer was used to provide external mechanical energy for the piezoelectric catalyst to become deformed and then induce a piezoelectric field, which may subsequently serve as an efficient driving force for the separation of free carriers.19 Neither the bare TNr nor the pure MoS2 nanosheets showed obvious piezoelectric catalytic ability for the RhB degradation; after 10 min, the degradation rate by the pure MoS2 nanosheets was only 15.6%, while the bare TNr completely showed no piezoelectric degradation properties. Conversely, the prepared MoS2@TNr composites exhibited excellent piezoelectric catalytic performance on the RhB dyes degradation, and it is worth mentioning that the piezoelectric catalytic degradation behavior showed an ultra-fast charge transfer and reaction rate that were quite different from the photocatalytic degradation. In the first 30 s, nearly 80% of RhB dye in the system was degraded, and when the reaction proceeded to 100 s, the degradation rate reached close to 90%. Later, as the concentration of dye molecules in the solution decreased with time, the catalytic degradation gradually slowed down, and the RhB dye in the solution was nearly completely degraded within 10 min. Therefore, it can be inferred that the MoS2@TNr composites exhibited a synergistic effect in the piezoelectric catalytic activity due to the formation of the composite structure at the interface. The high e−/h+ carrier separation efficiency of the MoS2@TNr composites permitted a much better catalytic degradation performance than either the bare TNr or the pure MoS2 nanosheets that were respectively used as the catalyst.47,48 The piezoelectric catalytic degradation experiments for the MB and CV solutions were also carried out, and the absorbance spectra of the supernatant and the corresponding degradation rates are shown in Fig. S3.† The catalyst showed ultra-fast degradation rates for various dyes solutions, especially for the MB and CV solution. As long as the piezoelectric catalytic degradation reaction took place, the absorbance range at 200–250 nm appeared suddenly and increased, positively correlated with the reaction time, which was probably attributed to the intermediate products generated in the degradation process. The results fully confirmed the authenticity of the piezoelectric catalytic reaction and eliminated the possibility of adsorption behavior.The recycling stability of the composite catalyst was further investigated via repeatedly degrading RhB solutions, and the results are shown in Fig. 3(b). Although the piezoelectric catalytic degradation rate decreased slightly with the cycle time, the piezoelectric catalytic behavior remained highly active after 5 cycles, and in the 6th cycle, the degradation rate was over 90%, and the decrease in the reaction rate here may have been caused by the incomplete degradation due to the surface adhesion.49 In order to verify the conclusions above and for further exploration, the chemical oxygen demand (COD) and total organic carbon (TOC) measurements were investigated to determine the mineralization extent of the dye molecules during the piezoelectric catalytic degradation reaction; the results are respectively shown in Fig. 3(c) and (d). Both the COD and TOC removal rates were continuously increased as the piezoelectric catalytic reaction progressed, and the tendency was the same as the degradation rate above. It is worth noting that after 10 min of piezoelectric catalytic degradation reaction, there were almost no RhB molecules in the solution (as the absorbance at 650 nm was close to zero), but neither the removal rate of COD (92.9%) nor TOC (93.5%) reached 100%. Therefore, it was speculated that most of the dye molecules were degraded to CO2 and H2O, whereas a small amount of dye molecules were converted into intermediates and remained in the solution.50,51
3.3 Electrochemical tests
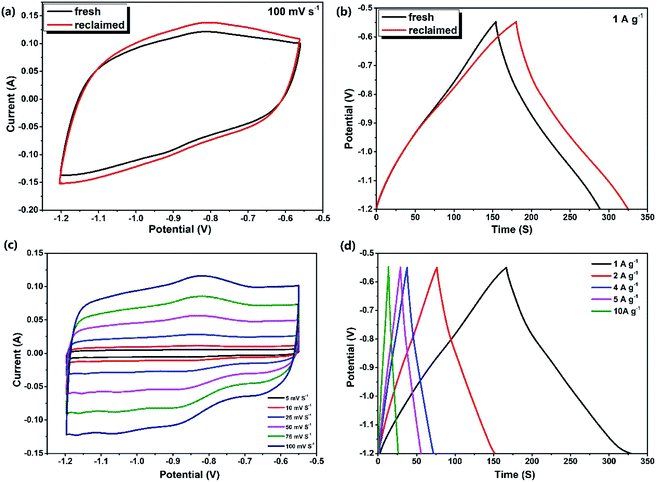
Experiments in this section investigated the effects of piezoelectric catalytic degradation on the electrochemical energy storage capability, which effectively improved the multi-effect utilization of materials. Here, the MoS2@TNr composite catalyst was reclaimed after the 5th cycle degradation reaction on RhB solution and was reused as the active material for the supercapacitor electrode.52 A three-electrode testing system was adopted in the simulation electrochemical experiment, and the Na2SO4 solution was selected as the electrolyte. In order to obtain the best voltage window, the maximum CV area was obtained by adjusting the starting and ending voltage values under the premise of ensuring that the CV shapes remained like rectangles.53 As shown in Fig. S4,† by calculation and comparison, the CV area enclosed by the MoS2@TNr electrode at the potential voltage window of −1.2 V to −0.55 V was the largest, and the corresponding maximum capacitance was calculated to be 225 F g−1 at a current density of 1 A g−1.Fig. 4(a) and (b) respectively show the CV and GCD curves of the fresh and the reclaimed MoS2@TNr composites. The CV area enclosed by the reclaimed catalyst was larger than the fresh catalyst, and the GCD curves without an obvious iR drop showed that both the charge and discharge times of the reclaimed catalyst extended a bit longer, which reflected better conductivity and capacitance properties. The specific capacitance of the reclaimed MoS2@TNr composite material was calculated to be 249 F g−1, about one-tenth higher than the fresh catalyst of 225 F g−1; thus, it can be inferred that the reclaimed materials activated by the piezoelectric catalytic reaction may exhibit better electrochemical performance for energy storage. Incidentally, for the purpose of eliminating the interference caused by the nickel foam electrode in the reaction, the control experiment for the blank electrode was carried out at a scan rate of 100 mV s−1; the results are shown in Fig. S5.† The CV curve of the blank nickel electrode approximated to a straight line with respect to the composite electrode covered with MoS2@TNr materials, which demonstrated the rationality of nickel foam as the electrode support in this potential voltage window.53 Fig. 4(c) and (d) show the electrochemical performance of the recycled composite catalyst, where the potential voltage window was set between −1.2 V and −0.55 V. Although the CV curve reflected a small redox current as the scan rate increased, there was no significant change in the CV shape throughout, which suggested that the regenerated material had good electrochemical rate capability.54–56 The CV curve showed perfect symmetry with the changes in forward and reverse scanning, indicating that the electrode material had excellent reversibility and higher discharge efficiency. Since the measured GCD curves were approximately symmetrical triangles, and the current values varied linearly with the charge/discharge time, it was concluded that the charges in the MoS2@TNr composites were mainly attributed to the electric double layer accumulation, which further proved that the recycled materials had ideal capacitance performance.57,58
As shown in Fig. 5(a), the specific capacitance values of the reclaimed MoS2@TNr materials at 1 A g−1, 2 A g−1, 4 A g−1, 5 A g−1, 10 A g−1, 15 A g−1 and 20 A g−1 were, respectively, 249 F g−1, 241 F g−1, 237 F g−1, 228 F g−1, 222 F g−1, 208 F g−1, 201 F g−1. The specific capacitance decreased as the current density increased, although the decline rate gradually slowed down on further improving the current density. This phenomenon can be explained as follows. At a high current density, the time taken for charging or discharging was greatly reduced; therefore, the ions in the electrolyte could not enter the electrode material in such a short time and as a result, the charge–discharge behavior could only occur on the surface while the internal electrode material had no chance to participate in the reaction.59–62 It can be speculated that the reclaimed MoS2@TNr composite exhibited good electrochemical stability; as shown in Fig. 5(b), after 10![[thin space (1/6-em)]](https://www.rsc.org/images/entities/char_2009.gif) 000 cycles of charge–discharge tests, the specific capacitance was maintained at 92%.
000 cycles of charge–discharge tests, the specific capacitance was maintained at 92%.
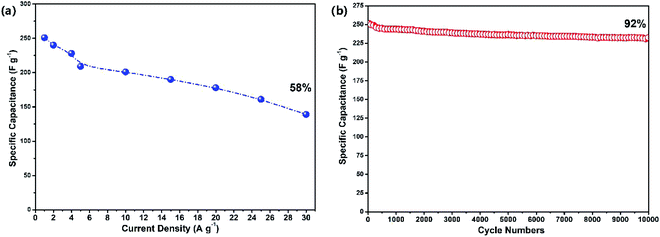 | ||
| Fig. 5 Specific capacitance changing with current densities (a) and the cycle performance under 1 A g−1 (b). | ||
4. Mechanism and discussion
4.1 Structure and composition analysis
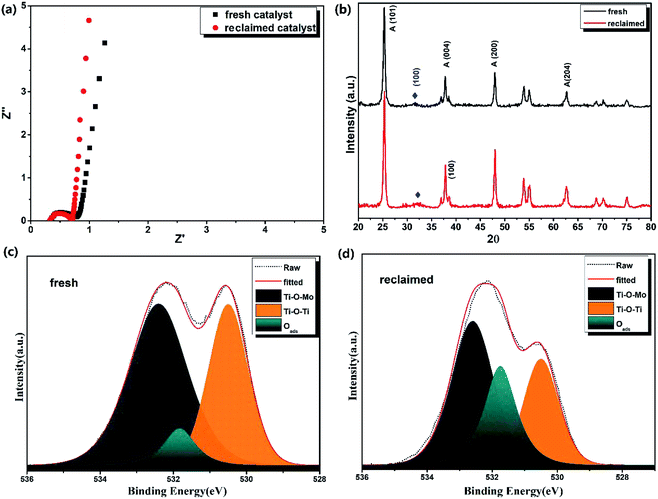
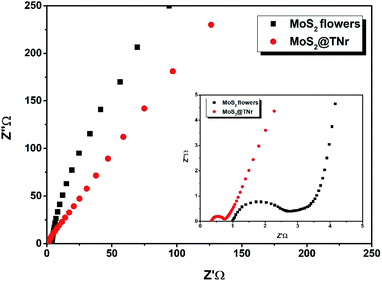
The internal resistance of the reclaimed MoS2@TNr material was tested by electrochemical impedance spectroscopy (EIS) measurements in a frequency range of 106 to 10−2, and the results are shown as the Nyquist plot in Fig. 6(a). The radius of the arc on the EIS spectra reflected the reaction rate occurring on the electrode surface, and the EIS Nyquist plot with smaller arc radius sufficiently proved a faster interfacial charge transfer and more effective e−/h+ pair separation rate. After fitting, the equivalent series resistance (Rs) and charge transfer internal resistance (Rct) of the fresh MoS2@TNr materials were calculated to be 0.35 Ω and 0.45 Ω, respectively, whereas the Rs and Rct of the recycled catalysts were respectively 0.34 Ω and 0.42 Ω, slightly lower as compared to the fresh materials. The fitting line of the reclaimed materials in the low frequency part was closer to a vertical straight line, which proved that the reclaimed MoS2@TNr composite material had a smaller diffusion resistance and better capacitance performance,63–66 in accordance with the capacitance characteristics above. To investigate the crystal structure of the MoS2@TNr composites after the piezoelectric catalytic degradation process, the XRD patterns were obtained, and the results are shown in Fig. 6(b). By comparing the peak intensity and the peak position, it was observed that the crystal structure of the MoS2@TNr composite had no obvious change during the progress of the piezoelectric catalytic reaction. XPS analysis (shown in Fig. 6) was also employed to explore the surface chemical composition and element valence of the composite catalyst, which was reclaimed after 5-cycle piezoelectric catalytic degradation tests; the elemental content was calculated and compared as shown in Table 1. It is worth noting that the content of oxygen element in the reclaimed catalyst increased by about 5% after the piezoelectric catalytic degradation. Since the lattice oxygen content did not increase during the reaction, it was inferred that the increase in the oxygen element was completely due to the adsorbed oxygen. Considering that the oxygen could only be adsorbed onto the oxygen vacancies in the vacuum environment, the adsorbed oxygen content was mainly determined by the amount of oxygen vacancies in the catalyst material.59 During the piezoelectric catalytic degradation process, the active hydrogen rapidly combines with an O atom on the catalyst surface to form an OH-species that would later become a H2O molecule, leading to the generation of an oxygen vacancy.66,67 Compared to the peak fitting results of the O 1s energy spectrum, the amount of lattice oxygen in the reclaimed catalyst obviously decreased, while the peak area at the binding energy of 532.5 eV corresponding to the adsorbed oxygen showed a great increase. This further confirmed the formation of oxygen vacancies due to the ion exchange reaction at the interface during the piezoelectric catalytic reactions.59 Since the diffusion velocity of O2− from inside to outside was faster than that of S2− from outside to inside, in the process of ion transfer and diffusion, the ion concentration could not diffuse and reach equilibrium completely, which resulted in oxygen vacancy and porous structure.68| Samples | Mo 3d | S 2p | O ls | Ti 2p | τ1 (ps) | τ2 (ps) | I1 (%) | I2 (%) | I1/I2 |
|---|---|---|---|---|---|---|---|---|---|
| Fresh | 6.59 | 17.61 | 62.38 | 13.42 | 197 | 371 | 28.91 | 71.09 | 2.45 |
| Reclaimed | 5.82 | 15.07 | 67.15 | 11.97 | 292 | 470 | 11.87 | 88.13 | 7.42 |
Positron annihilation lifetime spectroscopy (PALS) was considered to be an effective and sensitive technique to qualitatively study and analyze the oxygen vacancies in the catalyst samples at low concentrations.66,67 Once the positrons were injected into the samples, they preferentially diffused to the low electron density regions such as microvoids, mono-vacancies and vacancy clusters, and were then thermalized and annihilated by electrons, simultaneously emitting γ rays. Usually, in a disordered system, the small mono vacancies or oxygen vacancies can lower the electron density and then decrease the annihilation rate; thus, the lifetimes of positrons that contain the information about defects in the samples can be obtained by the positron annihilation tests. Hence, the PALS here was mainly used to characterize the oxygen vacancies in the reclaimed composite catalysts and then to verify the correlation between the oxygen vacancies and electrochemical performance. As shown in Table 1, two lifetime components, τ1 and τ2, along with the relative intensities, I1 and I2, both for the fresh and the reclaimed MoS2@TNr were provided. As reported, the shorter lifetime component (τ1) was attributed to the free annihilation of positrons in the defect-free crystal, while the longer lifetime component (τ2) generally arose from larger sized defects of oxygen vacancy clusters due to the lower average electron density.66 Both of the lifetimes, τ1 and τ2, of the reclaimed catalyst were significantly extended as compared with the fresh catalyst, indicating that there were more defects in the composite material after the piezoelectric catalytic reaction. The intensity I1 of the reclaimed samples decreased a lot, while I2 showed a great increase, and the ratio of I1 to I2 (I1/I2) for the reclaimed catalyst was 7.42, which was much higher as compared to the fresh catalyst of 2.45. This is because the increased defects during the piezoelectric catalytic degradation process were mainly attributed to the introduction of oxygen vacancies.66
The N2 adsorption–desorption isotherm equilibrium and Barrett–Joyner–Halenda (BJH) desorption pore distribution were investigated to reveal the specific surface area and porous structure, as shown in Fig. 7(a and b). The MoS2@TNr composite was full of pores; in particular, the reclaimed MoS2@TNr composite exhibited a broader pore size distribution ranging from 2 nm to 80 nm, though the specific surface area showed a slight decrease due to the intermediate products adsorbed on its surface. As demonstrated in Fig. S6,† the pore structure played an important role in electrochemical properties such as ion exchange, electron transfer and charge diffusion. Moreover, the porous structure effectively increased the electrochemical active sites and simultaneously shortened the ion diffusion length,59 which was supposed to be the key point in achieving better electrochemical performance. Simultaneously, more oxygen vacancies and electrochemical active sites generated through the piezoelectric catalytic reaction may facilitate the separation of e−/h+ pairs by serving as trap sites for free electrons, and then considerably promoting the reversible transfer of the internal charges, thereby greatly increasing the capacitance properties.59,69,70 The synergistic effect of the TiO2 and MoS2 also favored the rapid transfer of free electrons inside the composites, so the MoS2@TNr composites could exhibit excellent piezoelectric catalytic stability, as well as outstanding electrochemical energy storage capability.59
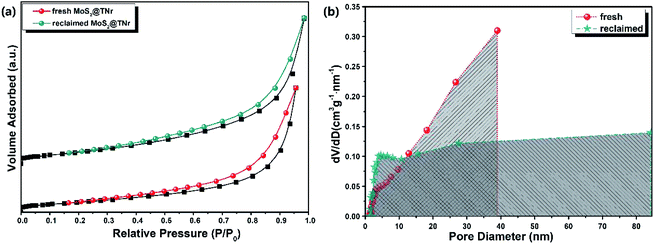 | ||
| Fig. 7 N2 adsorption–desorption isotherms (a) and pore-size distribution curves (b) of the fresh and reclaimed MoS2@TNr composites. | ||
4.2 Synergistic effect tests
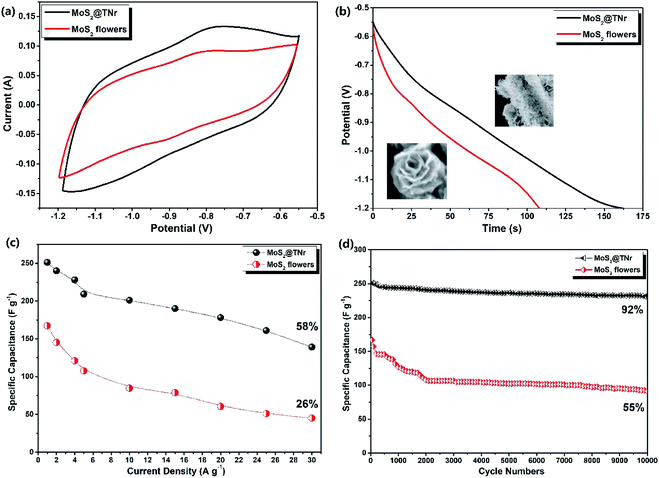
The synergistic effect of the two factors (MoS2 and TiO2) was evaluated by comparing the electrochemical properties of the MoS2@TNr composite and the pure MoS2 nanoflowers instead of the MoS2 nanosheets, both of which were full of exposed active edges and known for excellent electrochemical performance. Fig. 8(a) shows the CV curves at the scan rate of 100 mV s−1 with a potential voltage window of −1.2 V to −0.55 V; the specific capacitance of the MoS2@TNr composite was higher as compared to the MoS2 nanoflowers since the CV area surrounded by MoS2@TNr was obviously larger. Fig. 8(b) shows the GCD curves at 1 A g−1, the specific capacitance of the pure MoS2 nanoflowers was calculated to be 166 F g−1, which was only two thirds that of the MoS2@TNr composite of 249 F g−1. As shown in the inset, the MoS2 nanoflowers were formed by the inward folding of several layers nanosheets, of which the edges were exposed to multi-layered sheets with the diameter of about 200 nm. Since the edge portions of the less-layered MoS2 nanosheets possessed more exposed S2− bonds,71 the superposition of multiple layers might cause an adverse effect so that the internal piezoelectric fields would cancel each other, which would, in turn, affect the piezoelectric performance.72 Therefore, the ultra-thin MoS2 nanosheets existing in single or few layers were composited with the over-long TiO2 nanorods as the MoS2@TNr composite;25 in this case, the nanosheet stacking was badly restrained, and the carrier separation efficiency was greatly enhanced due to the synergistic effect. Fig. 8(c) shows that the specific capacitance varied with different current densities, since a high current density may seriously affect the utilization of active materials; thus, as the current density increased, the specific capacitance showed a gradual decrease. When the current density increased to 20 A g−1, the specific capacitance of the MoS2 nanoflowers sharply fell to 26%, whereas the MoS2@TNr composite maintained more than 58% of the original value. Fig. 8(d) shows the stability testing of the MoS2@TNr composite and MoS2 nanoflowers, which were both cycled 10![[thin space (1/6-em)]](https://www.rsc.org/images/entities/char_2009.gif) 000 times at 1 A g−1. The specific capacitance of the MoS2@TNr composites was relatively stable under the electrochemical charge–discharge reaction, while the specific capacitance of the MoS2 nanoflowers dropped to 55% as a result. Considering that the MoS2 nanoflowers with a multi-layer overlapping structure agglomerated extremely easily, the charge–discharge behavior can only take place on the electrode material surface at higher current density, which may badly affect the electrochemical storage properties. Since the 1D TNr enabled the MoS2@TNr composite to be evenly laid on the surface of the electrode plate, the agglomeration of the active materials was greatly reduced and the utilization rate at high current density was effectively improved.
000 times at 1 A g−1. The specific capacitance of the MoS2@TNr composites was relatively stable under the electrochemical charge–discharge reaction, while the specific capacitance of the MoS2 nanoflowers dropped to 55% as a result. Considering that the MoS2 nanoflowers with a multi-layer overlapping structure agglomerated extremely easily, the charge–discharge behavior can only take place on the electrode material surface at higher current density, which may badly affect the electrochemical storage properties. Since the 1D TNr enabled the MoS2@TNr composite to be evenly laid on the surface of the electrode plate, the agglomeration of the active materials was greatly reduced and the utilization rate at high current density was effectively improved.
To detect the charge transfer characteristics of the MoS2@TNr composites and the pure MoS2 nanoflowers, EIS was carried out as shown in Fig. 9. Through testing, the Rs and Rct of MoS2 nanoflowers were determined to be 0.9 Ω and 1.9 Ω, respectively, which were much higher as compared to the MoS2@TNr composites of 0.34 Ω and 0.42 Ω; this proved that the composite material had a higher charge transfer efficiency and higher capacitance.73 On the one hand, the overlong TiO2 nanorods enabled the MoS2 nanosheets to expose as many active edges as possible, thus effectively suppressing the stacking and agglomeration of the MoS2 layers. On the other hand, the synergistic effect efficaciously reduced the electrical resistance and favored the transfer efficiency of the carriers inside the materials, which was then beneficial for improving the electrochemical performance.
5. Conclusions
In this paper, a novel energy storage technology is proposed via the reuse of the ultra-fast piezoelectric catalyst of the MoS2@TNr composite as a supercapacitor electrode material. The reclaimed catalyst showed exceptional electrochemical performance and great cycle stability due to the introduction of oxygen vacancies that were generated during the piezoelectric catalytic degradation reaction, which has been proved by the results of XPS and PALS. Since the pore structure greatly shortened the ion diffusion channel length and provided more paths for ion transportation, which finally led to good rate capability of the supercapacitor, the electrochemical performance of the reclaimed MoS2@TNr composite was greatly improved. The recycled composite material delivered a specific capacitance of 249 F g−1 at 1 A g−1, and a cyclic stability of 92% over 10![[thin space (1/6-em)]](https://www.rsc.org/images/entities/char_2009.gif) 000 cycles of charge–discharge reaction, which make it a great candidate for dealing with the environmental governance issues and energy storage problems.
000 cycles of charge–discharge reaction, which make it a great candidate for dealing with the environmental governance issues and energy storage problems.
Conflicts of interest
There are no conflicts to declare.Acknowledgements
This work was financially supported by the National Key R&D Program of China (No. 2019YFA0210003) and the China Postdoctoral Science Foundation (No. 2019M662716).References
- J. P. Holdren, Science, 2007, 315, 737 CrossRef CAS.
- T. Y. Wang, S. Q. Chen, H. Pang, H. G. Xue and Y. Yu, Adv. Sci., 2017, 4, 1600289 CrossRef.
- G. P. Wang, L. Zhang and J. J. Zhang, Chem. Soc. Rev., 2012, 41, 797–828 RSC.
- Y. Huang, M. S. Zhu, Y. Huang, Z. X. Pei, H. F. Li, Z. F. Wang, Q. Xue and C. Y. Zhi, Adv. Mater., 2016, 28, 8344–8364 CrossRef CAS.
- G. Zhang, H. J. Liu, J. H. Qu and J. H. Li, Energy Environ. Sci., 2016, 9, 1190–1209 RSC.
- X. H. Lu, M. H. Yu, G. M. Wang, Y. X. Tong and Y. Li, Energy Environ. Sci., 2014, 7, 2160–2181 RSC.
- M. Winter and R. J. Brodd, Chem. Rev., 2005, 105, 1021 CrossRef CAS.
- P. Simon and Y. Gogotsi, Nanoscience and Technology, 2010, 7, 320–329 Search PubMed.
- X. Peng, L. L. Peng, C. Z. Wu and Y. Xie, Chem. Soc. Rev., 2014, 43, 3303–3323 RSC.
- M. Salanne, B. Rotenberg, K. Naoi, K. Kaneko, P.-L. Taberna, C. P. Grey, B. Dunn and P. Simon, Nat. Energy, 2016, 1, 16070 CrossRef CAS.
- L. B. Dong, C. J. Xu, Y. Li, Z. H. Huang, F. Y. Kang, Q. H. Yang and X. Zhao, J. Mater. Chem. A, 2016, 4, 4659–4685 RSC.
- M. Acerce, D. Voiry and M. Chhowalla, Nat. Nanotechnol., 2015, 10, 313 CrossRef CAS.
- A. Ejigu, I. A. Kinloch, E. Prestat and R. Dryfe, J. Mater. Chem. A, 2017, 5, 11316–11330 RSC.
- X. M. Geng, Y. C. Jiao, Y. Han, A. Mukhopadhyay, L. Yang and H. L. Zhu, Adv. Funct. Mater., 2017, 27, 1702998 CrossRef.
- P. P. Wang, H. Y. Sun, Y. J. Ji, W. H. Li and X. Wang, Adv. Mater., 2014, 26, 964–969 CrossRef CAS.
- T. T. Shan, S. Xin, Y. You, H. P. Cong, S. H. Yu and A. Manthiram, Angew. Chem., Int. Ed., 2016, 55, 12783–12788 CrossRef CAS.
- E. Ponomarev, Á. Pásztor, A. Waelchli, A. Scarfato, N. Ubrig, C. Renner and A. F. Morpurgo, ACS Nano, 2018, 12, 2669–2676 CrossRef CAS.
- J. B. Ye, L. Ma, W. X. Chen, F. H. Huang, C. Gao and J. Y. Lee, J. Mater. Chem. A, 2015, 3, 6884–6893 RSC.
- L. Wan, S. Y. Hu, J. X. Liu, D. Q. Chen, S. S. Liu, R. Xiao, Y. Zhang, J. Chen, C. Du and M. J. Xie, Ionics, 2020, 26, 2549–2561 CrossRef CAS.
- Y. Z. Li, H. W. Wang, L. B. Wang, R. Wang, B. B. He, Y. S. Gong and X. L. Hu, Energy Storage Materials, 2019, 23, 95–104 CrossRef.
- J. Zhou, M. Guo, L. L. Wang, Y. B. Ding, Z. Z. Zhang, Y. H. Tang, C. B. Liu and S. L. Luo, Chem. Eng. J., 2019, 366, 163–171 CrossRef CAS.
- K. Chanda, S. Thakur, S. Maiti, A. Acharya, T. Paul, N. Besra, S. Sarkar, A. Das, K. Sardar and K. K. Chattopadhyay, AIP Conf. Proc., 1953, 2018, 030138 Search PubMed.
- J. Liang, G. Zhu, C. Wang, Y. Wang, H. Zhu, Y. Hu, H. Lv, R. Chen, L. Ma, T. Chen, Z. Jin and J. Liu, Adv. Energy Mater., 2017, 7, 1601208 CrossRef.
- X. L. Li, X. D. Li, J. L. Cheng, D. M. Yuan, W. Nia, Q. Guan, L. Z. Gao and B. Wang, Nano Energy, 2016, 21, 228 CrossRef CAS.
- X. N. Zhao, Y. C. Lei, P. Fang, H. J. Li, Q. Han, W. G. Hu and C. Q. He, Nano Energy, 2019, 66, 104168 CrossRef CAS.
- C. B. Liu, Y. R. Teng, R. H. Liu, S. L. Luo, Y. H. Tang, L. Y. Chen and Q. Y. Cai, Carbon, 2011, 49, 5312–5320 CrossRef CAS.
- X. Xu, Z. Y. Fan, S. J. Ding, D. M. Yu and Y. P. Du, Nanoscale, 2014, 6, 5245–5250 RSC.
- L. X. Yang, X. T. Zheng, M. Liu, S. L. Luo, Y. Luo and G. F. Li, J. Hazard. Mater., 2017, 329, 230–240 CrossRef CAS.
- J. R. Ran, G. P. Gao, F. T. Li, T. Y. Ma, A. J. Du and S. Z. Qiao, Nat. Commun., 2017, 8, 13907 CrossRef CAS.
- X. N. Zhao, P. Wu, M. Liu, D. Z. Lu, J. L. Ming, C. H. Li, J. Q. Ding, Q. Y. Yan and P. F. Fang, Appl. Surf. Sci., 2017, 410, 134–144 CrossRef CAS.
- J. W. Shi, Z. Y. Fan, C. Gao, G. Gao, B. R. Wang, Y. Wang, C. He and C. M. Niu, ChemCatChem, 2018, 10, 2833–2844 CrossRef CAS.
- M. Hinojosa-Reyes, R. Camposeco-Solís, F. Ruiz, N. N. Martínez, V. R. González and M. E. Compeán-Jasso, J. Nanomater., 2017, 11, 9610419 Search PubMed.
- K. Kataoka, N. Kijima and J. Akimoto, Inorg. Chem., 2013, 52, 13861–13864 CrossRef CAS.
- S. Zhang, L. M. Peng, Q. Chen, G. H. Du, G. Dawson and W. Z. Zhou, Phys. Rev. Lett., 2003, 91, 256103 CrossRef CAS.
- S. L. Xing, L. C. Lin, G. S. Zou, L. Liu, P. Peng, A. P. Wu, W. W. Duley and Y. N. Zhou, Nanotechnology, 2017, 28, 405302 CrossRef.
- W. J. Zhou, G. J. Du, P. G. Hu, G. H. Li, D. Z. Wang, H. Liu, J. Y. Wang, R. I. Boughton, D. Liu and H. D. Jiang, J. Mater. Chem., 2011, 21, 7937–7945 RSC.
- Y. J. Su, Y. Yang, H. L. Zhang, Y. N. Xie, Z. M. Wu, Y. D. Jiang, N. Fukata, Y. Bando and Z. L. Wang, Nanotechnology, 2013, 24, 295401 CrossRef.
- F. R. Fan, W. Tang and Z. L. Wang, Adv. Mater., 2016, 28, 4283–4305 CrossRef CAS.
- S. Cravanzola, L. Muscuso, F. Cesano, G. Agostini, A. Damin, Do. Scarano and A. Zecchina, Langmuir, 2015, 31, 5469–5478 CrossRef CAS.
- B. Chen, Y. H. Meng, J. W. Sha, C. Zhong, W. Hu and N. Zhao, Nanoscale, 2018, 10, 34–68 RSC.
- M. Shen, Z. P. Yan, L. Yang, P. W. Du, J. Y. Zhang and B. Xiang, Chem. Commun., 2014, 50, 15447–15449 RSC.
- N. Shi, X. H. Li, T. X. Fan, H. Zhou, J. Ding, D. Zhang and H. X. Zhu, Energy Environ. Sci., 2011, 4, 172–180 RSC.
- Y. J. Su, Y. Yang, H. L. Zhang, Y. N. Xie, Z. M. Wu, Y. D. Jiang, N. Fukata, Y. Bando and Z. L. Wang, Nanotechnology, 2013, 24, 295401 CrossRef.
- Y. Suzukia and S. Yoshikawa, J. Mater. Res., 2004, 19, 982–985 CrossRef.
- S. W. Lai, J. W. Park, S. H. Yoo, J. M. Ha, E. H. Song and S. O. Cho, Int. J. Hydrogen Energy, 2016, 41, 3428–3435 CrossRef CAS.
- J. Q. Liu, Z. Y. Zeng, X. H. Cao, G. Lu, L. H. Wang, Q. L. Fan, W. Huang and H. Zhang, Small, 2012, 8, 3517–3522 CrossRef CAS.
- H. Y. He, J. H. Lin, W. Fu, X. L. Wang, H. Wang, Q. S. Zeng, Q. Gu, Y. M. Li, C. Yan, B. K. Tay, C. Xue, X. Hu, S. T. Pantelides, W. Zhou and Z. Liu, Adv. Energy Mater., 2016, 6, 1600464 CrossRef.
- J. Zhang, L. H. Huang, Z. D. Lu, Z. L. Jin, X. Y. Wang, G. L. Xu, E. P. Zhang, H. B. Wang, Z. Kong, J. H. Xi and Z. G. Ji, J. Alloys Compd., 2016, 688, 840–848 CrossRef CAS.
- R. Djellabi, B. Yang, Y. Wang, X. Q. Cui and X. Zhao, Chem. Eng. J., 2019, 366, 172–180 CrossRef CAS.
- B. Masoomi, N. Jaafarzadeh, T. Tabatabaie, E. Kouhgardi and S. Jorfi, Environ. Health Eng. Manage. J., 2019, 6, 53–61 CrossRef CAS.
- F. T. Chen, P. F. Fang, Y. P. Gao, Z. Liu, Y. Liu and Y. Q. Dai, Chem. Eng. J., 2012, 204, 107–113 CrossRef.
- N. S. Lewis, Science, 2007, 315, 798–801 CrossRef CAS.
- W. H. Leng, Z. G. Zhang, J. Q. Zhang and C. N. Cao, J. Phys. Chem. B, 2005, 109, 15008–15023 CrossRef CAS.
- J. Bacardit, J. Stötzner, E. Chamarro and S. Esplugas, Ind. Eng. Chem. Res., 2007, 46, 7615–7619 CrossRef CAS.
- J. Y. Feng, X. J. Hu and P. L. Yue, Environ. Sci. Technol., 2004, 38, 269–275 CrossRef CAS.
- L. Zhang and X. Zhao, Chem. Soc. Rev., 2009, 38, 2520–2531 RSC.
- Y. C. Zhang, D. V. Voronine, S. R. Qiu, A. M. Sinyukov, M. Hamilton, Z. Liege, A. V. Sokolov, Z. R. Zhang and M. O. Scully, Sci. Rep., 2016, 6, 25788 CrossRef CAS.
- Z. Wang, Nano Today, 2010, 5, 540–552 CrossRef CAS.
- X. J. Yang, H. M. Sun, L. S. Zhang, L. J. Zhao, J. S. Lian and Q. Jiang, Sci. Rep., 2016, 6, 31591 CrossRef CAS.
- Z. Tang, C. Tang and H. Gong, Adv. Funct. Mater., 2012, 22, 1272–1278 CrossRef CAS.
- M. K. Wu, C. Chen, J. J. Zhou, F. Y. Yi, K. Tao and L. Han, J. Alloys Compd., 2018, 734, 1–8 CrossRef CAS.
- J. H. Yu, F. F. Xie, Z. C. Wu, T. Huang, J. F. Wu, D. D. Yan, C. Q. Huang and L. Li, Electrochim. Acta, 2018, 259, 968–974 CrossRef CAS.
- B. Li, F. Dai, Q. F. Xiao, L. Yang, J. M. Shen, C. M. Zhang and M. Cai, Energy Environ. Sci., 2016, 9, 102–106 RSC.
- X. J. Yang, L. J. Zhao and J. S. Lian, J. Power Sources, 2017, 343, 373–382 CrossRef CAS.
- L. J. Luo, T. M. Liu, S. Zhang, B. Ke, L. Yu, S. Hussain and L. Y. Lin, Ceram. Int., 2017, 43, 5095–5101 CrossRef CAS.
- L. L. Hou, Z. G. Guan, M. Zhang, C. Q. He, Q. Y. Li and J. J. Yang, Catal. Sci. Technol., 2018, 8, 2809 RSC.
- L. L. Hou, Z. J. Guan, T. F. Liu, C. Q. He, Q. Y. Li and J. J. Yang, Int. J. Hydrogen Energy, 2019, 44, 8109–8120 CrossRef CAS.
- J. Park, H. M. Zheng, Y. Jun and A. P. Alivisatos, J. Am. Ceram. Soc., 2009, 131, 13943–13945 CAS.
- H. H. Li, J. Song, L. L. Wang, X. M. Feng, R. Q. Liu, W. J. Zeng, Z. D. Huang, Y. W. Ma and L. H. Wang, Nanoscale, 2017, 9, 193–200 RSC.
- J. Min, J. Liu, M. Lei, W. J. Wang, Y. K. Lu, L. Y. Yang, Q. Yang, G. Liu and N. Su, ACS Appl. Mater. Interfaces, 2015, 8, 780–791 CrossRef.
- T. Gao, H. Fjellvåg and P. Norby, Inorg. Chem. Front., 2009, 48, 1423–1432 CrossRef CAS.
- C. L. Guo, L. Xu, J. He, L. F. Hu, B. Wang and L. G. Da, Nano, 2017, 12, 1750075 CrossRef CAS.
- H. Zhao, Y. M. Dong, P. P. Jiang, H. Y. Miao, G. L. Wang and J. J. Zhang, J. Mater. Chem., 2015, 3, 7375–7381 RSC.
Footnote |
| † Electronic supplementary information (ESI) available. See DOI: 10.1039/d0ra06532c |
| This journal is © The Royal Society of Chemistry 2020 |

