 Open Access Article
Visual detection of Fusarium proliferatum based on dual-cycle signal amplification and T5 exonuclease†
Ying Wang‡
 *ab,
Xiaoqiang Wang‡c,
Oliver Gailingb and
Dongmei Xi*a
aCollege of Life Science, Linyi University, Linyi 276005, People's Republic of China. E-mail: m13854869219@163.com
bFaculty of Forest Sciences and Forest Ecology, University of Göttingen, Göttingen 37077, Germany
cPlant Protection Research Center, Tobacco Research Institute of Chinese Academy of Agricultural Sciences, Qingdao 266101, People's Republic of China
First published on 23rd September 2020
Abstract
A novel visual detection of Fusarium proliferatum species through recombinase polymerase amplification and rolling circle amplification was established. Single-stranded circle DNA was produced based on one strand of RPA product, which used as a template for rolling circle amplification.
Fusarium proliferatum (F. proliferatum) belongs to the liseola section of Fusarium, and causes rot of stalk and ear, and reduces crop yield and quality.1,2 Mycotoxins are accumulated in crop tissues during the process of F. proliferatum infection, which severely endanger the health of people and livestock.3 Early detection is essential for control of occurrence and development of rot disease. PCR-based detection methods of F. proliferatum are developed4 to ensure yield and quality of crops and food safety. However, the method needs PCR instruments, skilled personnel, and purified genomic DNA as a template, which cannot be performed without a molecular laboratory. As a result, there is an instant demand to develop simple and sensitive methods to identify the presence of F. proliferatum on crops and their by-products.
Biosensing has gradually become a high-profile technology with many merits, for example rapidity, high sensitivity and selectivity, and low cost, and has been generally used to detect a series of biotic components.5–8 Signal amplification steps are always used to elevate the sensitivity of different types of biosensors.9,10 For genomic DNA detection, dsDNA products are generally obtained by PCR or isothermal amplification including loop-mediated isothermal amplification (LAMP)11 and recombinase polymerase amplification (RPA).12 LAMP reaction is performed using four or more primers at 60 °C or higher, which makes it is not as simple and convenient as that of RPA.
Recombinase polymerase amplification has been applied to detect many nucleic acid targets, such as intestinal protozoa,13 dengue virus,14 Leishmania donovani,15 pan-rickettsial,16 and the root-knot nematode Meloidogyne enterolobii.17 It mainly has three kinds of proteins, including recombinase, single-stranded DNA binding protein (SSB) and polymerase. Recombinase combines with primers, and the complex scans the DNA template. When the homologous sequence is found, primers hybridize with the target DNA to form a D-loop structure, and the complementary strand is stabilized by SSBs. In the presence of polymerase, primer extension is initiated. Newly produced dsDNA is the template for the next round of RPA. Recombinase and SSB make RPA bypass the heat denaturation in PCR.18 Two primers are needed in the RPA system,19 which are similar or slightly longer than those used in traditional PCR. The RPA reaction is generally completed within 20 min.20 The product could be cloned and sequenced after purification. Compared to high request of template purity in PCR and LAMP system, RPA system could successfully amplify target sequences without purification, which is an advantage in application of point-of-care detection.21,22
Rolling circle amplification (RCA) is one of the most popular tools for signal amplification, which has been widely used for detection of miRNA, single nucleotide polymorphisms, pathogens, cancer cells and their biomarkers.23–25 However, if there are two or more probes in the system, high background noise cannot be avoided,26 which lowers the reliability of the results. For decreasing the background noise, 3′-ends of non-RCA related probes are always closed by spacers using many strategies related to RCA.27,28 Nevertheless, block reactions with spacers are not always complete, and DNA probes without spacer still produce backgrounds. T5 exonuclease can degrade linear ssDNA, linear dsDNA and nicked plasmid DNA into mononucleotides in the 5′ → 3′ direction,29,30 while circular DNA will not be degraded. The feature of T5 exonuclease could be used to decrease backgrounds in RCA-based assays.
G-quadruplex is a G-rich DNA or RNA sequence, and consists of four parallel or anti-parallel hybridized fragments. Three adjacent guanosines are in each of the four strands, which form three paralleled planes through hydrogen bonds. G-quadruplex DNAzymes have activity of peroxidase-like complexes.31 They are used in a variety of label-free biosensors due to the advantages of simple use, cost-effectiveness, easy modification and acquisition.32,33 G-quadruplex-related strategies are also coupled with signal amplification steps, for example strand displacement amplification34,35 and RCA36 to elevate the sensitivity. RCA produces large weight ssDNA with G-rich sequences using circular ssDNA as template bearing trans-complementary G-quadruplex sequences. More than eight G-quadruplexs can be constructed to multimeric G-quadruplexes, which has higher peroxidase activity than single G-quadruplex DNAzymes.37
Based on RPA and RCA, a visual biosensor for sensitive detection of Fusarium proliferatum assisted by T4 DNA ligase and T5 exonuclease was constructed. The G-quadruplex sequence was added to the 5′-end of primer-F of RPA, which would be at the end of RPA product. To elevate the sensitivity of the biosensor, RPA was coupled to RCA through joining terminals of one strand of the RPA product in the presence of T4 DNA ligase. There was only one probe and no other oligonucleotides in the RCA system after T5 exonuclease degradation, and the visual method was performed with very low background.
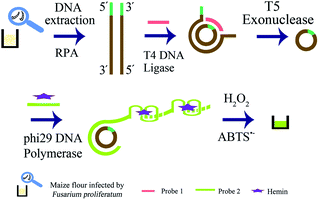
The strategy is shown in Scheme 1, and it included extraction of genomic DNA of F. proliferatum DSM62267 (F120), two rounds of amplification of target DNA, and visual detection. Firstly, genomic DNA was released from the cell wall of F120 by boiling and freezing method. Secondly, dsDNA was produced by RPA reaction with primer-F and primer-R using genomic DNA of F120 in crude extraction as template directly. The trans-complementary sequence of G-quadruplex was added to the 5′-end of primer-F, which would be at one end of RPA product. The 5′-terminal and 3′-terminal of one strand of dsDNA was hybridized with probe 1, and formed a new phosphodiester bond in the presence of T4 DNA ligase. A circular ssDNA was obtained. Then all linear DNAs in the resulting solution were degraded into single nucleotides by T5 exonuclease in 5′ → 3′ direction, and only circular ssDNA remained intact. The RCA reaction was performed using circular ssDNA as template by phi29 DNA polymerase and probe 2, and large weight ssDNA was produced. In the presence of hemin, G-quadruplex DNAzymes in RCA products were constituted to be DNAzyme with peroxidase-like activity. After ABTS2− and H2O2 were added, the resulting solution turned green. However, if there was no F120, no DNA target was amplified by RPA, and the linear DNA were all degraded by T5 exonuclease. No circular ssDNA was produced. So no specific green color was observed in the final solution.
 | ||
| Scheme 1 Schematic illustration of RPA-RCA-assisted dual amplification for visual detection of F. proliferatum. | ||
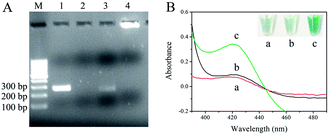
The feasibility of dual amplification of RPA and RCA was checked by 2.5% agarose gel electrophoresis. As shown in Fig. 1A, genomic DNA of F120 in crude solution was used as template for RPA without purification. Products of dsDNA were obtained by primer 1 and primer 2 through RPA (lane 1). Lane 2 was the negative control, and genomic DNA of uncontaminated maize flour was used as template. The 5′-terminal and 3′-terminal of one strand of dsDNA were hybridized with probe 1. When T4 DNA ligase was added, the terminals were joined readily to form a circular ssDNA. Linear DNAs were all degraded into mononucleotides completely (lane 3) and the newborn circle of ssDNA was undamaged in the presence of T5 exonuclease. In the presence of probe 2 and phi29 DNA polymerase, the RCA reaction was performed, and a band with very high molecular weight was observed (lane 4), which was in line with the high efficiency of RCA amplification. The data show that detection of F. proliferatum is feasible using dual-cycle amplification by RPA and RCA. The primers and probes are shown in ESI Table 1.†
To evaluate the feasibility of the visual method, RCA products were incubated with hemin, ABTS2−, and H2O2. The specific green color in the final solution was analyzed by UV-Vis absorption (390–490 nm) (Fig. 1B). There was no absorption peak in the solution containing only hemin, ABTS2− and H2O2 at 420 nm (a), while in the presence of target DNA, a well-defined absorption peak at about 420 nm was observed (c). However, there was no peak in the absence of genomic DNA of F120 (b). Similar to absorption results, specific green color was observed in tube c (Fig. 1B, top right corner), and tube a and tube b were almost colorless. The data show that the RPA-RCA-assisted visual method was feasible for F. proliferatum detection, and the results could simply be observed by naked eyes within two hours.
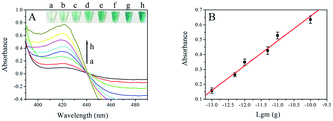
To acquire satisfactory analytical performance, some conditions in the assay needed to be optimized, such as concentration of probe 1, reaction time for ligation and RCA reaction (Fig. S1†). The amount of genomic DNA of F120 was 1 pg. To study the analytical performance of the visual strategy, the amount of F120 amplified DNA was monitored under the optimal conditions by UV-Vis absorption of the final solution. As shown in Fig. 2A, the absorbance increased with the amount of DNA of F120 from 0 to 5 ng. The more F120 DNA was used as template, the more dsDNA was obtained by the RPA reaction and the more circular ssDNA was produced in the presence of T4 DNA ligase and T5 exonuclease. Ultimately amount of G-quadruplex sequences were synthesized by the RCA reaction at constant time resulting in an increased number of hemin/G-quadruplex DNAzymes and an increase in UV–Vis absorption. A linear dependence between the absorbance and the negative logarithm of amount of genomic DNA of F120 was obtained in a range of 0.1 pg to 0.1 ng (Fig. 2 B). The regression equation was A = 0.1661![[thin space (1/6-em)]](https://www.rsc.org/images/entities/char_2009.gif) lg
lg![[thin space (1/6-em)]](https://www.rsc.org/images/entities/char_2009.gif) m + 2.318, with a correlation coefficient of 0.9918, and A and m represent the absorbance of the final solution and the quantity of genomic DNA of F120, respectively. According to the sum of blank response and 3 times standard deviation, the detection limit was calculated to be 0.05 pg. It shows that the proposed strategy could enable ultrasensitive detection of F120. RPA-related detection of Plasmodium falciparum is by lateral flow analysis. The detection limit reached 100 fg of genomic P. falciparum DNA.38 However, the method of lateral flow analysis is rather expensive when a large number of samples need to be tested. In our previous study, the limit of visual detection of Fusarium proliferatum based on asymmetric recombinase polymerase amplification and hemin/G-quadruplex DNAzyme is 0.01 ng. The strategy is simple and cost effective, and it is not very sensitive.25 Though the RPA-RCA-assisted assay has more steps, each reaction could be performed at room temperature or 37 °C. The significant advantage of our strategy is low background. T5 exonuclease digests all linear DNA, and only single stranded circle DNA and probe 2 are in final solution. The assay could detect F. proliferatum in basic lab with high sensitivity and specificity. The color difference between the positive and negative results could be distinguished with the naked eye, and it is very convenient and cost effective compared with that of fluorescence or lateral flow analysis. Sensitivity of the assay was compared with that of other RPA or RCA-related colorimetric methods (ESI Table 2†).
m + 2.318, with a correlation coefficient of 0.9918, and A and m represent the absorbance of the final solution and the quantity of genomic DNA of F120, respectively. According to the sum of blank response and 3 times standard deviation, the detection limit was calculated to be 0.05 pg. It shows that the proposed strategy could enable ultrasensitive detection of F120. RPA-related detection of Plasmodium falciparum is by lateral flow analysis. The detection limit reached 100 fg of genomic P. falciparum DNA.38 However, the method of lateral flow analysis is rather expensive when a large number of samples need to be tested. In our previous study, the limit of visual detection of Fusarium proliferatum based on asymmetric recombinase polymerase amplification and hemin/G-quadruplex DNAzyme is 0.01 ng. The strategy is simple and cost effective, and it is not very sensitive.25 Though the RPA-RCA-assisted assay has more steps, each reaction could be performed at room temperature or 37 °C. The significant advantage of our strategy is low background. T5 exonuclease digests all linear DNA, and only single stranded circle DNA and probe 2 are in final solution. The assay could detect F. proliferatum in basic lab with high sensitivity and specificity. The color difference between the positive and negative results could be distinguished with the naked eye, and it is very convenient and cost effective compared with that of fluorescence or lateral flow analysis. Sensitivity of the assay was compared with that of other RPA or RCA-related colorimetric methods (ESI Table 2†).
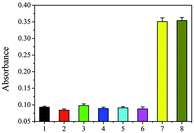
Selectivity of the DNA-based biosensors is essential because of the presence of large amounts of nucleotide fragments from the host and other living organisms. The three fungi of Fusarium equiseti RD13 (F216), F. culmorum 3.37 dus Bomm (F109), and F. avenaceum borm (F112) were choosed as control. In addition, Ralstonia solanacearum and Puccinia sorghi were important and familiar pathogens in corn, and they were also analyzed to verify the specificity of proposed strategy using DNA of these fungi as controls. The amount of genomic DNA of each sample was 5 pg. As shown in Fig. 3, absorbance of the resulting solution from F216 (2), F109 (3), F112 (4), Ralstonia solanacearum (5), and Puccinia sorghi (6) was similar as that of the blank control (1). However, the absorbance originating from F120 was strong (7). In addition, the mix of the genomic DNA of healthy maize and F120 also produced almost the same absorbance (8) as that of F120. The data show that the visual assay has satisfactory selectivity.
PCR-based method is fundamental for nucleic acid amplification. To verify the feasibility of the proposed assay in a real sample test, 4 positive samples and 26 field-collected samples were tested by the proposed strategy and the PCR-based method Primer-F and primer-R are used in the both method. The results show that 11 of 26 field-collected samples contained fungi belonging to F. proliferatum, and the results from the two methods were completely consistent with each other, showing that the RPA-RCA-assisted visual strategy is robust, and could be applied for field tests (Table 1).
| Sample | PCR-based detection | RPA-RCA-assisted detection | ||
|---|---|---|---|---|
| Positive | Negative | Positive | Negative | |
| 4 | 4 | 0 | 4 | 0 |
| 26 | 11 | 15 | 11 | 15 |
The strategy has obvious advantages. By the use of T5 exonuclease and T4 DNA ligase, RPA was coupled to RCA by circulating one strand of the RPA product. The target was amplified twice and could be detected at a concentration as low as 0.05 pg. The RPA and RCA are performed at consistent temperature (42 °C and 30 °C), showing the practical application of the proposed assay. Positive/negative results were easily distinguished with the naked eye through the observation of color differences in the final solution.
In summary, a visual detection of F. proliferatum species by T5 exonuclease and T4 DNA ligase was established. This is the first report on the detection of F. proliferatum in crops by a visual method. With a proper combination of RPA with RCA, the assay achieved high sensitivity, which showed a detection limit of 0.05 pg. The assay also shows the feasibility of this visual biosensor in practical applications. The method was label-free, fairly simple, and general staff could operate it with no need of sophisticated instrumentation. It is also suitable for any other DNA detection such as viruses, bacteria, plants or animals by simply changing the specific primers of target DNA.
Conflicts of interest
There are no conflicts to declare.Acknowledgements
The authors would like to acknowledge the assistance of Professor Petr Karlovsky from University of Goettingen, Germany, for kindly providing strains of F. proliferatum DSM62267, F. equiseti RD13, F. culmorum 3.37 dus Bomm, F. avenaceum borman, and maize flour contaminated with F. proliferatum DSM62267. This work was financially supported by the National Natural Science Foundation of China (31701760, 31901937), Shandong Provincial Major Application Technology Innovation Project, Shandong Provincial National Science Foundation (ZR2018BC037). Epidemic Prevention and Control Special Emergency Foundation of Linyi University (2020YJKY005).Notes and references
- H. K. Abbas, C. J. Mirocha, T. Kommedahl, R. F. Vesonder and P. Golinski, Mycopathologia, 1989, 108, 55–58 CrossRef CAS.
- H. M. Hussein, M. Baxter, I. G. Andrew and R. A. Franich, Mycopathologia, 1991, 113, 35–40 CrossRef CAS.
- P. E. Nelson, R. D. Plattner, D. D. Shackelford and A. E. Desjardins, Appl. Environ. Microbiol., 1992, 58, 984–989 CrossRef CAS.
- G. Mule, A. Susca, G. Stea and A. Moretti, FEMS Microbiol. Lett., 2004, 230, 235–240 CrossRef CAS.
- Y. Wang, B. Li, N. Zhang, D. Xi, J. Liu and H. Zhou, Sens. Actuators, B, 2018, 255, 3488–3494 CrossRef CAS.
- D. Xi, J. Shang, E. Fan, J. You, S. Zhang and H. Wang, Anal. Chem., 2016, 88, 10540–10546 CrossRef CAS.
- D. Xi, X. Wang, S. Ai and S. Zhang, Chem. Commun., 2014, 50, 9547–9549 RSC.
- D. Xi, Z. Li, L. Liu, S. Ai and S. Zhang, Anal. Chem., 2017, 90, 1029–1034 CrossRef.
- Y. Wang, B. Li, J. Liu and H. Zhou, Anal. Bioanal. Chem., 2019, 411, 2915–2924 CrossRef CAS.
- Y. Wang, B. X. Li, J. Liu and H. Zhou, Sens. Actuators, B, 2018, 273, 649–655 CrossRef CAS.
- T. Notomi, H. Okayama, H. Masubuchi, T. Yonekawa, K. Watanabe, N. Amino and T. Hase, Nucleic Acids Res., 2000, 28, E63 CrossRef CAS.
- O. Piepenburg, C. H. Williams, D. L. Stemple and N. A. Armes, PLoS Biol., 2006, 4, e204 CrossRef.
- Z. Crannell, A. Castellanos-Gonzalez, G. Nair, R. Mejia, A. C. White and R. Richards-Kortum, Anal. Chem., 2016, 88, 1610–1616 CrossRef CAS.
- A. A. El Wahed, P. Patel, O. Faye, S. Thaloengsok, D. Heidenreich, P. Matangkasombut, K. Manopwisedjaroen, A. Sakuntabhai, A. A. Sall and F. T. Hufert, PLoS One, 2015, 10, e0129682 CrossRef.
- D. Mondal, P. Ghosh, M. A. A. Khan, F. Hossain, S. Böhlken-Fascher, G. Matlashewski, A. Kroeger, P. Olliaro and A. A. El Wahed, Parasites Vectors, 2016, 9, 281 CrossRef.
- J. Kissenkötter, S. Hansen, S. Böhlken-Fascher, O. G. Ademowo, O. E. Oyinloye, A. S. Bakarey, G. Dobler, D. Tappe, P. Patel and C.-P. Czerny, Anal. Biochem., 2018, 544, 29–33 CrossRef.
- S. A. Subbotin, Nematology, 2019, 21, 243–251 CAS.
- J. Li, J. Macdonald and F. Von Stetten, Analyst, 2019, 144, 31–67 RSC.
- O. W. Stringer, J. M. Andrews, H. L. Greetham and M. S. Forrest, Nat. Methods, 2018, 15, 395 CrossRef.
- R. K. Daher, G. Stewart, M. Boissinot and M. G. Bergeron, Clinical Chemistry, 2016, 62, 947–958 CrossRef CAS.
- M. Munawar, A. Toljamo, F. Martin and H. Kokko, Eur. J. Hortic. Sci., 2019, 84, 14–19 CrossRef.
- R. Wang, F. Zhang, L. Wang, W. J. Qian, C. Qian, J. Wu and Y. B. Ying, Anal. Chem., 2017, 89, 4413–4418 CrossRef CAS.
- P. J. Asiello and A. J. Baeumner, Lab Chip, 2011, 11, 1420–1430 RSC.
- P. M. Lizardi, X. Huang, Z. Zhu, P. Bray-Ward, D. C. Thomas and D. C. Ward, Nat. Genet., 1998, 19, 225–232 CrossRef CAS.
- Y. Wang, X. D. Li, D. M. Xi and X. Q. Wang, RSC Adv., 2019, 9, 37144–37147 RSC.
- C. Hong, A. Baek, S. S. Hah, W. Jung and D. E. Kim, Anal. Chem., 2016, 88, 2999–3003 CrossRef CAS.
- P. Jiang, C. Haji, X. Ye, M. Chang, W. Li, X. He, D. Chen and L. Nie, Nanosci. Nanotechnol. Lett., 2019, 11, 638–644 CrossRef.
- D. Li, W. Cheng, Y. Yan, Y. Zhang, Y. Yin, H. Ju and S. Ding, Talanta, 2016, 146, 470–476 CrossRef CAS.
- T. A. Ceska, J. R. Sayers, G. Stier and D. Suck, Nature, 1996, 382, 90–93 CrossRef CAS.
- Y. Xia, K. Li, J. Li, T. Wang, L. Gu and L. Xun, Nucleic Acids Res., 2019, 47, e15 CrossRef.
- D. M. Kong, W. Yang, J. Wu, C. X. Li and H. X. Shen, Analyst, 2010, 135, 321–326 RSC.
- Y. Wang, J. Liu and H. Zhou, Sensors, 2019, 19, 1298–1309 CrossRef CAS.
- D. Ma, W. Wang, Z. Mao, C. Yang, X. Chen, J. Lu, Q. Han and C. Leung, Anal. Chim. Acta, 2016, 913, 41–54 CrossRef CAS.
- Y. C. Du, H. X. Jiang, Y. F. Huo, G. M. Han and D. M. Kong, Biosens. Bioelectron., 2016, 77, 971–977 CrossRef CAS.
- J. Yin, Y. Liu, S. Wang, J. Deng, X. Lin and J. Gao, Sens. Actuators, B, 2018, 256, 573–579 CrossRef CAS.
- X. Qu, F. Bian, Q. Guo, Q. Ge, Q. Sun and X. Huang, Anal. Chem., 2018, 90, 12051–12058 CrossRef CAS.
- L. Stefan, F. Denat and D. Monchaud, J. Am. Chem. Soc., 2011, 133, 20405–20415 CrossRef CAS.
- S. Kersting, V. Rausch, F. F. Bier and M. von Nickisch-Rosenegk, Malar. J., 2014, 13, 99–107 CrossRef.
Footnotes |
| † Electronic supplementary information (ESI) available. See DOI: 10.1039/d0ra06559e |
| ‡ Ying Wang and Xiaoqiang Wang contributed equally. |
| This journal is © The Royal Society of Chemistry 2020 |


