
 Open Access Article
 This Open Access Article is licensed under a Creative Commons Attribution-Non Commercial 3.0 Unported Licence
The effect of alcohols as vehicles on the percutaneous absorption and skin retention of ibuprofen modified with L-valine alkyl esters†
Paula Ossowicz *a,
Joanna Klebekoa,
Ewa Janusa,
Anna Nowakb,
Wiktoria Duchnikb,
Łukasz Kucharskib and
Adam Klimowiczb
*a,
Joanna Klebekoa,
Ewa Janusa,
Anna Nowakb,
Wiktoria Duchnikb,
Łukasz Kucharskib and
Adam Klimowiczb
aWest Pomeranian University of Technology, Szczecin, Faculty of Chemical Technology and Engineering, Department of Chemical Organic Technology and Polymeric Materials, Piastów Ave. 42, 71-065 Szczecin, Poland. E-mail: possowicz@zut.edu.pl
bPomeranian Medical University in Szczecin, Department of Cosmetic and Pharmaceutical Chemistry, Powstańców Wielkopolskich Ave. 72, 70-111 Szczecin, Poland
First published on 16th November 2020
Abstract
The effect of various alcohols as vehicles on skin permeability was compared for unmodified ibuprofen (IBU) and ion pairs of ibuprofen with L-valine alkyl esters [ValOR][IBU], in which the alkyl chain R was changed from C1 to C8. In vitro permeation experiments were conducted in a Franz cell with porcine skin. Methanol, ethanol, and isopropanol solutions of 70% (v/v) were chosen as vehicles for penetrants and a buffer solution of pH 5.4 or 7.4 as the acceptor phase. The comparisons of permeation profiles for various [ValOR][IBU] from different alcohols were determined. The cumulative mass, skin accumulation, steady-state flux, diffusion coefficient, and lag time were investigated and compared. It was observed that i-propanol was the best enhancer of skin permeation of both unmodified ibuprofen and its salts with L-valine alkyl esters for both acceptor phases. The permeability of the various carriers increases with increasing chain-length of the alcohol. In most cases, significantly higher cumulative mass was found in the acceptor buffer of pH 7.4. The conjugate of ibuprofen with L-valine propyl ester [ValOPr][IBU] permeated the skin to the highest degree in comparison to unmodified ibuprofen. The accumulation of ibuprofen was higher for all salts in relation to the parent acid applied onto the skin. The greatest amounts of ibuprofen were accumulated in the skin when ibuprofen was used as the ionic pair with L-valine butyl ester, [ValOBu][IBU] in the i-propanol solution and pH 7.4 buffer as the acceptor phase.
Introduction
Transdermal drug delivery stands as a convenient route for the administration of active substances since it allows minimization of the first-pass metabolism, avoiding the gastrointestinal degradation, and providing controlled and prolonged drug release into the systemic circulation.1 The skin though, in particular, the stratum corneum (SC) is the major limiting factor for percutaneous absorption of therapeutic agents.2 The SC protects against external toxins and water loss but also acts as a barrier for drug penetration into the skin, which is highly dependent on lipophilicity, molecular size, and solubility of the active substance.3Solvents, such as short-chain alcohols (ethanol, propanol, isopropanol) indicate high enhancing activity but also good solvating power. Therefore, they are frequently used as enhancers and co-solvents for increasing the solubility of lipophilic compounds in aqueous vehicles, improving drug partitioning into a membrane and its thermodynamic activity.4–6 It has been reported that short-chain aliphatic alcohols can relatively enhance skin permeation of active substances when are applied to the drug.7,8 Moreover, it was demonstrated that the rate of adsorption of the drug on the skin and permeability coefficients increased with increasing alcohol chain length. This relationship applies to short-chain alcohols from C1 to C4.9–11
Chandra et al. examined the influence of alcohols as chemical penetration enhancers on the in vitro permeation of ketorolac, the non-steroidal anti-inflammatory drug (NSAID) from hydrogel gel formulation across rat abdominal skin. The hydrogel of a nonionic polymer, methocel K15M (hydroxyl propyl methylcellulose, HPMC) with the addition of various alcohols (ethanol, n-propanol, isopropyl alcohol, n-butanol, n-pentanol, and propylene glycol) was used. The highest permeation coefficient was observed for isopropanol. Moreover, an increase in isopropanol concentration enhanced the permeation of ketorolac.12
Wenkers et al. investigated the skin penetration of series NSAIDs drugs, such as ibuprofen, ketoprofen, naproxen, diclofenac, etc. after application in the light mineral oil as a lipophilic vehicle. They showed that the skin permeability of NSAIDs is a function of hydrophilicity of the drugs, i.e., of their partition coefficients between phosphate buffer saline (pH 7.4) and the lipophilic vehicle, which was log![[thin space (1/6-em)]](https://www.rsc.org/images/entities/char_2009.gif) PPBS/MO = −0.07 for ibuprofen respectively. The experimentally determined skin permeabilities generally increase with increasing hydrophilicity of the NSAIDs. In this case, the viable epidermis instead of the stratum SC became the rate-limiting barrier for the transport of NSAIDs out of a lipophilic vehicle. Authors also revealed that the maximum flux of NSAIDs is primarily dependent on their vehicle solubility.13
PPBS/MO = −0.07 for ibuprofen respectively. The experimentally determined skin permeabilities generally increase with increasing hydrophilicity of the NSAIDs. In this case, the viable epidermis instead of the stratum SC became the rate-limiting barrier for the transport of NSAIDs out of a lipophilic vehicle. Authors also revealed that the maximum flux of NSAIDs is primarily dependent on their vehicle solubility.13
Ibuprofen (IBU), the commonly used drug from the NSAID group has a high potential for application in transdermal systems. However, it is characterized by low solubility (21 mg dm−3 at 25 °C in water) and relative high lipophilicity (logP is in the range of 2.41–4.00 the value depends on the measurement method) which result in its poor permeation through the skin.14–21 Due to the acidic nature (pKa = 4.4), its solubility is dependent on the pH of the environment – it increases with increasing alkalinity: it can vary from 0.024 mg cm−3 (pH = 2.2) to 14.8 mg dm−3 (pH = 9.2). This is closely related to the increase in the ionization degree, which in turn determines the ability of ibuprofen to penetrate the skin. It has been shown that the increased solubility of the ionized molecule reflected in the increased permeability at high pH.22–24
The currently available on the market dermal dosage form of IBU is often prepared from the proper combination of water and alcohol.24,25 However, the composition of the vehicle has a significant influence on the percutaneous absorption of topical IBU preparations.26 IBU moiety is a carboxylic acid, therefore its partition behavior also depends on pKa and ionization state.23 Watkinson et al. investigated the influence of the increasing amount of ethanol as a cosolvent on the solubility, ionization, and permeability of IBU in the human skin. The greater content of ethanol increased the pKa value and the proportion of unionized IBU and diffusion across the skin increased with the content of ethanol in the formulation. The optimal flux was indicated for 50:50 and 75:25 ethanol–water vehicles.27 Additionally, various modifications of the ibuprofen structure are tested to increase ibuprofen solubility and skin permeability. One of the simplest ways is the formation of ibuprofen inorganic salts and ionic pairs with organic bases. In the literature, inorganic salts, such as sodium,28 potassium, calcium, magnesium, aluminum,29 copper,30 zincum,31 and organic – e.g. lizynium,32 ranitidinium, diphenhydraminium,33 benzalkonium, didecyldimethylammonium34 salts. The ibuprofen alkylamine salts were obtained by Sarveiya et al. Those salts were characterized by the higher diffusion through the PDMS (polydimethylsiloxane) membrane compared to the sodium salt.35 Wu et al. reported increased solubility in water of various aromatic, tetra-alkylammonium, and tetra-alkylphosphonium ibuprofen salts, compared to the parent acid and improved skin permeability compared to the ibuprofen sodium. In addition, they showed that tetrahexylammonium and didecyldimethylammonium salts provided more and faster ibuprofen skin permeation.36 Furukawa et al. presented a combination of ibuprofen with proline ethyl ester as the base to form an ionic liquid with increased pig skin permeability.37 Wang et al. presented a new combination of ibuprofen with lidocaine and ethanol in the form of liquid co-crystals in a deep eutectic form.38 The authors proved that both lidocaine and ibuprofen are transported through the model membrane at much higher rates than the corresponding commercially available crystalline salts, i.e. lidocaine chloride and ibuprofen sodium.
In the recent study, we presented the ibuprofen derivatives made by its pairing with some L-valine alkyl esters counterion, which can improve the transport of ibuprofen through porcine skin from ethanol.17 The presented compounds combine the activity of ibuprofen and an amino acid, and thanks to the form of an alkyl ester, they provide increased water solubility and skin permeability. L-Valine was selected for the research due to the fact that it belongs to the essential exogenous amino acids and is involved in many processes in the body for example inhibits musclebuilding protein degradation process, triggers gluconeogenesis, intensifies the secretion of anabolic hormones. Furthermore L-valine is necessary for the synthesis of pantothenic acid.39,40 Therefore, the proposed compounds, apart from the therapeutic effect specific for ibuprofen, can provide a prophylactic and protective effect appropriate for L-valine.
In this study, we compared the effect of three alcohols – methanol, ethanol, and i-propanol, as vehicles, on the skin permeation of ibuprofen paired with L-valine alkyl esters, where alkyl chain was from the methyl (C1) to the octyl (C8). The reason of methanol application in this study was to evaluate the effect of the chain length on the permeability of the compounds obtained. These studies had a scientific, not application, purpose. Obviously, methanol is a toxic compound and will therefore not be used in commercial formulations for skin application. The use of methanol for this type of research is therefore justified, which is confirmed by research conducted by other scientists.41 Moreover, the pH value of the acceptor phase in permeation in vitro tests was set at 5.4 and 7.4 for simulation of the skin surface (stratum corneum) and underlying epidermis and dermis.
Results and discussion
Synthesis, identification, and characterization of the [ValOR][IBU]
Using previously described a three-step method,17 we synthesized salts of ibuprofen with L-valine alkyl esters (Scheme 1). The alkyl chain in the L-valine ester group was extended to methyl, heptyl, and octyl group (R) in comparison to the prior described C2–C6 esters.17 The compounds were obtained in high yields (92–98%) and were identified by 1H and 13C-NMR, FTIR, and elemental analysis (see ESI†). In the first step, the hydrochlorides of L-valine alkyl esters (ValOR·HCl) were synthesized42 by the reaction of the proper alcohol with L-valine and chlorotrimethylsilane (TMSCl) as a chlorinating agent. Then the neutralization of the hydrochloride (ValOR·HCl), using the aqueous ammonia, gave the respective L-valine ester (L-ValOR), which was paired with an equimolar amount of ibuprofen to obtain [ValOR][IBU], without forming any by-products. The high purity of ibuprofen salts was confirmed by the content of individual elements (C, H, N, O) and NMR analysis. Additionally, 1H NMR, 13C-NMR and FTIR spectra confirmed that synthesized compounds were organic salts consisting of L-valine alkyl ester cation and ibuprofenate anion – in the equimolar ratio each ion (see ESI†). The NMR spectra clearly show the ionic structure of the synthesized compounds. Signals for the protons of the protonated amino group (NH3+) of the amino acid ester moiety appeared in CDCl3 at the chemical shift (δ) in the range of 5.08 ppm for [ValOMe][IBU] to 6.03 ppm for [ValOOct][IBU]. The integration of these signals corresponds to the three protons. Moreover, on the 13C-NMR spectra of the obtained compounds, the signal of the carbonyl carbon of ibuprofen is observed at 179 ppm and is shifted about 2 ppm in comparison to the value for this carbon in the parent acid (181.16 ppm).43–45 Also, the FTIR analysis demonstrated the presence of strong bands at ca. 1600 and 1390 cm−1, assigned to the symmetric and asymmetric stretching vibrations of carboxylate anion accordingly. The difference between the frequency values assigned to ν(COO−)sym and ν(COO−)as vibrations is above 200 cm−1.46 Moreover, the absence of the specific, for unprotonated NH2 group, vibrational N–H band at about 3390 and 3320 cm−1 in the FTIR spectra confirmed the formation of ionic structure of the ibuprofen derivatives. Also, the sharp absorption band is observed in the range of 1733–1740 cm−1, which is characteristic of the C![[double bond, length as m-dash]](https://www.rsc.org/images/entities/char_e001.gif) O in the carboxylic group.
O in the carboxylic group.
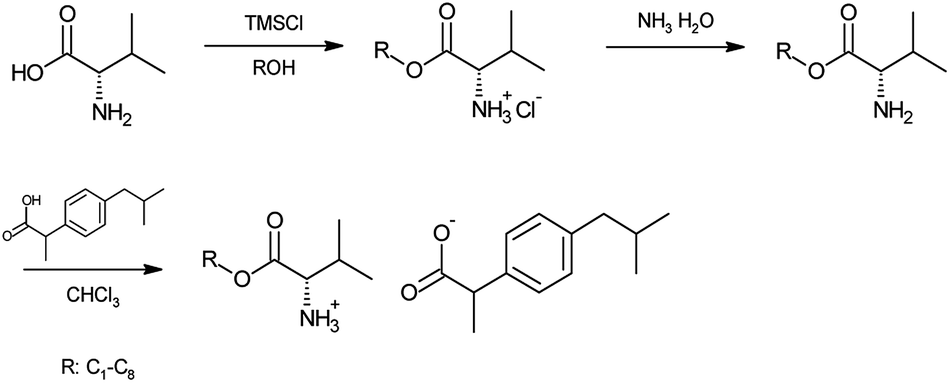 | ||
| Scheme 1 The three-step synthesis of salts of ibuprofen and L-valine alkyl esters. | ||
The obtained ibuprofen salts were white solids with melting points below 100 °C, therefore according to the accepted definition, can be qualified as ionic liquids. The melting point decreased with can be qualified as ionic liquids.
The melting point decreased with the increase in alkyl chain-length in the ester group of the L-valine ester moiety and was the highest for [ValOMe][IBU] (Tm = 89.4 °C), while the lowest for [ValOOct][IBU] (Tm = 62.0 °C) (Table 1). This dependence was also observed in the previously reported study.17 The crystallization temperatures of [ValOR][IBU], defined as the lowest point of the dip on DSC curves, were summarized in Table 1. The crystallization temperature depends on the length of the alkyl chain in the valine alkyl ester cation. The same relationship was observed for the melting point. The longer alkyl chain resulted in a lower crystallization temperature. The highest crystallization temperature was registered for [ValOMe][IBU] (TC = 69.98 °C) while the lowest for [ValOOct][IBU] (TC = 34.95 °C). The conjunction of ibuprofen with the i-propyl ester of L-valine was characterized by about 15 °C higher crystallization temperature than the conjunction with the n-propyl ester (TC = 48.67 °C).
| No. | Compound | Colour | Tm/°C | Tc/°C | Tonset/°C | [α]TD |
|---|---|---|---|---|---|---|
| a Tc – cold crystallization temperature, Tm – melting point, Tonset – the onset of the thermal degradation.b Data for these compounds were earlier reported in ref. 17. | ||||||
| 1 | IBUb | White | 77.51 | — | 189.8 | — |
| 2 | [ValOMe][IBU] | White | 89.40 | 69.98 | 82.9 | +14.933 |
| 3 | [ValOEt][IBU]b | White | 77.99 | 55.20 | 89.5 | +8.867 |
| 4 | [ValOPr][IBU]b | White | 79.81 | 48.67 | 109.5 | +9.760 |
| 5 | [ValOiPr][IBU]b | White | 78.01 | 64.02 | 90.2 | +11.852 |
| 6 | [ValOBu][IBU]b | White | 76.80 | 46.22 | 119.9 | +11.094 |
| 7 | [ValOAm][IBU]b | White | 73.81 | 41.99 | 129.8 | +10.076 |
| 8 | [ValOHex][IBU]b | White | 67.35 | 36.51 | 128.9 | +8.987 |
| 9 | [ValOHept][IBU] | White | 63.30 | 37.51 | 135.7 | +7.678 |
| 10 | [ValOOct][IBU] | White | 62.00 | 34.95 | 151.7 | +8.300 |
The thermal stability of the obtained ibuprofen derivatives was determined by TG analysis. The thermal degradation was estimated based on the Tonset value for the mass loss. All the obtained salts of ibuprofen, [ValOR][IBU] showed lower thermal stability compared to the parent acid, for which Tonset was 189.9 °C (Fig. 1). Moreover, the stability increased with an increase in the length of the alkyl chain in the ester group of the cation. The lowest onset point was demonstrated for ibuprofen salt paired with L-valine methyl ester [ValOMe][IBU] (Tonset = 82.9 °C), while the highest thermal stability was established for the salt with L-valine octyl ester [ValOct][IBU] (Tonset = 151.7 °C).
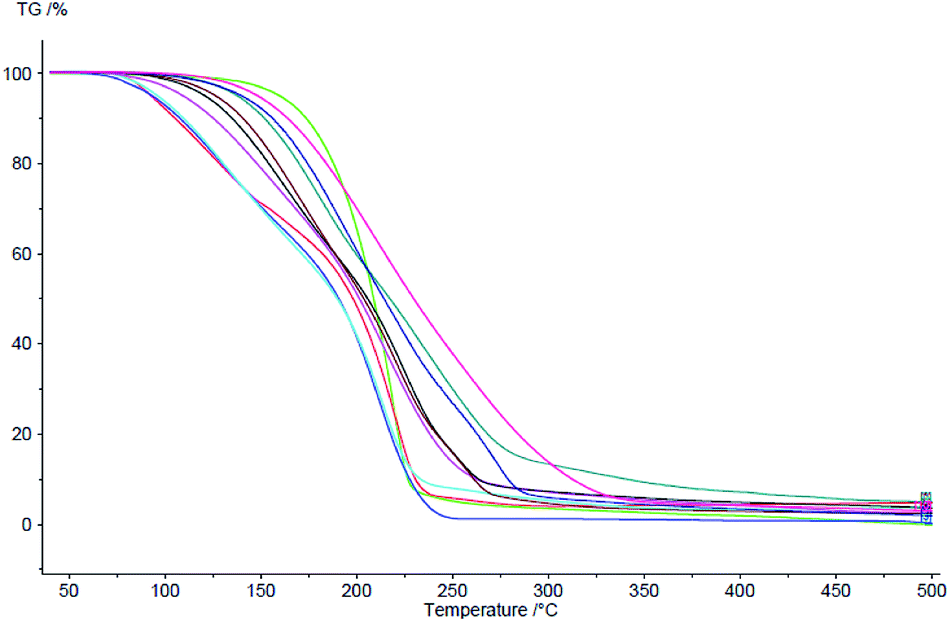 | ||
| Fig. 1 The TG curves of ibuprofen and its L-valine ester derivatives red [ValOMe][IBU]; dark blue [ValOEt][IBU]; light blue [ValOiPr][IBU]; light purple [ValOPr][IBU]; black [ValOBu][IBU]; brown [ValOAm][IBU]; gray blue [ValOHex][IBU]; navy blue [ValOHept][IBU]; dark purple [ValOOct][IBU] and green, IBU. | ||
All of the synthesized ibuprofen salts [ValOR][IBU] have two chiral centers, one in the amino acid cation and one in the ibuprofenate anion. Because they were synthesized from the racemic ibuprofen and pure L-valine enantiomer they reveal optical activity (Table 1). The value of specific rotation was the highest for [ValOMe][IBU], [α]20D = +14.933, while for the rest of the synthesized salts this value was in the range of +7.678 for [ValOHept][IBU] and +11.852 (molar specific rotation: +43.325) for [ValOiPr][IBU].
The solubility of IBU salts was investigated in the selected polar and nonpolar solvents, following the modified Vogel's method at the temperature of 25 °C.47 The obtained results were summarized in Table 2. The solvents were ranked with decreasing value of empirical polarity parameters (ET (30)).48 If the amount of substance dissolved in 1 cm3 was lower than 33 mg, the compound was marked as practically insoluble. The compound was described as partly soluble when amount of 33–100 mg dissolved in 1 cm3 and as soluble, when more than 100 mg of the compound was soluble in 1 cm3.
| No. | Compound | Ethanol (51.9) | DMSO (45.1) | Chloroform (39.1) | Ethyl acetate (38.1) | Diethyl ether (34.5) | Toluene (33.9) | n-Hexane (31.0) |
|---|---|---|---|---|---|---|---|---|
| 1 | IBU (rac) | +17 | +17 | +17 | +17 | +17 | +17 | −17 |
| 2 | [ValOMe][IBU] | + | + | + | + | + | + | − |
| 3 | [ValOEt][IBU] | +17 | +17 | +17 | +17 | +17 | +17 | −17 |
| 4 | [ValOPr][IBU] | +17 | +17 | +17 | ±17 | ±17 | +17 | −17 |
| 5 | [ValOiPr][IBU] | +17 | +17 | +17 | ±17 | ±17 | +17 | −17 |
| 6 | [ValOBu][IBU] | +17 | +17 | +17 | ±17 | ±17 | +17 | −17 |
| 7 | [ValOAm][IBU] | +17 | +17 | +17 | +17 | +17 | +17 | ±17 |
| 8 | [ValOHex][IBU] | +17 | +17 | +17 | +17 | +17 | +17 | +17 |
| 9 | [ValOHept][IBU] | + | + | + | + | + | + | + |
| 10 | [ValOOct][IBU] | + | + | + | + | + | + | + |
This study extended data from the previous work.17 There are an increasing ability of [ValOR][IBU] to dissolve in nonpolar n-hexane with elongation of the alkyl chain in the L-valine ester group. The IBU and [ValOMe][IBU] were insoluble in n-hexane, while salt with [ValOAm] moiety was soluble partly. The novel salts were soluble in ethanol DMSO, chloroform, ethyl acetate, diethyl ether, and toluene. The obtained compounds were used in the skin permeation experiments as alcoholic solutions in concentration of 0.01 g cm−3, which was much lower than their solubility (over 0.100 g per 1 cm3 of 70% alcohol).
The solubility in deionized water and phosphate buffers at 25 °C at pH 5.4 and 7.4 was summarized in Table 3. The obtained results include data obtained in the previous work.17 The saturated concentration of the ibuprofen and its salts was expressed also as the concentration of the active substance. The presence of the amino acid alkyl moiety alters the solubility of the ibuprofen following the before described dependency. The solubility in water and both buffers decrease among with elongation of the carbon chain in the alkyl group and is the lowest for [ValOOct][IBU]. It results from weaker solvation power and stronger intermolecular interaction between the molecules, which requires more energy input.3 However, the [ValOMe][IBU] was characterized by a lower solubility than [ValOEt][IBU] in deionized water and pH 5.4 buffer but comparable at pH 7.4.
| Compound | Solubility in water | Solubility in phosphate buffer | ||||
|---|---|---|---|---|---|---|
| pH = 5.4 | pH = 7.4 | |||||
| g dm−3 | g IBU dm−3 | g dm−3 | g IBU dm−3 | g dm−3 | g IBU dm−3 | |
| IBU (rac) | 0.076 ± 0.001 (ref. 17) | 0.076 ± 0.001 (ref. 17) | 0.082 ± 0.001 (ref. 17) | 0.082 ± 0.001 (ref. 17) | 0.432 ± 0.001 (ref. 17) | 0.432 ± 0.001 (ref. 17) |
| [ValOMe][IBU] | 3.833 ± 0.005 | 2.343 ± 0.005 | 3.929 ± 0.001 | 2.404 ± 0.001 | 4.937 ± 0.022 | 3.018 ± 0.022 |
| [ValOEt][IBU] | 5.542 ± 0.007 (ref. 17) | 3.252 ± 0.007 (ref. 17) | 3.969 ± 0.056 (ref. 17) | 2.329 ± 0.056 (ref. 17) | 5.206 ± 0.044 (ref. 17) | 3.055 ± 0.044 (ref. 17) |
| [ValOPr][IBU] | 4.221 ± 0.033 (ref. 17) | 2.382 ± 0.033 (ref. 17) | 3.057 ± 0.045 (ref. 17) | 1.725 ± 0.045 (ref. 17) | 5.367 ± 0.019 (ref. 17) | 3.029 ± 0.019 (ref. 17) |
| [ValOiPr][IBU] | 3.468 ± 0.007 (ref. 17) | 1.957 ± 0.007 (ref. 17) | 2.350 ± 0.027 (ref. 17) | 1.326 ± 0.027 (ref. 17) | 4.998 ± 0.018 (ref. 17) | 2.821 ± 0.018 (ref. 17) |
| [ValOBu][IBU] | 3.125 ± 0.007 (ref. 17) | 1.699 ± 0.007 (ref. 17) | 2.371 ± 0.016 (ref. 17) | 1.289 ± 0.016 (ref. 17) | 3.089 ± 0.015 (ref. 17) | 1.679 ± 0.015 (ref. 17) |
| [ValOAm][IBU] | 1.798 ± 0.019 (ref. 17) | 0.942 ± 0.019 (ref. 17) | 1.380 ± 0.007 (ref. 17) | 0.723 ± 0.007 (ref. 17) | 1.931 ± 0.008 (ref. 17) | 1.012 ± 0.008 (ref. 17) |
| [ValOHex][IBU] | 1.058 ± 0.002 (ref. 17) | 0.538 ± 0.002 (ref. 17) | 0.759 ± 0.006 (ref. 17) | 0.386 ± 0.006 (ref. 17) | 1.233 ± 0.001 (ref. 17) | 0.627 ± 0.001 (ref. 17) |
| [ValOHept][IBU] | 0.533 ± 0.001 | 0.261 ± 0.001 | 0.401 ± 0.004 | 0.192 ± 0.004 | 0.727 ± 0.002 | 0.356 ± 0.002 |
| [ValOOct][IBU] | 0.300 ± 0.004 | 0.142 ± 0.004 | 0.390 ± 0.001 | 0.190 ± 0.001 | 0.547 ± 0.001 | 0.259 ± 0.001 |
The solubility of an active substance in the buffer of pH 7.4 was higher than in the pH 5.4 buffer. The saturation concentration was in the range between 3.055 g IBU dm−3 for [ValOEt][IBU] and 0.259 g IBU dm−3 for [ValOOct][IBU]. In the pH 5.4 buffer, the solubility was 3.969 g IBU dm−3 for [ValOEt][IBU] and was more than 20-fold lower for salts with [ValOHex][IBU] and [ValOOct][IBU]. The effect of pH on solubility of sodium salt of ibuprofen was presented by Sarveiya et al. (2004),35 showing increase solubility with an increase in the pH value.
Skin permeation and accumulation
In our research in vitro skin penetration studies were conducted using abdomen porcine skin. The porcine skin is frequently used for preliminary evaluation of percutaneous permeation of topically applied drugs due to its similar properties and similar permeability to human skin.49 Porcine skin is considered appropriate as it is very close to human skin from physiological and histological viewpoints.50,51 In vitro penetration of ibuprofen through porcine skin has previously been evaluated in many studies.17,52–55Higher penetration of IBU derivatives through pig skin is confirmed by Furukawa et al., where ibuprofen-ProOEt permeated ten-times higher than for free ibuprofen and variation in skin permeation depends on strong ion-pairing between a cation and an anionic drug.37
In our in vitro study, the penetration of new ibuprofen derivatives was compared with the penetration of parent ibuprofen. The donor phase was a 1% (m/v) solution of the tested compound, which was dissolved in an aqueous solution of methanol, ethanol, or isopropanol (concentration of alcohol was 70% v/v). The acceptor phase was a buffer solution of pH 5.4 or pH 7.4.
The penetration of active compounds, which are topically applied, is restricted by stratum corneum. Lipophilic substances in the skin barrier inhibit the penetration of exogenous therapeutic and cosmetic compounds. Lipophilicity is an indicator that determines the penetration of substances through the skin. The increase in the lipophilicity of the compound could make faster penetration and contributes to achieving the desired therapeutic concentration of the drug.56,57
Modifying the lipophilicity of the compound and selecting the appropriate vehicle could affect, to a large extent, on the penetration of active substances into the skin. Methanol, ethanol, and isopropanol are good solvents, wherein ethanol and isopropanol are often used as a solvent of the topical lipophilic drugs8,58–60. In the present study, the effect of the solvent on the penetration of ibuprofen derivatives and unmodified IBU was also estimated. Into the donor chamber was used 70% of methanol, ethanol, and isopropanol. Krishnaian et al. demonstrated that this concentration of ethanol in ratio ethanol–water 70:30 (v/v) is an optimal vehicle of transepidermal application of the drug.61 Watkinson et al. demonstrated that used ethanol–water 75:25 (v/v) concentration caused the rate of the ibuprofen penetration was the most effective. The author suggests that the decrease of penetration of the substances from concentrated alcohol is caused by dehydration of the skin.27 The permeation of glibenclamide and glipizide increased with the concentration of ethanol, reaching a maximum at 70% (v/v) and then decreasing with further increase concentration to 80% (v/v).62 Ethanol and isopropanol are promoters of transepidermal transport, which has an effect on the effectiveness of penetration of active substances into the skin. They are able to reversibly transform the structure of the laminar system of the lipid matrix of the epidermis, thanks to which they can facilitate accelerate the diffusion of particles by stratum corneum. In addition, ethanol can disrupt the function of the skin barrier by affecting the cells between the cellular cement. This results in loosening the lipid layer and increasing its fluidity and consequently increases the degree of diffusion of active compounds.59,63
Almost for each compound, there is the same tendency of an increase in the cumulative mass of ibuprofen that permeated through the skin, expressed as μg IBU cm−2, with the change of the alcohol as a vehicle, in the sequence from methanol through ethanol to i-propanol, for both acceptors phases pH 5.4 and 7.4 (Table 4). It means, that i-propanol is the best enhancer of skin permeation of both unmodified ibuprofen and its salts with L-valine esters. The exceptions are three salts with the longest chain in ester group ([ValOAm][IBU], [ValOHept][IBU] and [ValOOct][IBU]) that permeated the skin in slightly larger amounts from ethanol than an i-propanol solution to a buffer of pH 7.4 as the acceptor phase and one salt ([ValOPr][IBU]), that the best penetrated the skin from methanol solution to the buffer at pH 5.4.
| Compound | Cumulative mass of IBU, μg IBU cm−2 | |||||
|---|---|---|---|---|---|---|
| pH 7.4 | pH 5.4 | |||||
| MeOH | EtOH | iPrOH | MeOH | EtOH | iPrOH | |
| a *Value is higher significantly from control (ibuprofen) (P < 0.05), **value is higher significantly from control (ibuprofen) (P < 0.001).b Data reported in ref. 17. | ||||||
| IBU | 229.27 ± 5.53 | 302.84 ± 3.63b | 380.11 ± 3.44 | 219.18 ± 0.64 | 240.48 ± 4.85 | 336.10 ± 5.58 |
| [ValOMe][IBU] | 226.49 ± 3.82 | 251.69 ± 16.29 | 290.27 ± 21.81 | 197.25 ± 6.75 | 235.37 ± 12.57 | 265.64 ± 8.35 |
| [ValOEt][IBU] | 200.82 ± 1.62 | 215.19 ± 8.14b | 281.29 ± 19.98 | 203.77 ± 4.16 | 190.01 ± 1.14 | 216.60 ± 1.11 |
| [ValOiPr][IBU] | 296.71 ± 6.39** | 341.20 ± 4.87**b | 410.76 ± 26.72* | 214.86 ± 1.77 | 296.71 ± 5.85** | 352.54 ± 3.97* |
| [ValOPr][IBU] | 373.36 ± 4.79** | 382.35 ± 1.05**b | 411.76 ± 1.78* | 342.41 ± 0.94** | 313.16 ± 3.07** | 307.38 ± 3.08 |
| [ValOBu][IBU] | 260.24 ± 2.18** | 289.74 ± 1.05b | 371.75 ± 14.92 | 248.78 ± 3.89** | 280.22 ± 2.95** | 285.75 ± 5.08 |
| [ValOAm][IBU] | 245.97 ± 6.13* | 308.96 ± 3.77**b | 302.24 ± 5.17 | 207.47 ± 3.08 | 211.20 ± 4.05 | 234.46 ± 7.83 |
| [ValOHex][IBU] | 218.90 ± 11.08 | 249.46 ± 26.06b | 318.66 ± 1.16 | 205.76 ± 5.12 | 216.20 ± 8.68 | 245.55 ± 5.12 |
| [ValOHept][IBU] | 155.60 ± 9.03 | 209.53 ± 15.62 | 197.79 ± 9.58 | 143.81 ± 4.84 | 174.65 ± 6.74 | 181.69 ± 9.08 |
| [ValOOct][IBU] | 150.49 ± 6.17 | 162.28 ± 10.95 | 154.07 ± 6.39 | 149.34 ± 9.92 | 152.08 ± 9.09 | 148.47 ± 6.92 |
Among all the tested salts, the highest IBU cumulative masses, 411.76 μg IBU cm−2 and 410.76 μg IBU cm−2 were reached for the combination of ibuprofen with L-valine propyl ester – [ValOPr][IBU] and L-valine i-propyl ester – [ValOiPr][IBU] respectively, when the buffer pH 7.4 was acceptor phase and the i-propanol solution was the donor phase. For the buffer pH 5.4 as the acceptor phase, the highest IBU cumulative masses were also achieved for the same salts, for [ValOiPr][IBU] from i-propanol (352.54 μg IBU cm−2) and [ValOPr][IBU] from methanol (342.41 μg IBU cm−2). The cumulative masses in these cases were also higher than those obtained for the parent acid used under the respective conditions (Table 2).
Analyzing all used factors as acceptor chamber pH and solvents – the most preferred derivative is for [ValOPr][IBU]. This derivative penetrated the highest degree in comparison with unmodified ibuprofen, as confirmed by the Mann–Whitney test (p = 0.000) (see ESI, Table S4†) and by cluster analysis test (see ESI, Fig. S42†), and a box and whisker plot (see ESI, Fig. S43†).
In our study, significant differences in permeation efficiency were found, depending on the vehicle used (see ESI, Table S5†). Considering the average cumulative mass of the compounds, the permeation from the vehicles used was ranked in the following order: isopropanol > ethanol > methanol. All tested compounds best-penetrated from isopropanol with compared methanol, as confirmed by the Mann–Whitney test (p = 0.000) (see ESI, Table S5 and Fig. S44†).
The selection of an appropriate buffer to acceptor chamber in in vitro studies is very important. It is also very significant to create conditions very similar to those prevailing during in vivo studies. In our study analysis of the release of the drug was done in physiology conditions using the acceptor solution of pH 5.4 and pH 7.4. The first of them is a value similar to pH on the skin surface, the other is a close parameter to conditions in the deeper layers of the skin.64 In our research, in most cases, the significantly higher cumulative mass was in acceptor solution of pH 7.4. Considering all test substances, penetration into the acceptor fluid at pH 7.4 was significantly higher, as confirmed by the Mann–Whitney test (p = 0.001) (see ESI, Table S5 and Fig. S45†).
Moreover, the greatest amounts of ibuprofen, expressed in μg IBU per g of skin, were accumulated in the skin when ibuprofen was used as the ionic pair with L-valine butyl ester, [ValOBu][IBU] and in the i-propanol solution (Table 5). These values were 844.06 μg IBU g −1 and 863.53 μg IBU g−1 for respectively pH 5.4 buffer and pH 7.4 as the acceptor phase. The conjunction [ValOBu][IBU] was also the most accumulated in the skin from methanol and ethanol solution used as a vehicle in the permeation test. Only for the ethanol solution as donor phase and pH 5.4 as the acceptor phase, the highest accumulation was observed for [ValOiPr][IBU] (712.60 μg IBU g−1) (Table 5).
| Compound | Skin accumulation, μg IBU g−1 | |||||
|---|---|---|---|---|---|---|
| pH 7.4 | pH 5.4 | |||||
| MeOH | EtOH | iPrOH | MeOH | EtOH | iPrOH | |
| a *Value is higher significantly from control (ibuprofen) (P < 0.05), **value is higher significantly from control (ibuprofen) (P < 0.001).b Data reported in ref. 17. | ||||||
| IBU | 554.82 ± 59.51 | 745.69 ± 61.87b | 710.36 ± 91.49 | 506.47 ± 56.04 | 580.70 ± 63.80 | 600.97 ± 64.54 |
| [ValOMe][IBU] | 484.87 ± 40.50 | 447.17 ± 90.02 | 512.80 ± 42.16 | 451.50 ± 68.28 | 416.91 ± 39.528 | 469.08 ± 27.88 |
| [ValOEt][IBU] | 472.97 ± 54.40 | 412.19 ± 22.57**b | 599.74 ± 74.75 | 492.19 ± 28.02 | 481.95 ± 100.76 | 602.98 ± 34.06 |
| [ValOiPr][IBU] | 702.31 ± 38.82* | 726.42 ± 63.99**b | 746.13 ± 44.20 | 622.23 ± 122.76* | 712.60 ± 19.84* | 699.28 ± 113.98 |
| [ValOPr][IBU] | 743.30 ± 40.03* | 630.75 ± 34.92**b | 823.06 ± 30.98* | 574.53 ± 56.38 | 702.22 ± 36.01* | 788.16 ± 49.91* |
| [ValOBu][IBU] | 778.50 ± 8.60* | 815.14 ± 32.03*b | 863.53 ± 83.17* | 751.46 ± 79.40* | 617.34 ± 75.34 | 844.06 ± 35.46* |
| [ValOAm][IBU] | 505.50 ± 56.85 | 565.60 ± 37.27b | 591.41 ± 95.30 | 585.21 ± 68.27 | 627.08 ± 67.86 | 546.15 ± 105.15 |
| [ValOHex][IBU] | 512.78 ± 51.99 | 612.86 ± 65.80b | 568.10 ± 16.45 | 482.40 ± 78.66 | 544.44 ± 80.74 | 429.64 ± 21.01 |
| [ValOHept][IBU] | 500.88 ± 37.42 | 556.40 ± 30.70 | 541.89 ± 41.57 | 456.97 ± 21.81 | 526.92 ± 42.39 | 483.07 ± 17.69 |
| [ValOOct][IBU] | 454.95 ± 47.15 | 465.52 ± 23.10 | 478.61 ± 30.98 | 504.84 ± 47.56 | 482.22 ± 41.59 | 447.65 ± 50.47 |
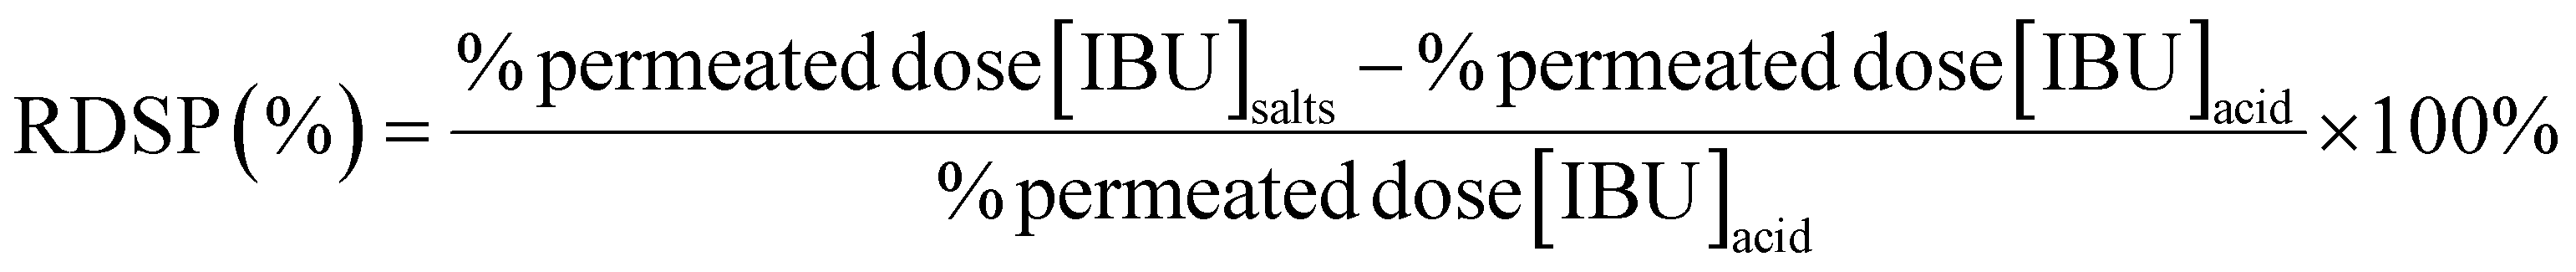
Due to the decreasing dose of ibuprofen applied to the skin along with the longer alkyl chain in the L-valine ester cation, both the cumulative mass of the permeated ibuprofen and its accumulation in the skin were expressed in % of applied IBU dose. These values for individual salts were compared in the relation to that obtained for the parent acid applied and were expressed as the relative differences in skin permeation (RDSP) and skin accumulation (RDSA) of ibuprofen.
The relative percentage differences in IBU skin permeation (RDSP) in each vehicle (MeOH, EtOH, iPrOH) and pH value of the acceptor phase were calculated as follows:
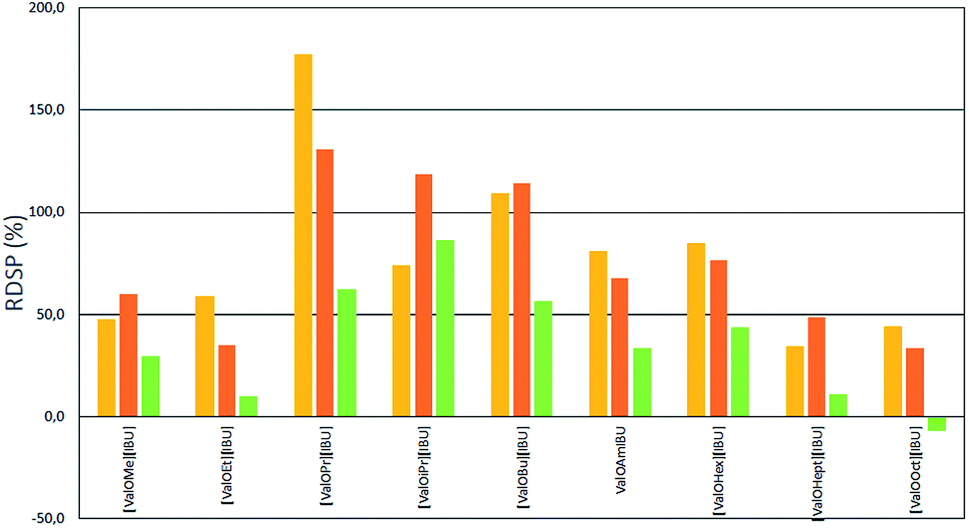 | ||
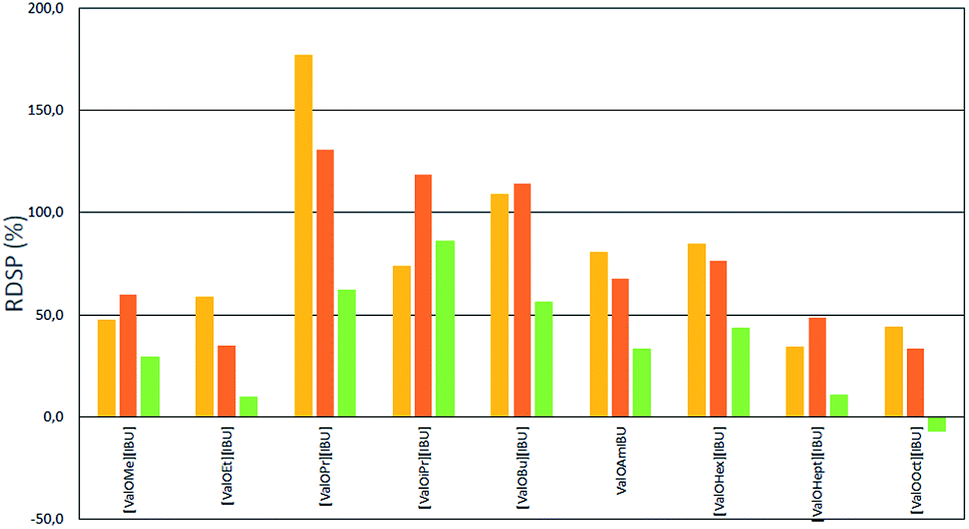
| Fig. 2 The relative percentage differences in skin permeation of ibuprofen in the form of salt versus the parent acid form from different alcohols (yellow – methanol; orange – ethanol; green – isopropanol) (buffer pH 5.4 as the acceptor phase). | ||
 | ||
| Fig. 3 The relative percentage differences in skin permeation of ibuprofen in the form of salt versus the parent acid form from different alcohols (yellow – methanol; orange – ethanol; green – isopropanol) (buffer pH 7.4 as the acceptor phase). | ||
The relative percentage differences in IBU skin accumulation (RDSA) in each vehicle (MeOH, EtOH, iPrOH) and pH value of the acceptor phase were calculated as follows:

As shown in Fig. 2 and 3, the application of L-valine ester ibuprofen salts in each of the alcohol solutions as vehicles led to a significant increase in the skin permeation of ibuprofen in comparison to ibuprofen applied in the acid form in the same vehicle. However, the highest RDSPs were found in methanol and ethanol solutions. When buffer pH 5.4 was used as the acceptor phase, high RDSP values, above 100% were found in permeation test from ethanol solution as a vehicle for [ValOiPr][IBU] and both methanol and ethanol solution for [ValOPr][IBU] and [ValOBu][IBU]. However, when buffer pH 7.4 was used as acceptor phase, RDSP above 100% were observed from methanol solution as vehicle for [ValOPr][IBU], [ValOiPr][IBU], [ValOBu][IBU] and [ValOAm][IBU] and from ethanol for [ValOPr][IBU] and [ValOiPr][IBU]. The highest relative percentage difference in skin permeation was observed for [ValOPr][IBU] (RDSP 170%) and [ValOiPr][IBU] (RDSP 180%) in the system of methanol/buffer pH 5.4 and methanol/buffer pH 7.4 respectively. The lowest RDSP values, below 50%, were found in permeation test, from different alcohols as vehicles, for a combination of ibuprofen with the shortest (methyl and ethyl) and longest (heptyl and octyl) alkyl esters of L-valine. Particularly low differences in the increase of permeation of salts in relation to parent acid (RDSP values 5–25%), were determined when i-PrOH was used in the donor phase. RDSP values below zero for [ValOOct][IBU] mean that ibuprofen has permeated with a lower dose when used as [ValOOct][IBU] than as unmodified acid.
As shown in Fig. 4 and 5 the accumulation of ibuprofen was higher for all salts in relation to parent acid applied onto the skin. But the highest relative percentage differences in IBU skin accumulation (RDSA) were found for methanol and ethanol as vehicles. Comparing data presented in Fig. 4 with data for the same salt and vehicle in Fig. 6, the higher RDSA values were observed for buffer pH 5.4 than pH 7.4 as the acceptor phase. This means that at a higher pH of the acceptor phase, the differences in the accumulation of ibuprofen as salt and unmodified acid are smaller than at a lower pH. This may be due to the better solubility of ibuprofen and the smaller differences between the solubility of ibuprofen and its salts at higher pH.17 When buffer pH 5.4 was used as the acceptor phase, the highest RDSA values (above 150%) were found in skin permeation of [ValOPr][IBU], [ValOiPr][IBU] from ethanol and [ValOBu][IBU] and [ValOAm][IBU] from methanol.
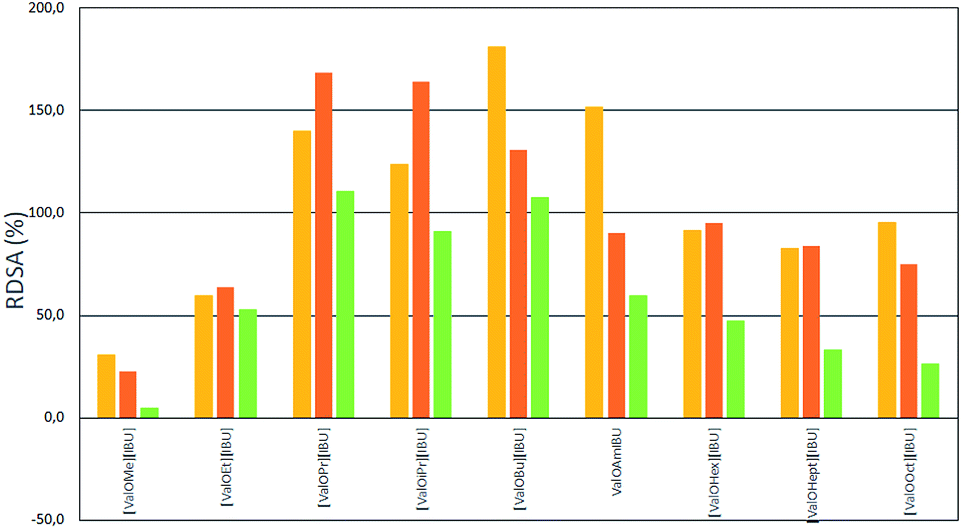 | ||
| Fig. 4 The relative percentage differences in skin accumulation of ibuprofen (expressed as % IBU applied dose) in the form of salt versus the parent acid form from different alcohols (yellow – methanol; orange – ethanol; green – isopropanol) (buffer pH 5.4 as the acceptor phase). | ||
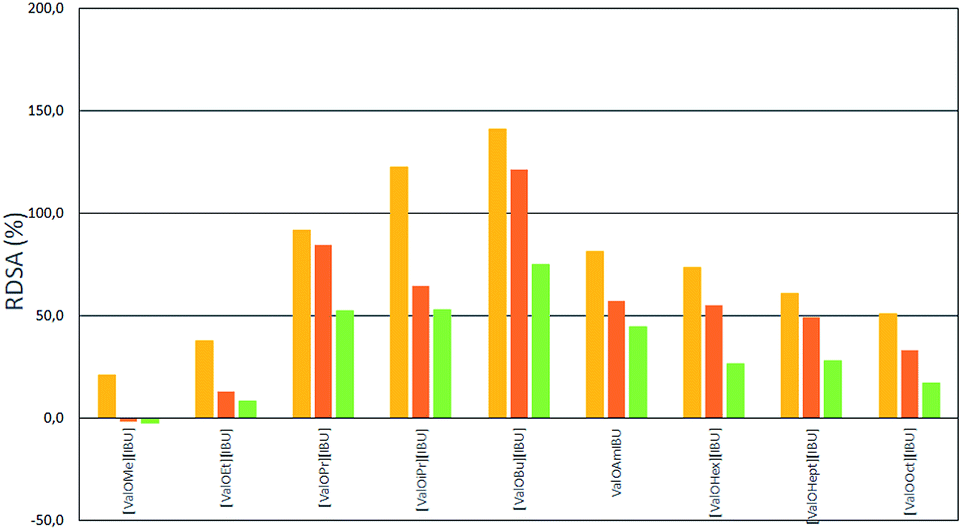 | ||
| Fig. 5 The relative percentage differences in skin accumulation of ibuprofen (expressed as % IBU applied dose) in the form of salt versus the parent acid form from different alcohols (yellow – methanol; orange – ethanol; green – isopropanol) (buffer pH 7.4 as the acceptor phase). | ||
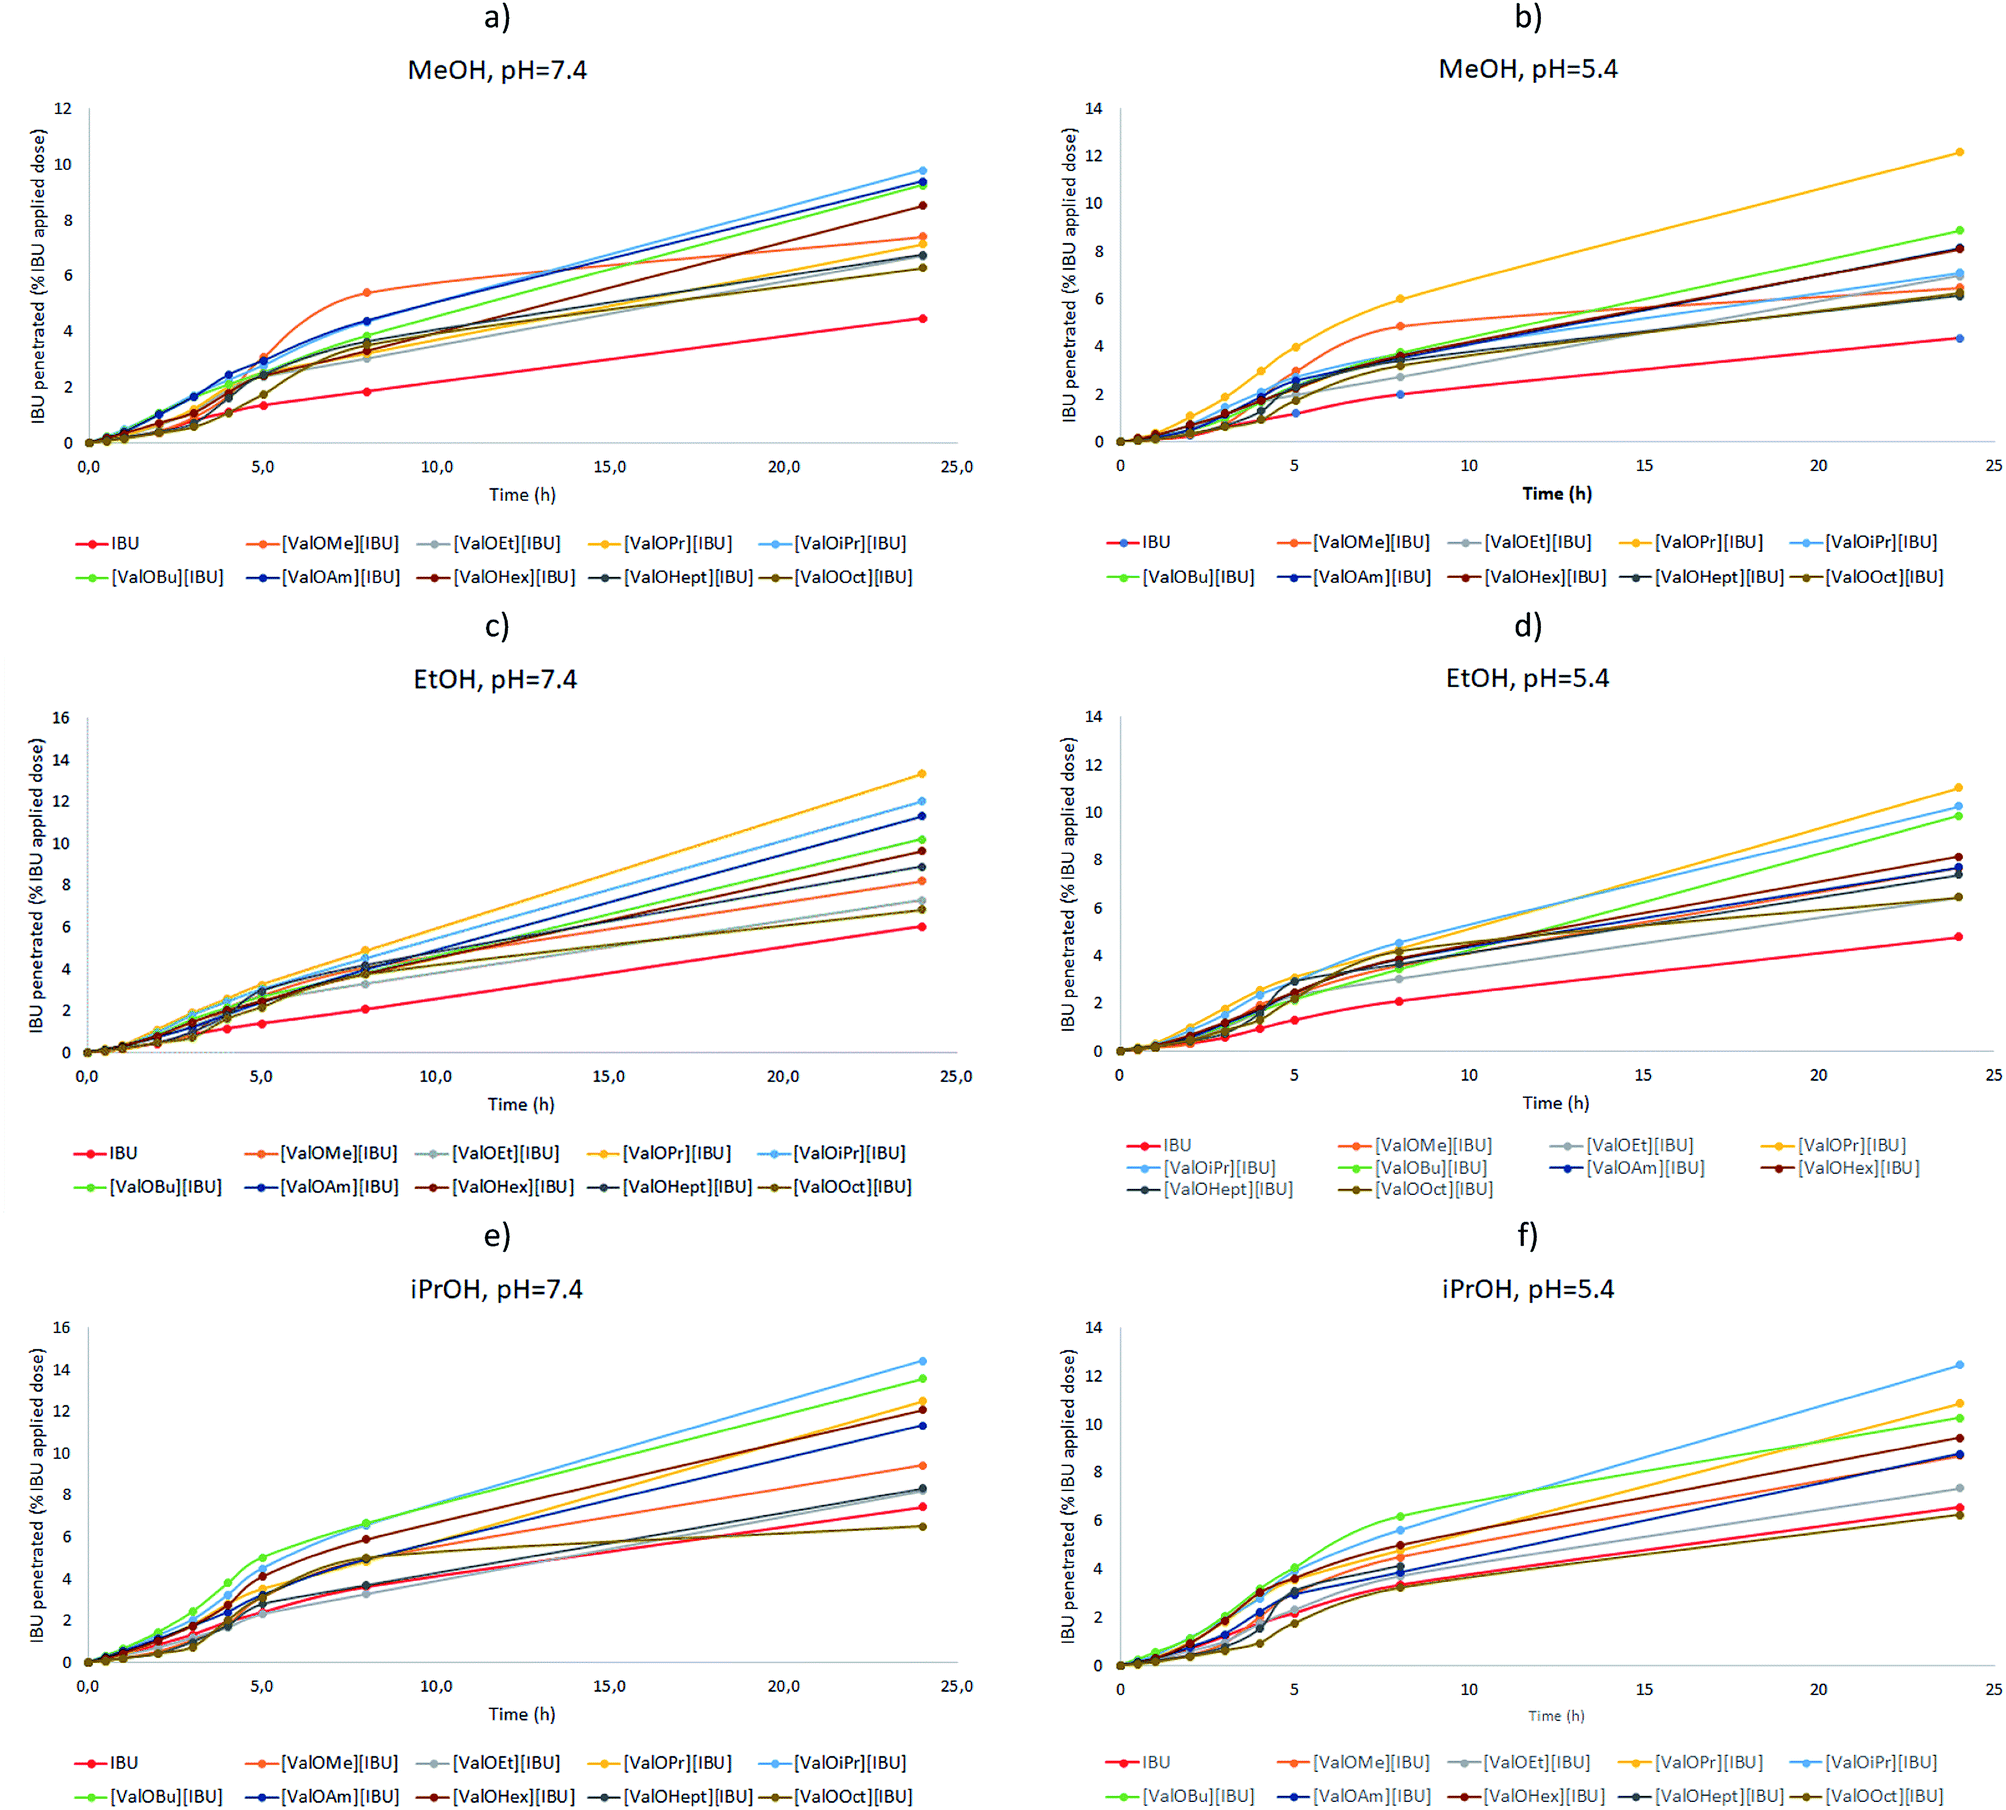 | ||
| Fig. 6 The comparison of in vitro permeation profiles for different [ValOR][IBU] from methanol (a and b), ethanol (c and d), and i-propanol (e and f) solution to buffer solution of pH 5.4 (b, d and f) or 7.4 (a, c and e) as the acceptor phase. | ||
The profiles of ibuprofen permeation expressed in % of applied IBU dose are presented in Fig. 6 and compared for ibuprofen and its salts from different alcohols. All solutions permeated 5–15% of their drug content after 24 h. As can be seen from Fig. 6, the permeation of ibuprofen from each vehicle was biphasic, with an initial faster permeation followed by a period of slow-permeation. All solutions showed a slowdown permeation of ibuprofen after 4–5 h. The application of salts gives higher amounts of the permeated ibuprofen than the use of unmodified ibuprofen. For the acceptor phase of pH 7.4 after 24 h, between 6.51% and 14.59% (isopropanol solution); 6.85% and 13.55% (ethanolic solution) and 6.36% and 13.23% (methanolic solution) of ibuprofen was permeated to the acceptor phase, while for unmodified ibuprofen for only 7.60; 6.60 and 4.59%, respectively. Similarly, in the case of the acceptor phase with pH 5.4 after 24 h, it was between 6.27% and 12.49% (isopropanol solution); 6.24% and 11.10% (ethanolic solution) and 6.31% and 12.13% (methanolic solution) of ibuprofen were permeated to the acceptor phase, while for unmodified ibuprofen for only 6.72; 4.81 and 4.38%, respectively (see ESI, Table S6†). The profiles of ibuprofen permeation are very useful to obtain the permeation parameters such as the steady-state permeation flux, the diffusion coefficient, and the time required to reach steady-state permeation (lag time).
Permeation parameters
The maximum flux through the skin may occur at a pH where ibuprofen ionization is high, therefore the optimum topical formulations may not be for the free acid moiety. The total flux will result from diffusion of both the ionized and unionized species.23,24 The maximum flux is the function of the permeability coefficient and solubility of the penetrant. The solubility often increases more than the permeability decreases with the increasing ionization of drug.The fluxes of the ten penetrants across pig epidermis from the three vehicles into acceptor fluid with two different pH were established. A summary of the permeability parameters (steady-state fluxes, permeability coefficients, and lag time for the permeation of ibuprofen and its salts from methanolic, ethanolic and isopropanolic solution into acceptor phase at pH 7.4) for ibuprofen and its derivatives from different vehicles is shown in Table 6 (results from acceptor fluid at pH 7.4) and Table 7 (pH 5.4). Lag time (LT) was determined by extrapolating the equation. The steady-state fluxes (JSS) of ibuprofen and its derivatives through the skin were calculated from the slope of the plot of cumulative mass in the acceptor phase over time and were expressed as the amount active ibuprofen per skin area and time (μg IBU cm−2 h−1). In all solvent used, the highest rate of permeation of ibuprofen by connecting it with [ValOMe][IBU] and was 26.42, 27.82, and 33.10 μg IBU cm−2 h−1 in the system of methanol, ethanol, and isopropanol/buffer pH 7.4 respectively, and was 33.24, 25.12 and 31.70 μg IBU cm−2 h−1 in the system of methanol, ethanol, and isopropanol/buffer pH 5.4 respectively.
| Compound | MeOH, pH 7.4 | EtOH, pH 7.4 | iPrOH, pH 7.4 | ||||||
|---|---|---|---|---|---|---|---|---|---|
| JSS, μg IBU cm−2 h−1 | KP × 103, cm h−1 | LT, h | JSS, μg IBU cm−2 h−1 | KP × 103, cm h−1 | LT, h | JSS, μg IBU cm−2 h−1 | KP × 103, cm h−1 | LT, h | |
| IBU | 16.45 | 1.61 | 0.69 | 15.83 | 1.58 | 0.49 | 26.28 | 2.57 | 0.34 |
| [ValOMe][IBU] | 26.42 | 5.40 | 2.25 | 27.82 | 4.52 | 1.90 | 33.10 | 4.29 | 1.62 |
| [ValOEt][IBU] | 17.91 | 3.00 | 0.97 | 17.63 | 2.99 | 0.87 | 18.25 | 2.66 | 0.77 |
| [ValOiPr][IBU] | 18.24 | 3.37 | 1.07 | 20.41 | 3.56 | 0.42 | 27.58 | 4.18 | 0.77 |
| [ValOPr][IBU] | 17.14 | 2.83 | 0.05 | 19.36 | 3.41 | 0.50 | 30.66 | 5.39 | 0.94 |
| [ValOBu][IBU] | 14.59 | 2.60 | 0.02 | 17.18 | 3.03 | 0.54 | 33.15 | 6.05 | 0.88 |
| [ValOAm][IBU] | 17.29 | 3.30 | 0.45 | 14.88 | 2.72 | 0.70 | 18.59 | 3.48 | 0.47 |
| [ValOHex][IBU] | 17.20 | 3.35 | 1.37 | 14.32 | 2.77 | 0.48 | 30.94 | 5.86 | 1.56 |
| [ValOHept][IBU] | 24.12 | 4.38 | 2.19 | 20.95 | 4.92 | 2.08 | 19.52 | 3.96 | 1.63 |
| [ValOOct][IBU] | 14.11 | 2.95 | 2.09 | 17.34 | 3.65 | 1.95 | 28.13 | 5.93 | 2.36 |
| Compound | MeOH, pH 5.4 | EtOH, pH 5.4 | iPrOH, pH 5.4 | ||||||
|---|---|---|---|---|---|---|---|---|---|
| JSS, μg IBU cm−2 h−1 | KP × 103, cm h−1 | LT, h | JSS, μg IBU cm−2 h−1 | KP × 103, cm h−1 | LT, h | JSS, μg IBU cm−2 h−1 | KP × 103, cm h−1 | LT, h | |
| IBU | 15.43 | 1.53 | 1.00 | 16.92 | 1.69 | 1.22 | 25.34 | 2.47 | 0.56 |
| [ValOMe][IBU] | 33.24 | 5.46 | 2.29 | 25.12 | 4.10 | 1.68 | 31.70 | 5.15 | 2.09 |
| [ValOEt][IBU] | 16.27 | 2.78 | 0.94 | 17.88 | 3.03 | 1.24 | 17.23 | 2.92 | 1.10 |
| [ValOiPr][IBU] | 27.66 | 4.91 | 0.96 | 19.98 | 3.52 | 0.50 | 25.02 | 4.41 | 0.91 |
| [ValOPr][IBU] | 19.90 | 3.55 | 0.81 | 20.36 | 3.51 | 0.79 | 25.92 | 4.57 | 0.84 |
| [ValOBu][IBU] | 17.55 | 3.27 | 1.26 | 15.45 | 2.72 | 1.01 | 27.66 | 4.97 | 0.89 |
| [ValOAm][IBU] | 17.61 | 3.45 | 1.26 | 17.22 | 3.14 | 1.16 | 19.92 | 3.72 | 1.08 |
| [ValOHex][IBU] | 13.06 | 2.57 | 0.62 | 15.99 | 3.01 | 0.97 | 24.11 | 4.64 | 0.89 |
| [ValOHept][IBU] | 19.61 | 4.02 | 2.20 | 26.83 | 5.45 | 2.41 | 28.45 | 5.80 | 2.46 |
| [ValOOct][IBU] | 19.60 | 4.14 | 2.86 | 15.82 | 3.35 | 1.84 | 23.97 | 5.04 | 2.15 |
This derivative showed the fastest permeation of the skin. Moreover, the permeability coefficient (KP), equal to the diffusion coefficient divided by the width of the membrane expressed in units of cm s−1 was also determined. This coefficient is a quantitative measure of the rate at which a molecule can cross a skin. Comparing these values, the best medium is generally isopropanol. The pH of the acceptor fluid also affects the KP value. Usually, these substances penetrate better into the acceptor fluid with a higher pH. Best permeation parameters including the highest permeation coefficient and the highest steady-state flux have [ValOMe][IBU] which penetrated from MeOH to acceptor at pH 5.4, and the lowest [ValOEt][IBU] which penetrated from iPrOH to acceptor at pH 7.4. The KP values were 3.6 and 1.2 times higher, and JSS values were 2.2 times higher and 1.5 times lower, respectively. The lag time is especially higher than ibuprofen for derivatives containing a long (C6–C8) or short (C1) alkyl-chain in the ester group. No relationship was found between the structure of the analyzed compound and permeation parameters.
Experimental section
Materials
All reagents were commercially available materials and were used without further purification. (RS)-Ibuprofen (99%) was obtained from Acros Organics (Geel, Belgium). L-Valine (≥99%) was purchased from Carl Roth (Karlsruhe, Germany). Trimethylsilyl chloride (≥99%) (TMSCl) was provided by Sigma-Aldrich (Steinheim am Albuch, Germany). Methanol (MeOH), ethanol (EtOH), propan-2-ol (iPrOH), propan-1-ol (PrOH), butan-1-ol (BuOH), pentan-1-ol (AmOH), hexan-1-ol (HexOH), heptan-1-ol (HeptOH), acetic acid, potassium chloride, sodium chloride, orthophosphoric acid (98%), diethyl ether was high purity obtained from Chempur (Gliwice, Poland). Ammonium hydroxide solution 25% (NH3·H2O) was of analytical grade purchased from StanLab (Lublin, Poland). Acetonitrile (≥99.9%) for HPLC gradient grade and n-octanol (≥99%) were provided by Sigma-Aldrich (Steinheim am Albuch, Germany). Disodium hydrogen phosphate dihydrate (≥99%) (Na2HPO4·2H2O), disodium hydrogen phosphate dodecahydrate (99%) (Na2HPO4·12H2O) were provided by Fisher Bioreagents (Pittsburgh, Pennsylvania, USA) and sodium dihydrogen phosphate anhydrous (98%) (NaH2PO4) was obtained from Acros Organics (Geel, Belgium). Potassium dihydrogen phosphate anhydrous (99%) was obtained from Merck (Darmstadt, Germany). Deuterated chloroform (CDCl3) (99.8%) (+0.03% TMSCl) was purchased from Eurisotop (Cheshire, England).Synthesis of the ibuprofen derivatives
General analytical methods
The solubility of ibuprofen and L-valine alkyl ester salts was evaluated in deionized water and phosphate buffers (pH 5.4 and 7.4) at 25 °C and phosphate buffers at 32 °C. The saturated solutions were prepared by adding the access of the substance to 2 cm3 proper solvent in the screwed vial. The mixture was stirred vigorously at 25.00 ± 0.05 °C or 32.00 ± 0.05 °C, for 24 hours and subsequently centrifuged at the respective temperature. The liquid above was separated and diluted. The concentration of the substance was determined by HPLC method.
Permeation and skin accumulation studies
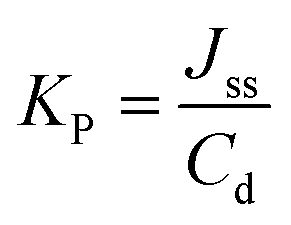
The experiment was carried for 24 hours. At each time point (0.5 h, 1 h, 2 h, 3 h, 4 h, 5 h, 8 h, and 24 h) 0.300 cm3 samples of receptor solution were withdrawn and the chamber refilled with fresh buffer at the same pH. The drug concentration in the acceptor phase was measured by the HPLC method. The cumulative mass (μg cm−2) was calculated based on this concentration. The steady-state flux – JSS (in μg cm−2 h−1) of the active drug – ibuprofen and its derivatives through the skin into acceptor fluid was determined as the slope of the plot of cumulative mass in the acceptor fluid versus time. Within the steady-state period, the flux is constant and can be determined as the slope of the linear regression of the permeated amount in the function of time. The diffusion coefficients (KP) were determined by the following equation using Fick's law of diffusion:
Accumulation of the ibuprofen in the skin was calculated by dividing the amount of the drug remaining in the skin by a mass of skin sample and was expressed in mass of ibuprofen per mass of the skin (μg g−1).
Conclusions
The ionic pairs of ibuprofen with the biocompatible counterions of L-valine alkyl ester, where the alkyl chain was between methyl and octyl, have better penetration through porcine skin compared to the starting acid. It was noticed that different vehicles and pH of the acceptor phase have influences on ibuprofen transport through porcine skin. Permeability tests through porcine skin have shown that [ValOiPr][IBU] shows the best ibuprofen permeability, regardless of the vehicle used. This study showed that newly developed ibuprofen modifications could be promising active ingredients into formulations applied to the skin and employed as an ideal alternative to commercial ibuprofen. No relationship was found between the solubility of ibuprofen and its L-valine derivatives in water and phosphate buffers and skin accumulation.Conflicts of interest
There are no conflicts to declare.References
- A. Alkilani, M. T. McCrudden and R. Donnelly, Pharmaceutics, 2015, 7, 438–470 CrossRef CAS.
- H. A. E. Benson, in Topical and Transdermal Drug Delivery, ed. H. A. E. Benson and A. C. Watkinson, John Wiley & Sons, Inc., Hoboken, NJ, USA, 2012, pp. 1–22 Search PubMed.
- M. E. Lane, P. Santos, A. C. Watkinson and J. Hadgraft, in Topical and Transdermal Drug Delivery, ed. H. A. E. Benson and A. C. Watkinson, John Wiley & Sons, Inc., Hoboken, NJ, USA, 2012, pp. 23–42 Search PubMed.
- N. Dragicevic, J. P. Atkinson and H. I. Maibach, in Percutaneous Penetration Enhancers Chemical Methods in Penetration Enhancement: Modification of the Stratum Corneum, ed. N. Dragicevic and H. I. Maibach, Springer Berlin Heidelberg, Berlin, Heidelberg, 2015, pp. 11–27 Search PubMed.
- C. M. Heard, in Percutaneous Penetration Enhancers Chemical Methods in Penetration Enhancement, ed. N. Dragicevic and H. I. Maibach, Springer Berlin Heidelberg, Berlin, Heidelberg, 2015, pp. 151–172 Search PubMed.
- A. Schroeter, A. Eichner, J. Mueller and R. H. H. Neubert, in Percutaneous Penetration Enhancers Chemical Methods in Penetration Enhancement: Modification of the Stratum Corneum, ed. N. Dragicevic and H. I. Maibach, Springer Berlin Heidelberg, Berlin, Heidelberg, 2015, pp. 29–37 Search PubMed.
- D. Horita, I. Hatta, M. Yoshimoto, Y. Kitao, H. Todo and K. Sugibayashi, Biochim. Biophys. Acta, Biomembr., 2015, 1848, 1196–1202 CrossRef CAS.
- A. Zhang, E.-C. Jung, H. Zhu, Y. Zou, X. Hui and H. Maibach, Toxicol. Ind. Health, 2017, 33, 416–425 CrossRef CAS.
- C. Y. Goates and K. Knutson, Biochim. Biophys. Acta, Biomembr., 1994, 1195, 169–179 CrossRef CAS.
- H. V. Ly and M. L. Longo, Biophys. J., 2004, 87, 1013–1033 CrossRef CAS.
- S. C. McKarns, C. Hansch, W. S. Caldwell, W. T. Morgan, S. K. Moore and D. J. Doolittle, J. Appl. Toxicol., 1997, 36, 62–70 CrossRef CAS.
- A. Chandra, P. Sharma and R. Irchhiaya, Asian J. Pharm., 2009, 3, 37 CrossRef.
- B. P. Wenkers and B. C. Lippold, J. Pharm. Sci., 1999, 88, 1326–1331 CrossRef CAS.
- A. Avdeef, K. J. Box, J. E. A. Comer, C. Hibbert and K. Y. Tam, Pharm. Res., 1998, 15, 209–215 CrossRef CAS.
- G. Bouchard, A. Galland, P.-A. Carrupt, R. Gulaboski, V. Mirčeski, F. Scholz and H. H. Girault, Phys. Chem. Chem. Phys., 2003, 5, 3748–3751 RSC.
- A. Czyrski, J. Chem., 2019, 2019, 1–6 CrossRef.
- E. Janus, P. Ossowicz, J. Klebeko, A. Nowak, W. Duchnik, Ł. Kucharski and A. Klimowicz, RSC Adv., 2020, 10, 7570–7584 RSC.
- Clarke's analysis of drugs and poisons: in pharmaceuticals, body fluids and postmortem material, ed. A. C. Moffat, M. D. Osselton, B. Widdop and J. Watts, Pharmaceutical Press, London, Chicago, 4th edn, 2011 Search PubMed.
- A. Pyka, J. Liq. Chromatogr. Relat. Technol., 2009, 32, 723–731 CrossRef CAS.
- T. Scheytt, P. Mersmann, R. Lindstädt and T. Heberer, Water, Air, Soil Pollut., 2005, 165, 3–11 CrossRef CAS.
- F. Stuer-Lauridsen, M. Birkved, L. P. Hansen, H.-C. Holten Lützhøft and B. Halling-Sørensen, Chemosphere, 2000, 40, 783–793 CrossRef CAS.
- J. Hadgraft, J. du Plessis and C. Goosen, Int. J. Pharm., 2000, 207, 31–37 CrossRef CAS.
- J. Hadgraft and C. Valenta, Int. J. Pharm., 2000, 200, 243–247 CrossRef CAS.
- A. Patel, M. Bell, C. O'Connor, A. Inchley, J. Wibawa and M. E. Lane, Int. J. Pharm., 2013, 457, 9–13 CrossRef CAS.
- J. Irvine, A. Afrose and N. Islam, Drug Dev. Ind. Pharm., 2018, 44, 173–183 CrossRef CAS.
- J. Hadgraft, M. Whitefield and P. H. Rosher, Skin Pharmacol. Physiol., 2003, 16, 137–142 CrossRef CAS.
- R. M. Watkinson, C. Herkenne, R. H. Guy, J. Hadgraft, G. Oliveira and M. E. Lane, Skin Pharmacol. Physiol., 2009, 22, 15–21 CrossRef CAS.
- Strides Research and Specialty Chemicals Limited, US007084.299B2, 2006.
- Supported ionic liquids: fundamentals and applications, ed. R. Fehrmann, Wiley-VCH, Weinheim, 2014 Search PubMed.
- A. L. Abuhijleh, J. Inorg. Biochem., 1994, 55, 255–262 CrossRef CAS.
- H. Abu Ali, S. N. Omar, M. D. Darawsheh and H. Fares, J. Coord. Chem., 2016, 69, 1110–1122 CrossRef CAS.
- Merck & Co., Inc., US005200558A, Rahway, N.J., 1993.
- C. P. Frizzo, K. Wust, A. Z. Tier, T. S. Beck, L. V. Rodrigues, R. A. Vaucher, L. P. Bolzan, S. Terra, F. Soares and M. A. P. Martins, RSC Adv., 2016, 6, 100476–100486 RSC.
- W. L. Hough and R. D. Rogers, Bull. Chem. Soc. Jpn., 2007, 80, 2262–2269 CrossRef CAS.
- V. Sarveiya, J. F. Templeton and H. A. E. Benson, J. Pharm. Pharmacol., 2004, 56, 717–724 CrossRef CAS.
- H. Wu, Z. Deng, B. Zhou, M. Qi, M. Hong and G. Ren, J. Mol. Liq., 2019, 283, 399–409 CrossRef CAS.
- S. Furukawa, G. Hattori, S. Sakai and N. Kamiya, RSC Adv., 2016, 6, 87753–87755 RSC.
- H. Wang, G. Gurau, J. Shamshina, O. A. Cojocaru, J. Janikowski, D. R. MacFarlane, J. H. Davis and R. D. Rogers, Chem. Sci., 2014, 5, 3449 RSC.
- M. Kohlmeier, Nutrient Metabolism, Academic Press, San Diego, CA, USA, 2003 Search PubMed.
- V. Buddolla, Recent Developments in Applied Microbiology and Biochemistry, Academic Press, 2019 Search PubMed.
- M. S. Roberts and W. Kenneth, Dermal Absorption and Toxicity Assessment, CRP Press Taylor & Francis Group, LLC, 2nd edn, 2007 Search PubMed.
- J. Li and Y. Sha, Molecules, 2008, 13, 1111–1119 CrossRef CAS.
- P. Ossowicz, E. Janus, G. Schroeder and Z. Rozwadowski, Molecules, 2013, 18, 4986–5004 CrossRef CAS.
- R. Radeglia, J. Prakt. Chem., 1981, 323, 1016 CrossRef.
- Z. Rozwadowski, J. Mol. Struct., 2005, 753, 127–131 CrossRef CAS.
- S. Vairam, T. Premkumar and S. Govindarajan, J. Therm. Anal. Calorim., 2010, 100, 955–960 CrossRef CAS.
- Vogel's textbook of practical organic chemistry, ed. B. S. Furniss and A. I. Vogel, Pearson/Prentice Hall, Harlow, New, 5th edn, 2009 Search PubMed.
- C. Reichardt and T. Welton, Solvents and solvent effects in organic chemistry, Wiley-VCH, Weinheim, Germany, 4th edn, 2011 Search PubMed.
- B. A. Čuříková, K. Procházková, B. Filková, P. Diblíková, J. Svoboda, A. Kováčik, K. Vávrová and J. Zbytovská, Int. J. Pharm., 2017, 534, 287–296 CrossRef.
- C. Géniès, E. L. Jamin, L. Debrauwer, D. Zalko, E. N. Person, J. Eilstein, S. Grégoire, A. Schepky, D. Lange, C. Ellison, A. Roe, S. Salhi, R. Cubberley, N. J. Hewitt, H. Rothe, M. Klaric, H. Duplan and C. Jacques-Jamin, J. Appl. Toxicol., 2018, jat.3730 CrossRef.
- H. Bando, S. Mohri, F. Yamashita, Y. Takakura and M. Hashida, J. Pharm. Sci., 1997, 86, 759–761 CrossRef CAS.
- D. Celebi, R. H. Guy, K. J. Edler and J. L. Scott, Int. J. Pharm., 2016, 514, 238–243 CrossRef CAS.
- B. M. Jameel, A. Huynh, A. Chadha, S. Pandey, J. Duncan, M. Chandler and G. Baki, Int. J. Pharm., 2019, 569, 118549 CrossRef CAS.
- L. Luo, A. Patel, B. Sinko, M. Bell, J. Wibawa, J. Hadgraft and M. E. Lane, Int. J. Pharm., 2016, 505, 14–19 CrossRef CAS.
- O. Taofiq, F. Rodrigues, L. Barros, M. F. Barreiro, I. C. F. R. Ferreira and M. B. P. P. Oliveira, Food Chem. Toxicol., 2019, 127, 228–236 CrossRef CAS.
- M. Malinowska, E. Sikora and J. Ogonowski, Wiad. Chem., 2013, 67(3–4), 321–344 CAS.
- H. Chen, X. Chang, D. Du, J. Li, H. Xu and X. Yang, Int. J. Pharm., 2006, 315, 52–58 CrossRef CAS.
- R. Intarakumhaeng and S. K. Li, Int. J. Pharm., 2014, 476, 266–276 CrossRef CAS.
- M. Jaworska, E. Sikora and J. Ogonowski, Wiad. Chem., 2011, 65(3–4), 301–320 CAS.
- A. Haq and B. Michniak-Kohn, Drug Delivery, 2018, 25, 1943–1949 CrossRef CAS.
- Y. S. R. Krishnaiah, V. Satyanarayana and R. S. Karthikeyan, J. Pharm. Pharm. Sci., 2002, 5, 123–130 CAS.
- S. Mutalik and N. Udupa, Pharm, 2003, 58, 891–894 CAS.
- V. K. Llewelyn, L. Berger and B. D. Glass, Heliyon, 2019, 5, e02127 CrossRef.
- G. Marti-Mestres, J. Mestres, J. Bres, S. Martin, J. Ramos and L. Vian, Int. J. Pharm., 2007, 331, 139–144 CrossRef CAS.
- U. Jacobi, M. Kaiser, R. Toll, S. Mangelsdorf, H. Audring, N. Otberg, W. Sterry and J. Lademann, Skin Res. Technol., 2007, 13, 19–24 CrossRef.
- M. Khiao, K. C. Richardson, A. Loewa, S. Hedtrich, S. Kaessmeyer and J. Plendl, Anat., Histol., Embryol., 2019, 48, 207–217 CrossRef.
- M. M. Badran, J. Kuntsche and A. Fahr, Eur. J. Pharm. Sci., 2009, 36, 511–523 CrossRef CAS.
- D. J. Davies, R. J. Ward and J. R. Heylings, Toxicol. In Vitro, 2004, 18, 351–358 CrossRef CAS.
- J. Kuntsche, H. Bunjes, A. Fahr, S. Pappinen, S. Rönkkö, M. Suhonen and A. Urtti, Int. J. Pharm., 2008, 354, 180–195 CrossRef CAS.
- A. Simon, M. I. Amaro, A. M. Healy, L. M. Cabral and V. P. de Sousa, Int. J. Pharm., 2016, 512, 234–241 CrossRef CAS.
- M. Kopečná, M. Macháček, A. Nováčková, G. Paraskevopoulos, J. Roh and K. Vávrová, Sci. Rep., 2019, 9, 14617 CrossRef.
- A. Ahad, M. Aqil and A. Ali, Pharm. Biol., 2016, 54, 1042–1051 CrossRef CAS.
Footnote |
| † Electronic supplementary information (ESI) available: Amounts of substrates and yields of synthesis of L-valine alkyl ester hydrochlorides (Table S1); amounts of substrates and yields of synthesis of L-valine alkyl esters (Table S2); yields of synthesis of L-valine alkyl esters ibuprofenate (Table S3); statistical differences regarding the cumulative mass of active substance in relation to ibuprofen, taking into account all factors used (a type of alcohol and pH) by the Mann–Whitney test (Table S4); statistical differences between individual alcohols and between acceptor liquids with different pH using the Mann–Whitney test (Table S5); skin permeation expressed as % applied dose of IBU, after 24 h permeation of free acid and its salts with L-valine esters from methanolic, ethanolic and isopropanolic solution into acceptor phase at pH 7.4 and 5.4 (Table S6); skin accumulation expressed as % applied dose of IBU, after 24 h skin permeation of ibuprofen free acid and its salts with L-valine esters from methanolic, ethanolic and isopropanolic solution into acceptor fluid at pH 7.4 and 5.4 (Table S7); NMR spectra of obtained compounds (Fig. S1, S2, S5, S6, S9, S10, S13, S14, S17, S18, S21, S22, S25, S26, S30, S31, S35 and S36) FT IR spectra od obtained compounds (Fig. S3, S7, S11, S15, S19, S23, S27, S32 and S37), the TG, DTG and c-DTA curves of obtained compounds (Fig. S4, S8, S12, S16, S20, S24, S28, S33 and S38); the DSC curves of L-valine obtained alkyl ester ibuprofenates (Fig. S29, S34 and S39). The cumulative mass of compound in skin after 24 hours of permeation (n = 3) – acceptor phase with pH 5.4 (Fig. S40). The cumulative mass of compound in skin after 24 hours of permeation (n = 3) – acceptor phase with pH 7.4 (Fig. S41). Hierarchical dendrogram of a mean cumulated mass of IBU (Fig. S42). Box and whisker plot of data from a mean cumulative mass of IBU depending on the type of ibuprofen derivative used (Fig. S43). Box and whisker plot of data from a mean cumulative mass of IBU depending on the type vehicles used (Fig. S44). Box and whisker plot of data from a mean cumulative mass of IBU depending on the pH used (Fig. S45). Diffusing of analyzed compounds through pig skin from alcoholic solutions to acceptor phase with different pH (Fig. S46–S56). See DOI: 10.1039/d0ra06567f |
| This journal is © The Royal Society of Chemistry 2020 |