 Open Access Article
Recovery of expensive Pt/C catalysts from the end-of-life membrane electrode assembly of proton exchange membrane fuel cells†
Abha Bharti and
Rajalakshmi Natarajan *
*
Centre for Fuel Cell Technology, International Advanced Research Centre for Powder Metallurgy and New Materials, IITM-Research Park, Chennai-600113, India. E-mail: rajalakshmi@arci.res.in
First published on 22nd September 2020
Abstract
A simple and economical route using an environmental friendly solvent is reported for recovering catalyst from the end-of-life membrane electrode assembly. This precious component is recovered in the form of Pt/C and ionomer powder. The catalyst exhibited an electrochemical surface area of 42 m2 g−1 and remarkable stability, showcasing its potential for second life applications.
The drive for the decarbonization of the automotive industry owing to the adverse effects of global warming on both environment and human health has propelled the development of emission free, hydrogen-based fuel cell vehicles (FCVs). However, the complete diffusion of FCVs in fossil fuel-powered internal combustion (IC) engine dominated global vehicle market is limited by their high cost.1,2 This is majorly due to the usage of Pt-based catalysts in electrochemical reactions generating power, which contributes ∼35–45% to the cost of FCVs.3,4 The mass production of FCVs to cater to road transport as substitutes to IC-based engines will further increase the requirement of Pt. This is a bottleneck for the wide-scale applications of FCVs; besides being expensive, Pt has limited and geographically restricted natural reserves. Also, the mass employment of FCVs requires readiness with respect to the waste management strategies for end-of-life (EoL) components for the effective utilization of their precious components. This has boosted research on the recycling/recovering Pt from the EoL membrane electrode assemblies (MEAs) of fuel cells. Moreover, the efficient recycling of precious components from EoL MEAs presents sustainable waste management of fuel cell components as well as the development of cost-effective alternative technologies with the recycled components.
Recovery strategies for the EoL MEAs of fuel cells are typically categorized into four classes: (i) high-temperature combustion processes, (ii) acid dissolution process, (iii) electrochemical process-based recovery route, and (iv) alcohol treatment method. All these techniques have been proved efficient for the recovery of Pt, but suffer from drawbacks towards effective implementation, hence presenting avenue for better recovery processes. The high-temperature combustion methods are most commonly employed for the Pt recovery from EoL MEAs. However, besides being energy intensive, this process also leads to the emission of toxic HF, arising from high fluorine-containing components, perfluorosulfonic acid (PFSA) membranes and polytetrafluoroethylene (PTFE) binders in MEAs.5 The acid dissolution technique for the recovery of Pt utilizes highly corrosive acids, such as HCl, H2SO4, HNO3, aqua regia (HNO3/HCl) and piranha acid (H2SO4/H2O2), requires specialized infrastructure and also suffers from hazardous emissions such as HCl vapour, Cl2, NOx and SO2.6,7 Electrochemical methods of the Pt recovery often employs corrosive or toxic electrolytes, which also lead to harmful emissions.8,9 These recovery processes also result in the complete loss of the other expensive component, i.e., the Nafion membrane. The alcohol treatment process offers the possibility of membrane recovery; however, utilizes large quantity of alcohols making the process cost-intensive.10 Besides, this process results in the recovery of larger particle-sized Pt-based catalysts (>50 μm), making them unsuitable for direct catalytic applications.11 Considering the limitations of current recovery technologies, the development of a simple and environmental benign route with the potential for the direct application of recovered products is imperative for the efficient utilization of natural resources and development of sustainable recovery centres. Sustainable EoL recovery technologies are also vital to support future Pt-based technologies and take away burden from limited Pt natural reserves.
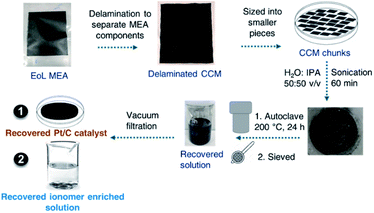
Herein, a low-temperature hydrothermal treatment is reported for the recovery of EoL MEAs of a proton exchange membrane fuel cell (PEMFC) in 50![[thin space (1/6-em)]](https://www.rsc.org/images/entities/char_2009.gif) :
:![[thin space (1/6-em)]](https://www.rsc.org/images/entities/char_2009.gif) 50 v/v of water and isopropanol (IPA) solution under ambient pressure, as presented in Fig. 1.
50 v/v of water and isopropanol (IPA) solution under ambient pressure, as presented in Fig. 1.
The presence of the aqueous solution of IPA aids in the disruption of the bond between the fluorocarbon-containing Nafion membrane and the coated Pt/C catalysts, facilitating catalyst detachment.12 Furthermore, the hydrothermal treatment in the aqueous solution of IPA results in the dissolution of the membrane,13 and subsequently Pt/C catalysts were recovered via a simple vacuum filtration technique. The Nafion membrane was recovered in the form of an ionomer-enriched filtrate solution, which can be used to prepare a new Nafion membrane via recasting.14 The recovered ionomer solution was further heat-treated for 12 h at 80 °C for the evaporation of volatile solvents to yield ionomer powder. This offers the possibility of reuse and desirable modification of the recovered Nafion membrane as powder, which can be dissolved in large number of solvents.15
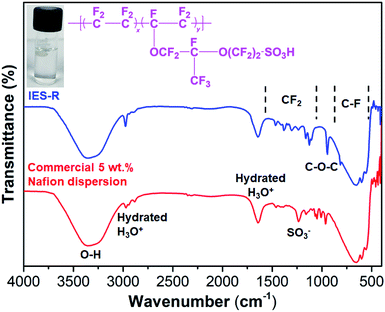
Fig. 2 shows the Fourier transform infrared (FTIR) spectrum of the recovered ionomer enriched solution (IES-R) and fresh commercial 5 wt% Nafion dispersion. The spectra display molecular segments similar to commercial Nafion dispersion. The strong band in the region 3700–3000 cm−1 is attributed to the O–H stretching of water. However, the shoulder peak at 2978 cm−1 and sharp peak at 1640 cm−1 correspond to hydrated H3O+.16 The peak at 1236 cm−1 can be attributed to the stretching vibrations of SO3− groups.17 The peaks in the range 1400–1000 cm−1 can be ascribed to the CF2 stretching vibrations.16,17 The peak appeared at 963 cm−1 ascribes the to C–O–C stretching modes, whereas the region between 800–500 cm−1 mostly corresponds to C–F groups.18,19 The FTIR spectroscopy results confirm the dissolution of the Nafion membrane from EoL MEAs, resulting in the formation of an ionomer-enriched solution. This also reveals the efficacy of the employed recovery route to reclaim the precious membrane component of EoL MEAs.
The recovery of Pt/C catalysts and Nafion membrane from the EoL MEAs of PEMFC via the low temperature non-toxic aqueous alcohol-based route was further confirmed through X-ray diffraction studies. Fig. 3a shows the X-ray diffractogram of recovered ionomer powder (IP-R) obtained after the evaporation of solvents from the IES-R solution and Pt/C catalyst (Pt/C-R). The recovered ionomer powder showed the characteristic peak of Nafion at 16.6° and 39.9°, corresponding to the polyfluorocarbon chains of Nafion.20,21 The X-ray diffractogram of Pt/C-R displays characteristic diffraction planes, corresponding to the face centered cubic (fcc) Pt lattice. The peaks at 39.8°, 46.3°, 67.5°, 81.4° and 85.9° correspond to the (111), (200), (220), (311) and (222) planes of the fcc Pt lattice. The average crystallite size of the recovered Pt was calculated to be 6.1 nm using the Scherrer equation utilizing the most abundant reflections of Pt (111). It is noteworthy to mention that much smaller crystallite sized Pt nanoparticles (NPs) were recovered in this study employing the non-toxic aqueous IPA solvent-based low temperature recovery route as compared to Pt NPs (30 nm) recovered using a corrosive, concentrated H2SO4 solution.21 A small hump at around 26° in the diffractogram of Pt/C-R corresponds to carbon support. The morphology and particle size distribution of the recovered catalyst were investigated via transmission electron microscopy (TEM). Fig. 3b shows the TEM image and the corresponding particle size distribution histogram of Pt/C-R. Spherical Pt NPs with an average particle size of 5.5 ± 0.9 nm were found to be uniformly distributed on the carbon support. This value is in close agreement with the crystallite size determined using the XRD data. The attainment of smaller sized Pt NPs substantiates the prospective of the recovered catalyst for direct applications in fuel cells signifying avenue for the efficient utilization of the recovered products from EoL MEAs. Furthermore, the total amount of recovered Pt/C was 0.74 g, which is 98.7% of the catalyst loading on untreated EoL CCM, revealing the efficacy of the recovery process. The Pt wt% in the recovered catalyst was determined via the thermogravimetric analysis under air atmosphere, and the metal content was found to be ∼17 wt% (Fig. S1†). This value was used for electrochemical calculations.
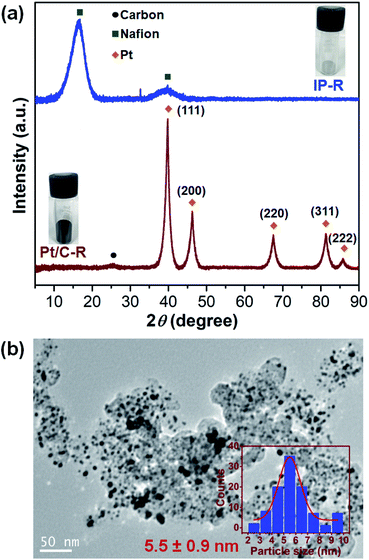 | ||
| Fig. 3 (a) X-ray diffractogram of IP-R and Pt/C-R, and (b) TEM microgram and particle size distribution histogram of the Pt/C-R catalyst. | ||
The catalytic activity of the Pt/C-R catalyst for fuel cell applications was assessed via cyclic voltammetry (CV) in an acidic medium (0.5 M H2SO4). The performance was compared with the Pt/C-C catalyst to assess the applicability of the recovered catalyst in real time applications. Fig. 4a shows the cyclic voltammograms of Pt/C-C and Pt/C-R catalysts. Both the catalysts exhibited the characteristic hydrogen adsorption/desorption feature (0–0.3 V) of the active Pt surface. Pt/C-C exhibited a higher current density as compared to Pt/C-R, indicating superior catalytic activity. This is also evident from the electrochemical surface area (ECSA) calculation of the catalysts. The ECSA represents the active Pt sites available for participation in an electrochemical reaction. Hence, ECSA is a measure of catalytic activity and was calculated using the following equation.
| ECSA = QH/(0.21 × [Pt]) |
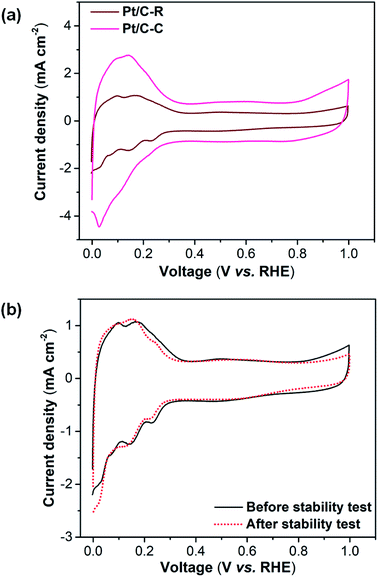 | ||
| Fig. 4 (a) CV plots of Pt/C-C and Pt/C-R catalyst, and (b) CV plots of the Pt/C-R catalyst before and after 5000 cycles of the stability test at a scan rate of 50 mV s−1 in N2 saturated 0.5 M H2SO4. | ||
The stability of the catalyst was also evaluated to access its potential for further applications. The stability of Pt/C-R was evaluated through measurement of changes in ECSA after subjecting the catalyst to 5000 potential cycles in the range of 0.6–1.0 V at the scan rate of 100 mV s−1 in the N2 saturated 0.5 M H2SO4 electrolyte. The CVs of Pt/C-R before and after the stability tests are presented in Fig. 4b. No significant suppression of hydrogen desorption peaks in the voltammograms were observed implying the minimal loss of ECSA. Pt/C-R retained ∼93% of its initial ECSA (42 m2 g−1 vs. 39 m2 g−1) with a loss rate of 0.0006 m2 g−1 per cycle. The results indicate remarkable stability of the recovered catalyst exemplifying its potential for second life applications. The electrochemical results demonstrated the potential of the recovered catalyst for direct fuel cell applications. The practical viability of the Pt/C-R catalyst for fuel cell applications was assessed through single cell PEMFC performance. Fig. 5 shows the polarization and power density curves of the Pt/C-R catalyst. The cell exhibited an open circuit potential of 0.922 V and maximum power density of 134 mW cm−2, revealing the functioning of the recovered catalyst in PEMFC. However, studies are in progress on improving the current density of the recovered catalyst for PEMFC applications.
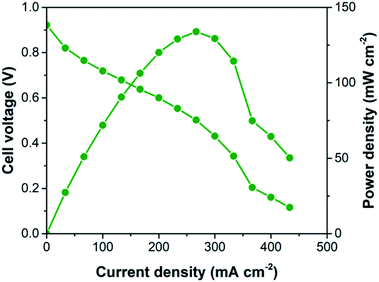 | ||
| Fig. 5 Single cell polarization and power density curves of the Pt/C-R catalyst recorded at the cell temperature of 60 °C with humidified H2 and air gases. | ||
To summarize, the study reports a simple, cost and energy effective, low temperature hydrothermal route utilizing an environmentally friendly aqueous IPA solvent for the recovery of two precious components of EoL MEAs of PEMFC, Pt/C catalyst and Nafion membrane. The molecular composition of the recovered ionomer enriched solution was investigated through FT-IR spectroscopic studies, and it was found to be similar to that of commercial Nafion dispersion, indicating the efficacy of the recovery route as well the recovered product for the utilization of precious components of EoL MEAs for second life applications. The recovered Pt/C exhibited well dispersed Pt NPs on the carbon support with average particle size of 5.5 ± 0.9, nm revealing the effectiveness of the recovery route in the attainment of smaller Pt NPs with prospective for direct applications. In addition, the process demonstrated a high Pt/C catalyst recovery rate of 98.7%. The electrochemical studies supported the potential of the Pt/C-R catalyst for fuel cell applications. Pt/C-R exhibited an ECSA of 42 m2 g−1 and remarkable stability with loss of only ∼7% of ECSA after 5000 cycles of stability tests, signifying their viability for fuel cell applications. Pt/C-R also showed ∼50% ECSA of a commercial, fresh Pt/C catalyst disclosing the avenue for the further utilization of the recovered catalyst for niche applications. Furthermore, a single cell PEMFC with the Pt/C-R catalyst demonstrated maximum power density of 134 mW cm−2, showcasing the applicability of recovered Pt/C as an alternative and sustainable candidate for the development of cost effective PEMFCs. Also, the effective recovery of the Pt/C catalyst in the non-toxic solvent system at a low temperature under mild reaction conditions and utilizing simple equipment is an astounding advantage of this methodology. In addition, the recovery of the active ionomer along with Pt/C is another novel feature of the adopted recovery approach. Added to this two-fold advantage, the whole recovery process exemplifies a sustainable approach for both precious component recovery from EoL MEAs as well as the possibility of pushing the recovered products back into the supply chain.
Conflicts of interest
There are no conflicts to declare.Acknowledgements
The authors would like to acknowledge Dr G. Padmanabham, Director, and Dr R. Gopalan, Regional Director, ARCI for their continuous support and encouragement. Financial support from Technical Research Centre (TRC), Department of Science and Technology (AI/1/65/ARCI/2014) is acknowledged herewith. One of the authors (Abha Bharti) thanks ARCI for postdoctoral fellowship.References
- B. G. Pollet, S. S. Kocha and I. Staffell, Curr. Opin. Electrochem., 2019, 16, 90–95 CrossRef CAS.
- M. Granovskii, I. Dincer and M. A. Rosen, J. Power Sources, 2006, 159, 1186–1193 CrossRef CAS.
- W. Bernhart, S. Riederle, M. Yoon and W. G. Aulbur, Auto Tech Rev., 2014, 3, 18–23 CrossRef.
- M. M. Whiston, I. L. Azevedo, S. Litster, K. S. Whitefoot, C. Samaras and J. F. Whitacre, Proc. Natl. Acad. Sci. U. S. A., 2019, 116, 4899–4904 CrossRef CAS.
- R. Wittstock, A. Pehlken and M. Wark, Recycling, 2016, 1, 343–364 CrossRef.
- F. Xu, S. Mu and M. Pan, Int. J. Hydrogen Energy, 2010, 35, 2976–2979 CrossRef CAS.
- J. Zhao, X. He, J. Tian, C. Wan and C. Jiang, Energy Convers. Manage., 2007, 48, 450–453 CrossRef CAS.
- J.-F. Huang and H.-Y. Chen, Angew. Chem., Int. Ed., 2012, 51, 1684–1688 CrossRef CAS.
- N. Hodnik, C. Baldizzone, G. Polymeros, S. Geiger, J.-P. Grote, S. Cherevko, A. Mingers, A. Zeradjanin and K. J. J. Mayrhofer, Nat. Commun., 2016, 7, 13164 CrossRef CAS.
- A. Valente, D. Iribarren and J. Dufour, Int. J. Hydrogen Energy, 2019, 44, 20965–20977 CrossRef CAS.
- T. Oki, T. Katsumata, K. Hashimoto and M. Kobayashi, Mater. Trans., 2009, 50, 1864–1870 CrossRef CAS.
- J. Alipour Moghaddam, M. J. Parnian and S. Rowshanzamir, Energy, 2018, 161, 699–709 CrossRef CAS.
- C. R. Martin, T. A. Rhoades and J. A. Ferguson, Anal. Chem., 1982, 54, 1639–1641 CrossRef CAS.
- C. Handley, N. P. Brandon and R. van der Vorst, J. Power Sources, 2002, 106, 344–352 CrossRef CAS.
- P. A. Cirkel, T. Okada and S. Kinugasa, Macromolecules, 1999, 32, 531–533 CrossRef CAS.
- D. Kosseoglou, R. Kokkinofta and D. Sazou, J. Solid State Electrochem., 2011, 15, 2619–2631 CrossRef CAS.
- M. J. Parnian, S. Rowshanzamir and J. Alipour Moghaddam, Materials Science for Energy Technologies, 2018, 1, 146–154 CrossRef.
- A. K. Sahu, S. Meenakshi, S. D. Bhat, A. Shahid, P. Sridhar, S. Pitchumani and A. K. Shukla, J. Electrochem. Soc., 2012, 159, F702 CrossRef CAS.
- P. C. Rieke and N. E. Vanderborgh, J. Membr. Sci., 1987, 32, 313–328 CrossRef CAS.
- X. Teng, C. Sun, J. Dai, H. Liu, J. Su and F. Li, Electrochim. Acta, 2013, 88, 725–734 CrossRef CAS.
- H. S. Thiam, W. R. W. Daud, S. K. Kamarudin, A. B. Mohamad, A. A. H. Kadhum, K. S. Loh and E. H. Majlan, Energy Convers. Manage., 2013, 75, 718–726 CrossRef CAS.
- S. Eivind, C. Noergaard and S. N. Stamatin, US Pat., US 9580826 B2, 2017.
- C. F. Nørgaard, S. N. Stamatin and E. M. Skou, Int. J. Hydrogen Energy, 2014, 39, 17322–17326 CrossRef.
Footnote |
| † Electronic supplementary information (ESI) available: Details pertaining to materials, recovery process, materials characterization, preparation of catalyst ink and working electrode, electrochemical measurements, single cell PEMFC measurements and thermogram of recovered catalyst. See DOI: 10.1039/d0ra06640k |
| This journal is © The Royal Society of Chemistry 2020 |

