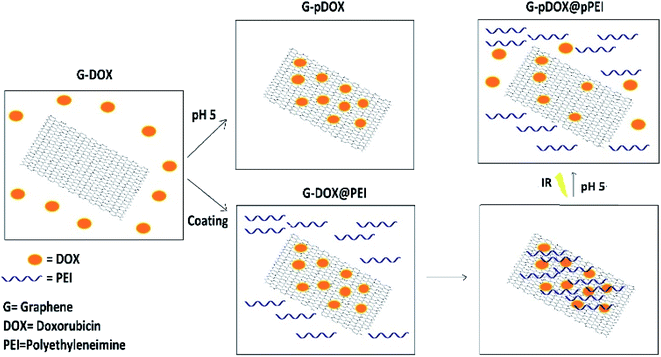
 Open Access Article
Development and evaluation of a pH-responsive and water-soluble drug delivery system based on smart polymer coating of graphene nanosheets: an in silico study†
Abutaleb Alinejada,
Heidar Raissi *b and
Hassan Hashemzadeh
 b
b
aDepartment of Chemistry, Payame Noor University, Tehran, Iran
bDepartment of Chemistry, University of Birjand, Birjand, Iran. E-mail: hraeisi@birjand.ac.ir
First published on 21st August 2020
Abstract
The objective of this study is to develop a controlled and water-soluble delivery system for doxorubicin (DOX) based on the coating of graphene (G) with a smart polymer. A combination of polyethyleneimine (PEI) and G–DOX is investigated by performing density functional theory (DFT) calculations and molecular dynamics (MD) simulations. Several parameters have been employed to evaluate the effect of PEI on the adsorption and release mechanisms of DOX. The obtained results indicated that the binding energy of the drug molecule on G in the presence of PEI is enhanced by about 20% under neutral conditions, whereas the drug absorption becomes weaker in an acidic environment so that DOX could be separated from the carrier surface using near-infrared radiation (NIR). Based on the atom in molecule (AIM) theory, two hydrogen bonds with strengths of about −12.59 and −39.99 kJ mol−1 have been established. Furthermore, evaluating the dynamic behavior of the designed systems in water solution shows that the polymer in physiological pH rapidly adsorbed on the drug–carrier complex. However, at acidic pH, it is quickly desorbed from the carrier surface and the G–DOX complex can be exposed to cancer cells. The obtained results of the present research may be used in future experimental work to design smart DDSs.
Introduction
Nowadays, cancer has become a big challenge as it is one of the deadliest diseases around the globe. Despite many achievements in treatment techniques, it is one of the greatest causes of death in modern societies. Recent advancements in the fields of nano-biotechnology provide great potential for the diagnosis and treatment of various cancers.1 During recent years, various types of nanostructured materials have been developed and employed for cancer treatment.2–4 Two dimensional materials become an important platform to design drug delivery systems for cancer treatment.5–9 Among different nanomaterials, carbon-based nanostructures including carbon nanotubes (CNT), graphene (G), fullerenes, nanowires and nano diamonds with their unique physicochemical properties have been extensively investigated for cancer treatment.10–13Graphene is a two-dimensional single layer of carbon atoms which has gained special attention as a drug delivery system (DDS) due to its unique properties.14–16 Free π electrons on the hexagonal rings represent hydrophobic characteristics and high electron density which can provide a favourable surface for drug loading via forming π–π stacking interactions. In recent years, G and its derivatives forms have been widely employed in many experimental and theoretical studies as efficient DDSs.17–21
For modification by various functional groups is one of the special features of G that leads to increases its efficiency day by day. For example, coating G with polyacrylic acid (PAA) provides the insoluble G with more positively charged surfaces, causing an enhancement in its solubility.22 Grafting G with polyethylene glycol (PEG) and chitosan polymers improves its biocompatibility and solubility.23,24 Functionalization of graphene with folic acid enhances the targeting delivery of anticancer drugs.17,25,26
Stimuli-Responsive Polymers (SRP) are “environmentally sensitive” polymers which their properties are changed in response to environmental variables. Several variables such as pH condition, temperature, electric and magnetic fields, ionic strength, ultrasound, light, and chemical species can be changed their properties.27–32
pH-responsive polymers are interesting type of smart materials that react quickly to small variations at the pH level by changes in its structure and properties including solubility, chain conformation, configuration, and surface activity, etc.33 Despite the existence of various functional groups in the structure of smart polymers, they can usually divide into acidic and basic categories. This classification is much important in the biological term and it is a key parameter for designing pH-response drug delivery systems. This can be used to determine how, when and where the trapped drugs are released from the carrier. The pH of the normal tissues remains constant at 7.4 and the pH of intracellular fluid is maintained at 7.2. In contrast, the extracellular pH of most of the cancer tumours ranges between 6 to 5 which considered an great factor for the targeting release of drugs.34,35
In recent years, several studies have been done in the field of developing smart pH-responsive nanocarriers to increase the efficiency of DDSs in the treatment of cancers. Feng et al. developed a pH-responsive nanocarrier by the coating of graphene oxide (GO) with PEG and polyallylamine hydrochloride (PAH).36 They showed that this complex increases the uptake of doxorubicin (DOX) drug into cells and drugs rapidly released into cancer cell lysosomes. Song and co-workers investigated the GO functionalized with hyaluronic acid (HA) as a pH-responsive drug delivery system.37 Their results illustrated that HA–GO–DOX nanohybrids remarkably increased DOX density in target cancer cells (HepG2 cells) in comparison normal cells.37 Unsoy et al. investigated DOX drug loaded on chitosan-coated magnetic nanoparticles as a pH-dependent high potential drug delivery system and they showed that it enables targeting the tumour cells under a magnetic field. Their results showed nanocarriers are very well absorbed by MCF-7 breast cancer cells through endocytosis.38
Polyethyleneimine (PEI) is one of the most prominent examples of smart polymers that capable to transfer of bioagents in vitro and in vivo into various cells and tissues.39,40 For the first time, Zhang et al. prepared functionalized GO with polyethyleneimine, they used from this platform for the dual transfer of siRNA and the anticancer drug doxorubicin. Their obtained results demonstrated that the conjugation of PEI with GO had a good performance delivery of DOX and siRNA. This nanocarrier revealed a synergistic effect, which leads to a significantly enhanced chemotherapy efficacy.39
In this work, the effect of PEI polymer on adsorption and release of DOX on/from the pristine graphene nanosheet is investigated using density functional theory (DFT) calculations and molecular dynamics (MD) simulation to obtain quantitative information such as the electronic properties, binding energies, and dynamics behaviour. Our results will provide an in-depth understanding of the nature of interactions between DOX and G and will show the loading and releasing properties of drug molecules how could be affected by PEI.
Computational method
DFT computational procedure introduction, results and discussion, experimental
For DFT calculations, a graphene nanosheet including 96 carbon atoms is selected. The edge atoms of graphene are saturated with the hydrogen atoms. The loading properties are examined by the following instruction. Initially, the G, PEI and DOX molecules are optimized at M06-2X functional level along with the 6-31G** basis set by using the Gaussian 03 program. It is proved that the M06 suite functional levels, including M06, M06-2X, and M06-HF, are very successful in describing dispersion interactions.41 The M06-2X level that includes 54% Hartree–Fock (HF) exchange is designed to evaluate weak interactions in molecular systems.42 The optimized structure of monomers (i.e., G, PEI, DOX) is given in Fig. S1.† After that, DOX is located on the G surface in a parallel configuration to build a G–DOX complex. The G–DOX@PEI system is created by inserting the PEI polymer chain to above the optimized G–DOX complex using Gview software. To find the lowest energy structure of complexes, the conformational searches are performed by using Spartan package. Finally, the pH-dependent release of the DOX molecule in the absence (G–pDOX system) and presence (G–pDOX@pPEI complex) of the polymer is evaluated by protonating the related amino groups in DOX and PEI molecules. All of the complexes are optimized to the same level and basis set as the monomers and their final configurations are given in Fig. 1. The adsorption energies (Eads) of the complexes are calculated using the following equation:| Eads = Ecomplex − (Emonomer1 + Emonomer2) + Ebsse | (1) |
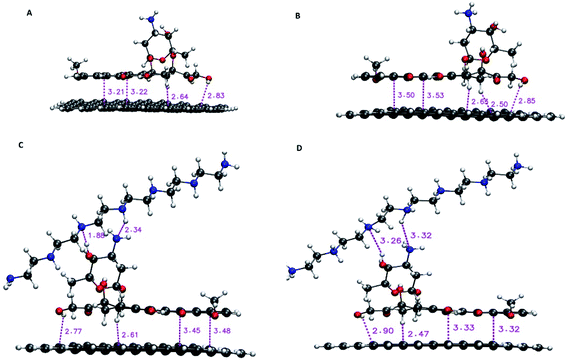 | ||
| Fig. 1 The optimized structure of (A) G–DOX, (B) G–pDOX, (C) G–DOX@PEI, and (D) G–pDOX@pPEI complexes with intermolecular distances (in angstrom). | ||
Noncovalent interactions and the corresponding reduced density gradients (RDG) have been analysed in bond critical points (bcp) by using Multiwfn package.44
Molecular dynamics simulation
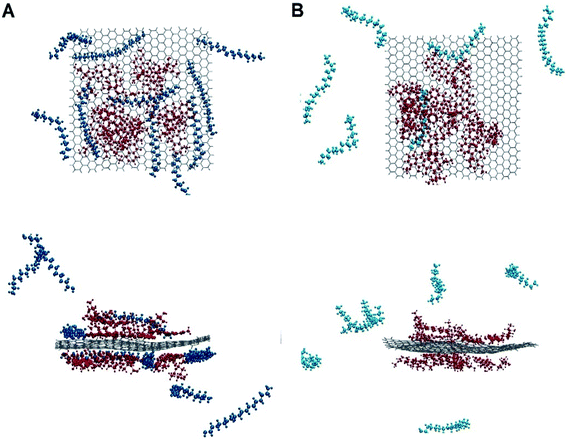
In the present work, the molecular dynamics simulation is performed using Gromacs package 2019.2.45 To investigate the dynamics behaviour of adsorption and pH-depended release processes, four systems (i.e., G–DOX, G–pDOX, G–DOX@PEI, G–pDOX@pPEI) are made. Details of all of the studied systems are tabulated in Table S1† and graphically represented in Fig. 2.In the G–DOX system, ten molecules of doxorubicin were placed around graphene. In the following, in order to build the G–pDOX and G–DOX@PEI systems, the final orientation of the DOX on the G from G–DOX system is taken and then the relevant amine group of the adsorbed drug molecules is protonated and PEI is added to simulation box, respectively. In G–pDOX@pPEI, the final configuration of DOX and polymer on the carrier is extracted from G–DOX@PEI system and all of the amine groups of DOX and PEI are protonated. The force field parameters for the drug, the polymer and the carriers are obtained from the Charmm36 force field.46 The force filed parameters for carbon and hydrogen atoms of graphene listed in Table S2.† To avoid from interacting simulation box with their neighbours all of the boxes are selected large enough. The water molecules are added to simulation boxes by utilizing the standard TIP3P model.47 For neutralizing the system and producing a correct biological environment (0.15 M), Na+, and Cl−are added into the simulation box. Visual Molecular Dynamics (VMD) package is used for molecular visualization.48 For all of the investigated systems, energy minimization using the steepest descent algorithm is performed. After minimization, each system is equilibrated at 310 K for 200 ps using the NVT ensemble and is followed by 500 ps equilibration in the NPT ensemble at 1 atm. It should be noted that during equilibration steps pressure and temperature are kept at their constant values by using Berendsen and V-rescale algorithm, respectively.49,50 MD productions run under periodic boundary conditions for 60 ns with a 1.5 fs time step. It should be noted that the MD simulations were repeated three times, and the results were obtained by averaging over the three repeated. In order to constrain all of the bonds at their equilibrium position, the LINCS algorithm is used. For treatments of long-range electrostatic interactions, the Particle-Mesh Ewald (PME) method is employed, while non-bonded interactions are calculated with a 1.4 nm range cut-off.
Results and discussion
DFT calculation results
In this section, the nature of interactions and binding affinity of DOX to G in the presence and absence of PEI are examined by performing the density functional theory calculation. Furthermore, the effect of protonation of drug and polymer (as a mimic of acidic pH environment) on their interactions with the carrier has been investigated. The obtained stable configurations of the studied complexes and the values of intermolecular binding distances are given in Fig. 1. In the G–DOX case, the drug molecule prefers to adsorb on graphene in parallel orientation and the intermolecular distances are in the range of 2.51 and 3.50 Å. This range has a good agreement with previous studies17,18,20 and confirms that the nature of the G–DOX interaction is non-covalent.Moreover, in order to understand the effect of PEI on adsorption and release mechanisms of the drug on/from the graphene surface, a coating-based system with the polymer is designed. As can be seen in Fig. 1C, the intermolecular distances between DOX and PEI are about 1.88–2.34 Å which indicates the formation of non-covalent interaction between them. Furthermore, the coating of DDS with PEI (G–DOX@PEI) leads to a decrease in the drug–carrier intermolecular distances. While when the polymer and drug are protonated (G–pDOX@pPEI) the PEI departed from the G–DOX complex and its distance with DOX is increased. These results indicated that the polymer at neutral pH level adsorbs on the carrier, while it can release from the DDS surface at acidic pH conditions. This behaviour can be very helpful in targeted drug delivery to cancer cells.
In order to gain further details about the effect of PEI on the drug adsorption and release, the binding energy of the designed complexes is evaluated. As seen from Table 1, in all of cases the binding energy is negative indicating formation of the complexes are spontaneous and exergonic. It should be noted that all of the DFT calculations in the vacuum phase performed, and the effect of solvent did not include. Therefore, this is true only in the case of non-solvated systems at 0 K. The solvation and entropic could change the complex formation behaviour. However, such these calculations gain useful insight from the interactions between biomolecules and nanoparticles, such as molecular configurations, dominating interaction sites, and binding types.21,51,52 On the other hand, in the MD simulation solvent effect included by employing an explicit water model. Furthermore, compared to DFT, larger models were selected for molecular dynamics simulations to minimize size effects.
| System | Eads (kJ mol−1) |
|---|---|
| G–DOX | −237.85 |
| G–pDOX | −297.50 |
| G–DOX@PEI | −284.08 |
| G–pDOX@pPEI | −160.55 |
The strong binding energy of DOX to graphene surface may be related to formation of π–π, CH⋯π, and OH⋯π interactions which can be observed in Fig. 1. When the G–DOX complex is coated with PEI the binding energy of the drug molecule about 20% is decreased. This observation has a good agreement with intermolecular distances and confirms that the polymer-based delivery systems have a better performance in adsorption of the DOX molecule. According to Fig. 1, the stronger binding could be attributed to the formation of hydrogen bonds (H-bonds) between the drug and PEI. It is found the binding energy in the G–pDOX@pPEI significantly increased in comparison with G–pDOX (change from −297.50 kJ mol−1 to −160.55 kJ mol−1).
In fact, by protonation due to the repulsion, the intermolecular distances of PEI, DOX, and G are increased, consequently, the interactions become weaker. Overall, DOX appears to be physiosorbed on graphene surface and its interaction becomes stronger by polymer coating. It is known that G shows a good photothermal effect and can be utilized for photothermal treatment, especially that of near infrared radiation (NIR).53,54 Furthermore, in acidic condition, by taking PEI away G–DOX complex the binding energy is increased and drug can be released from the carrier surface under NIR laser irradiation. Therefore, it can be concluded that our designed drug delivery system has a synergistic effect. In the other words, the G–DOX@PEI DDS shows pH-/photo responsive release behaviour, in which the release of drug can be occurred under the acidic tumour condition, and it is accelerated by NIR laser irradiation. Also, this can be further promoted by photothermal effect of graphene nanosheet.
Further details about the nature of the carrier, the drug and the polymer interactions are extracted using the RDG analysis. This analysis successfully was employed to assess the type of interactions and also to specify the interacting regions. Different kinds of interactions based on their colours can be identified in the colour-filled RDG isosurface.55 According to its classification, the red region shows strong steric effects, the green zone represents weak attractive interactions and the blue part characterizes strong attractive interactions. The colour-filled RDG isosurfaces for all of the investigated systems are given in Fig. 3. These isosurfaces are calculated by the Multiwfn package and for clarity in Fig. 3, the RDG range that related to the repulsion of graphene and drug rings have been removed. As can be seen in this Fig. 3, a wide green area is observed between the G and DOX which can be related to formation of π–π stacking between them. It should be noted that the adsorbed drug molecule is involved in several intra-molecular interactions which causes the green region is emerged between its atoms in RDG plot. Furthermore, the presence of polymer above of drug molecule leads to DOX configuration is slightly changed. In G–DOX@PEI system, due to the formation of strong intermolecular HBs between drug and polymer, several blue and green areas in RDG isosurfaces are observed. In Fig. 3 the formation of HB for PEINH⋯DOXN and DOXOH⋯PEIN pairs can be seen. Also, the intra-molecular some of interaction regions for DOX is disappeared. This indicates the configuration of the drug for the formation of HB with the polymer is changed. Interestingly, these green and blue areas not only are destroyed but also the red areas are created in system G–pDOX@pPEI. This observation confirms that repulsive interaction between the drug and the polymer exists in the acidic media.
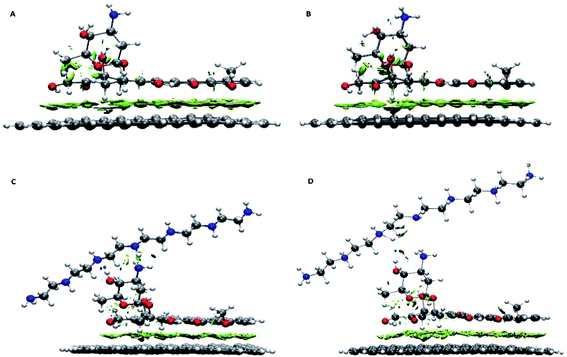 | ||
| Fig. 3 Color-filled RDG iso-surfaces depicting noncovalent interaction (NCI) regions for (A) G–DOX, (B) G–pDOX, (C) G–DOX@PEI, and (D) G–pDOX@pPEI complexes. | ||
Furthermore, the atoms-in-molecule (AIM) topological analysis is performed to evaluate the strength of H-bonds between the drug and the polymer. The Espinosa method56 is used to calculate the strength of the intermolecular H-bonds calculated. According to this method, HB energy (EH-bond) is obtained from the potential energy density at the bond critical points  The obtained results show that the H-bonds between O–H⋯N (−39.99 kJ mol−1) is stronger than N–H⋯N (−12.59 kJ mol−1). The combination of these strong hydrogen bonds, as well as other hydrogen bond-like interactions, leads to the formation of a stable drug–carrier@polymer complex.
Moreover, as can be seen in Fig. 3, the observed RDG pattern for the G–pDOX system is similar to the G–DOX system (cf. Fig. 3A and B). This result indicates that analysis RDG cannot distinguish the bit difference between these systems.
MD simulation results
The dynamic behaviour of DOX adsorption on the G surface in the presence and absence of PEI polymer is investigated by performing MD simulation. Also, the effect of this polymer on the release properties of the drug molecules from the nanocarriers is evaluated. The final snapshots of all of the investigated systems are evaluated and several analyses are used to quantify the dynamics of adsorption and release processes.Fig. 4 and 5 depict the final configuration of the studied systems in neutral and acidic environments. By analysing the MD trajectory of the G–DOX system, it is found that the DOX has a good tendency to the graphene surface. It is observed that the drugs spontaneously adsorbed on graphene and establish the stable complex. In this system, all of the DOX molecules (except one of them) through their benzene rings form strong π–π stacking with the G surface. One of the DOX molecules overlaps on the other drugs through π–π stacking and hydrogen bonds (HBs) interactions. This observation reveals that DOX molecules do not aggregate significantly in the presence of G that can be attributed to the high tendency of DOX to interact with the carrier. When the PEI is added to the simulation box (G–DOX@PEI), it can be rapidly adsorbed on the graphene. The final snapshot of the G–DOX@PEI system shows almost 60% of polymers are adsorbed on the DDS. It is found that the PEIs are placed among or/on the drug molecules which show drug absorption on the nanocarrier enhances in both cases.
 | ||
| Fig. 4 The final snapshot from the (A) G–DOX and (B) G–pDOX systems. The water and ions molecules are not shown for clarity. | ||
In the biological environment, there is a pH gradient that varies from the physiological pH value (i.e., 7.4) to acidic pH (near the cancer cells). Here, the release behaviour of our designed DDSs in the face of the acidic environment are investigated. As can be seen in Fig. 4, the adsorbed drugs after protonation is reoriented and slightly further away from the nanosheet than the non-protonated form. As a representative, the distance between a selected drug and graphene before and after protonation examined and obtained results shown in Fig. S3.† Close inspection of this figure showed that the drug's amino group gets away from the G surface as much as possible because of the repulsion between drugs and graphene. The intermolecular distance between the nitrogen of DOX and graphene change form 3.28 Å in the G–DOX system to 7.08 Å in the G–pDOX case. Furthermore, interestingly, in the acidic condition, the polymers are desorbed from the graphene surface which confirms the PEI has a good ability to respond to pH reduction. In the other words, in the neutral environment, PEI can cover the DDS surface and reduces side effects and increases solubility, whereas in acidic pH, it can separate from the surface of the nano-carrier and the drugs enable to target cancer cells.
In the following, several analyses are performed to evaluate the above observations. Fig. 6 shows the average distance between the graphene surface and drug nitrogen atom as a function of simulation time in G–DOX and G–pDOX systems. It should be noted that the average is taken over distances of all drugs in the studied systems. In the G–DOX system, the distance of N atoms and the G surface significantly reduces from 1.1 nm to 0.33 nm after 7 ns. After that, the distance fluctuates around its average value. As can be seen, by protonation, distance of nitrogen with graphene increases to 0.41 nm.
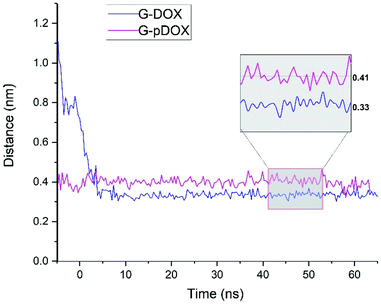 | ||
| Fig. 6 The time evolution of the distance between nitrogen atom of drug and graphene surface in G–DOX and G–pDOX systems. | ||
The RDF plot between the PEI and graphene is calculated to examine the distribution of polymer around the carrier surface at neutral and acidic conditions (Fig. 7A). As can be seen in this figure, RDF is zero due to the strong repulsive forces between the DDS and polymers in short distances. The most probability for finding PEI around of G–DOX complex is around 0.3–0.5 nm which indicates the physical nature of polymer–DDS interaction. This range of distance has a good agreement with calculated intermolecular distances for physisorption of drugs and other biomolecules with nanoparticles.57,58 For the G–pDOX@pPEI system, by desorption of PEI from the carrier surface, the main RDF peak emerges in further distances (around 2 nm).
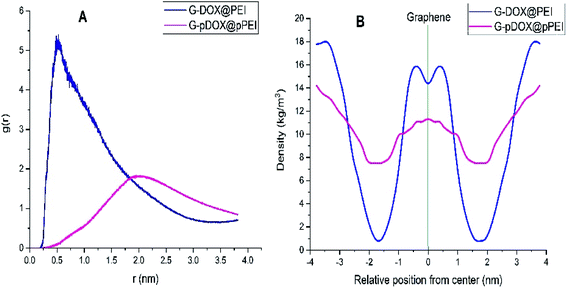 | ||
| Fig. 7 (A) The RDF plot between the polymer and graphene and (B) density profile of the polymer around of graphene in G–DOX@PEI and G–pDOX@pPEI systems. | ||
The density profile for PEI in G–DOX@PEI and G–pDOX@pPEI systems is calculated and given in Fig. 7B. It should be noted that the “gmx density” module is used to calculate densities and the graphene is selected as the reference. The density profile for PEI in the G–DOX@PEI system shows that some of the polymers are coated the G–DOX complex, while some of them do not adsorbed on the DDS. In the G–pDOX@pPEI system, the density around the carrier is decreased while it is increased at the distance of two nanometres from the graphene surface. This observation can prove that the polymers are desorbed from DDS at acidic pH. By comparing Fig. 7A and B, it can be concluded that the location of the RDF peaks and the density profiles in both systems show the same behaviour and nicely reveals the polymer adsorption and desorption processes.
The intermolecular distance between PEI and graphene as a function of simulation time for G–DOX@PEI and G–pDOX@pPEI systems is depicted in Fig. 8. In the neutral pH level, the polymer chains tend to adsorb on the G–DOX complex, where the intermolecular distance decreases form ∼1.80 nm to ∼0.20 nm. Almost After 15 ns, all of PEI chains adsorbed on the carrier surface, and form a stable complex. At the acidic condition, polymers, due to the repulsion created between protonated groups, begin to desorb from the carrier surface. By desorbing PEI chains from the G–DOX complex, their intermolecular distance increases from ∼0.20 nm to ∼0.60 nm.
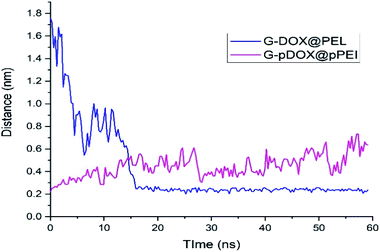 | ||
| Fig. 8 The time evolution of the distance between polymer and graphene surface in G–DOX@PEI and G–pDOX@pPEI systems. | ||
The role of intermolecular HB between drug–polymer and water–polymer pairs in the adsorption and the desorption processes examined. In Fig. S4† A the number of hydrogen bonds between DOX and PEI depicted. As can be seen, in the unprotonated case several HBs between them are formed, while in the protonated form, the hydrogen bonds are disappeared. On the contrary, by approaching PEI to the G–DOX complex, its HBs with water are decreased (Fig. S4† panel B). Whereas, at the acidic conditions where the polymer is desorbed, the number of hydrogen bonds with water has increased significantly. These observations indicated that HB has a major impact on the loading and release processes.
According to these results, it can be concluded that the polymer in physiological pH has a good tendency to adsorb on the graphene surface, however, it is quickly desorbed from the carrier surface at acidic pH.
Conclusions
In summary, the adsorption and release of DOX on/from the pristine graphene nanosheet in the presence and absence of PEI are investigated. Several quantities such as the electronic properties, binding energies, and dynamics behaviour for investigated systems have been evaluated using density functional theory (DFT) calculations and molecular dynamics (MD) simulation. The obtained results show that the interaction of the DOX molecule with G in the presence of PEI is enhanced by the formation of hydrogen bonds between the drug and the polymer. Whereas the interaction of the drug with G becomes weaker when the polymer-coated DDS is faced to the acidic environment so that using near-infrared radiation (NIR) the DOX could be separated from the carrier surface. The RDG analysis indicated that these green and blue areas in system G–pDOX@pPEI not only are destroyed but also the red areas are created. Furthermore, the MD simulation results show that the polymer in physiological pH quickly adsorbed on the graphene surface and covers the drug molecule that causes to reduce side effects and increase solubility. While, it is quickly desorbed from the carrier surface at acidic pH and the G–DOX complex can be exposed to cancer cells.Conflicts of interest
There are no conflicts to declare.Notes and references
- S. Virani, J. A. Colacino, J. H. Kim and L. S. Rozek, ILAR J., 2012, 53, 359–369 CrossRef PubMed.
- J. F. Coelho, P. C. Ferreira, P. Alves, R. Cordeiro, A. C. Fonseca, J. R. Góis and M. H. Gil, EPMA J., 2010, 1, 164–209 CrossRef PubMed.
- D. Lombardo, M. A. Kiselev and M. T. Caccamo, J. Nanomater., 2019, 3702518 CAS.
- J. Li, S. Ying, H. Ren, J. Dai, L. Zhang, L. Liang, Q. Wang, Q. Shen and J.-W. Shen, Int. J. Pharm., 2020, 119241 CrossRef CAS PubMed.
- B. Song, Y. Zhou, H.-M. Yang, J.-H. Liao, L.-M. Yang, X.-B. Yang and E. Ganz, J. Am. Chem. Soc., 2019, 141, 3630–3640 CrossRef CAS PubMed.
- L.-M. Yang, V. Bacic, I. A. Popov, A. I. Boldyrev, T. Heine, T. Frauenheim and E. Ganz, J. Am. Chem. Soc., 2015, 137, 2757–2762 CrossRef CAS PubMed.
- L.-M. Yang, I. A. Popov, A. I. Boldyrev, T. Heine, T. Frauenheim and E. Ganz, Phys. Chem. Chem. Phys., 2015, 17, 17545–17551 RSC.
- L.-M. Yang, I. A. Popov, T. Frauenheim, A. I. Boldyrev, T. Heine, V. Bačić and E. Ganz, Phys. Chem. Chem. Phys., 2015, 17, 26043–26048 RSC.
- L.-M. Yang and E. Ganz, Phys. Chem. Chem. Phys., 2016, 18, 17586–17591 RSC.
- D. Chen, C. A. Dougherty, K. Zhu and H. Hong, J. Controlled Release, 2015, 210, 230–245 CrossRef CAS PubMed.
- J. Bartelmess, S. J. Quinn and S. Giordani, Chem. Soc. Rev., 2015, 44, 4672–4698 RSC.
- X. Ren, H. Chen, V. Yang and D. Sun, Front. Chem. Sci. Eng., 2014, 8, 253–264 CrossRef CAS.
- Z. Li, A. L. B. de Barros, D. C. F. Soares, S. N. Moss and L. Alisaraie, Int. J. Pharm., 2017, 524, 41–54 CrossRef CAS PubMed.
- K. S. Novoselov, A. K. Geim, Sv. Morozov, D. Jiang, M. I. Katsnelson, Iv. Grigorieva, Sv. Dubonos and A. A. Firsov, Nature, 2005, 438, 197 CrossRef CAS PubMed.
- K. S. Novoselov, A. K. Geim, S. V Morozov, D. Jiang, Y. Zhang, S. V Dubonos, I. V Grigorieva and A. A. Firsov, Science, 2004, 306, 666–669 CrossRef CAS PubMed.
- D. Iannazzo, A. Pistone, M. Salamò, S. Galvagno, R. Romeo, S. V Giofré, C. Branca, G. Visalli and A. Di Pietro, Int. J. Pharm., 2017, 518, 185–192 CrossRef CAS PubMed.
- A. Alinejad, H. Raissi and H. Hashemzadeh, J. Biomol. Struct. Dyn., 2019, 1–9 Search PubMed.
- M. Shahabi and H. Raissi, J. Biomol. Struct. Dyn., 2018, 36, 2517–2529 CrossRef CAS PubMed.
- L. Zhang, J. Xia, Q. Zhao, L. Liu and Z. Zhang, Small, 2010, 6, 537–544 CrossRef CAS PubMed.
- Z. Hasanzade and H. Raissi, J. Mol. Model., 2017, 23, 36 CrossRef PubMed.
- H. Vovusha, D. Banerjee, M. K. Yadav, F. Perrozzi, L. Ottaviano, S. Sanyal and B. Sanyal, J. Phys. Chem. C, 2018, 122, 21031–21038 CrossRef CAS.
- J. Liu, L. Cui, N. Kong, C. J. Barrow and W. Yang, Eur. Polym. J., 2014, 50, 9–17 CrossRef CAS.
- V. K. Rana, M.-C. Choi, J.-Y. Kong, G. Y. Kim, M. J. Kim, S.-H. Kim, S. Mishra, R. P. Singh and C.-S. Ha, Macromol. Mater. Eng., 2011, 296, 131–140 CrossRef CAS.
- S. Zhang, P. Xiong, X. Yang and X. Wang, Nanoscale, 2011, 3, 2169–2174 RSC.
- X. C. Qin, Z. Y. Guo, Z. M. Liu, W. Zhang, M. M. Wan and B. W. Yang, J. Photochem. Photobiol., B, 2013, 120, 156–162 CrossRef CAS PubMed.
- J. Liu, L. Cui and D. Losic, Acta Biomater., 2013, 9, 9243–9257 CrossRef CAS PubMed.
- C. las Heras Alarcón, S. Pennadam and C. Alexander, Chem. Soc. Rev., 2005, 34, 276–285 RSC.
- A. S. Hoffman, P. S. Stayton, V. Bulmus, G. Chen, J. Chen, C. Cheung, A. Chilkoti, Z. Ding, L. Dong, R. Fong and others, J. Biomed. Mater. Res., 2000, 52, 577–586 CrossRef CAS PubMed.
- A. E. Smith, X. Xu and C. L. McCormick, Prog. Polym. Sci., 2010, 35, 45–93 CrossRef CAS.
- S. Pasban, H. Raissi, M. Pakdel and F. Farzad, Int. J. Pharm., 2019, 568, 118491 CrossRef CAS PubMed.
- H. El-Sherif, M. El-Masry and M. F. A. Taleb, J. Appl. Polym. Sci., 2010, 115, 2050–2059 CrossRef CAS.
- D. Fernández-Quiroz, J. Loya-Duarte, E. Silva-Campa, W. Argüelles-Monal, A.-í. Sarabia-Sainz, A. Lucero-Acuña, T. del Castillo-Castro, J. San Román, J. Lizardi-Mendoza, A. J. Burgara-Estrella and others, Appl. Polym. Sci., 2019, 136, 47831 CrossRef.
- G. Kocak, C. Tuncer and V. Bütün, Polym. Chem., 2017, 8, 144–176 RSC.
- L. Weng, H. C. Le, J. Lin and J. Golzarian, Int. J. Pharm., 2011, 409, 185–193 CrossRef CAS PubMed.
- H. Hashemzadeh and H. Raissi, Appl. Surf. Sci., 2020, 500, 144220 CrossRef CAS.
- L. Feng, K. Li, X. Shi, M. Gao, J. Liu and Z. Liu, Adv. Healthcare Mater., 2014, 3, 1261–1271 CrossRef CAS PubMed.
- E. Song, W. Han, C. Li, D. Cheng, L. Li, L. Liu, G. Zhu, Y. Song and W. Tan, ACS Appl. Mater. Interfaces, 2014, 6, 11882–11890 CrossRef CAS PubMed.
- G. Unsoy, R. Khodadust, S. Yalcin, P. Mutlu and U. Gunduz, Eur. J. Pharm. Sci., 2014, 62, 243–250 CrossRef CAS PubMed.
- L. Zhang, Z. Lu, Q. Zhao, J. Huang, H. Shen and Z. Zhang, Small, 2011, 7, 460–464 CrossRef CAS PubMed.
- H. Zarei, R. Kazemi Oskuee, M. Y. Hanafi-Bojd, L. Gholami, L. Ansari and B. Malaekeh-Nikouei, Pharm. Dev. Technol., 2019, 24, 127–132 CrossRef CAS PubMed.
- Y. Zhao and D. G. Truhlar, Theor. Chem. Acc., 2008, 120, 215–241 Search PubMed.
- A. Zaboli, H. Raissi, F. Farzad and H. Hashemzadeh, J. Mol. Liq., 2020, 112435 CrossRef CAS.
- S. F. Boys and F. de Bernardi, Mol. Phys., 1970, 19, 553–566 CrossRef CAS.
- T. Lu and F. Chen, J. Comput. Chem., 2012, 33, 580–592 CrossRef CAS PubMed.
- M. J. Abraham, T. Murtola, R. Schulz, S. Páll, J. C. Smith, B. Hess and E. Lindahl, SoftwareX, 2015, 1, 19–25 CrossRef.
- B. R. Brooks, C. L. Brooks, A. D. MacKerell, L. Nilsson, R. J. Petrella, B. Roux, Y. Won, G. Archontis, C. Bartels, S. Boresch and others, J. Comput. Chem., 2009, 30, 1545–1614 CrossRef CAS PubMed.
- W. L. Jorgensen, J. Chandrasekhar, J. D. Madura, R. W. Impey and M. L. Klein, J. Chem. Phys., 1983, 79, 926–935 CrossRef CAS.
- W. Humphrey, A. Dalke and K. Schulten, J. Mol. Graphics, 1996, 14, 33–38 CrossRef CAS PubMed.
- G. Bussi, D. Donadio and M. Parrinello, J. Chem. Phys., 2007, 126, 14101 CrossRef PubMed.
- H. J. C. Berendsen, J. P. M. van Postma, W. F. van Gunsteren, A. DiNola and J. R. Haak, J. Chem. Phys., 1984, 81, 3684–3690 CrossRef CAS.
- Y. Guo, X. Lu, J. Weng and Y. Leng, J. Phys. Chem. C, 2013, 117, 5708–5717 CrossRef CAS.
- O. A. Oyetade, B. S. Martincigh and A. A. Skelton, J. Phys. Chem. C, 2018, 122, 22556–22568 CrossRef CAS.
- J. Wang, G. Zhang and P. Zhang, Appl. Catal., B, 2018, 239, 77–85 CrossRef CAS.
- W. Zhang, Z. Guo, D. Huang, Z. Liu, X. Guo and H. Zhong, Biomaterials, 2011, 32, 8555–8561 CrossRef CAS PubMed.
- E. R. Johnson, S. Keinan, P. Mori-Sanchez, J. Contreras-García, A. J. Cohen and W. Yang, J. Am. Chem. Soc., 2010, 132, 6498–6506 CrossRef CAS PubMed.
- E. Espinosa and E. Molins, J. Chem. Phys., 2000, 113, 5686–5694 CrossRef CAS.
- K. R. Karnati and Y. Wang, Phys. Chem. Chem. Phys., 2018, 20, 9389–9400 RSC.
- A. Saberinasab, H. Raissi and H. Hashemzadeh, J. Phys. D. Appl. Phys., 2019, 52(39), 395402 CrossRef CAS.
Footnote |
| † Electronic supplementary information (ESI) available. See DOI: 10.1039/d0ra06705a |
| This journal is © The Royal Society of Chemistry 2020 |

