 Open Access Article
Facile sub-/supercritical water synthesis of nanoflake MoVTeNbOx-mixed metal oxides without post-heat treatment and their catalytic performance
Shuangming Liab,
Yongwei Liua,
Yaoxin Fana,
Zixuan Lua,
Yunong Yana,
Luyao Denga,
Zhe Zhanga and
Sansan Yu *ab
*ab
aCollege of Chemical Engineering, Shenyang University of Chemical Technology, No. 9, 11 St., Shenyang Economic & Technological Development Zone, Shenyang 110142, China. E-mail: ssyu@syuct.edu.cn; Fax: +86 24 89383760; Tel: +86 24 89381190
bKey Laboratory of Chemical Separation Technology of Liaoning Province, Shenyang University of Chemical Technology, Shenyang 110142, China
First published on 2nd November 2020
Abstract
A fast and simple sub-/supercritical water synthesis method is presented in this work in which MoVTeNbOx-mixed metal oxides with various phase compositions and morphologies could be synthesized without post-heat treatment. It was demonstrated that the system temperature for synthesis had a significant influence on the physico-chemical properties of MoVTeNbOx. Higher temperatures were beneficial for the formation of a mixed crystalline phase containing TeVO4, Te3Mo2V2O17, Mo4O11 and TeO2, which are very different from the crystalline phases of conventional Mo–V–Te–Nb-mixed metal oxides. While at lower temperatures, Mo4O11 was replaced by Te. At high temperature, the as-prepared samples presented distinct nanoflake morphologies with an average size of 10–60 nm in width and exhibited excellent catalytic performances in the selective oxidation of propylene to acrylic acid. It is illustrated that the large specific surface area, presence of Mo4O11 and superficial Mo6+ and Te4+ ions are responsible for the high propylene conversion, while suitable acidic sites and superficial Nb5+ ions improved the selectivity to acrylic acid.
1. Introduction
MoVTeNbOx-mixed metal oxides are the most significant and promising catalysts for the selective oxidation of propylene/propane to acrylic acid. It is reported that the conversion of feed and selectivity to products is closely related to the chemical composition, structure and morphology of MoVTeNbOx-mixed metal oxides, which depends greatly on the preparation methods.1,2To date, MoVTeNbOx-mixed oxides have been prepared by different synthesis routes, including slurry, co-precipitation, hydrothermal, dry-up and solid state reactions.3-7 Among them, slurry and hydrothermal methods are the most common options; however, both of the processes need long reaction times that can take dozens of hours.8-10 Furthermore, in order to improve the crystallinity and stability of products, a necessary post-heat treatment at 550–600 °C under a given atmosphere, lasting for several hours, is also involved in current routes. For instance, Ueda et al.5 synthesized three Mo–V–O based oxides with single crystals by using a hydrothermal method at 175 °C for 48 h followed by calcination under nitrogen atmosphere for 2 h at 600 °C. Mazloom et al. prepared MoVTeNbOx using a slurry method, in which continuous evaporation at 60 °C was needed, firstly to remove the water in the precursor solution and a subsequent calcination at 600 °C for 2 h under nitrogen atmosphere was then carried out.6 For the mixed oxides, most notably, these aforementioned complicated synthesis processes make complete reproduction difficult for other researchers. Therefore, it is urgent to develop a simple and fast route to prepare MoVTeNbOx-mixed oxides.
Nowadays, sub-/supercritical water is widely used in the preparation of metal- and non-metal-based nano/micro materials, due to the unique and adjustable physicochemical properties around its critical point.11-16 For instance, the low dielectric constant of sub-/supercritical water is conducive to the formation of nanoparticles of metal-based materials17-23 and the hybridization of nanoparticles.24 More importantly, under sub- and supercritical systems, the crystallization of metal-based products can be achieved in a very short time.13,23-27 This makes the follow-up heat treatment of product no longer necessary, simplifying the preparation process greatly. Diez-Garcia et al. prepared highly crystalline fibrillar tobermorite in just a few seconds under supercritical water.13 Lee et al. synthesized multivariate LiFePO4 composite metal oxides by sub- and supercritical water in 1 h.20 Zheng et al. synthesized pure-phase BaTeMo2O9 polycrystals in a supercritical water system.28 Moreover, this technology can easily achieve scaled-up production through continuous reaction with a simple flow type system. Nugroho and Hong et al. synthesized CoOx, MnOx and Li4Ti5O12, LiFePO4 nanoparticles by a continuous sub-/supercritical water process.21,22,29-32 To the best of our knowledge, however, there is no report on the synthesis of MoVTeNbOx-mixed metal oxides using sub- and supercritical water techniques at present.
Herein, a sub-/supercritical water technique is employed to fabricate MoVTeNbOx-mixed metal oxides directly. A series of products are obtained by adjusting the synthesis system temperature within 1 h and without post-heat treatment. It is noteworthy that the products do not contain the M1/M2 crystalline phase, which exists in the traditional Mo–V–Te–Nb-mixed metal oxides. Moreover, it is very interesting that certain as-prepared products present distinctive nanoflake structures with large specific surface areas. Furthermore, the catalysis results reveal that the as-prepared products can catalyze the oxidation of propylene to acrylic acid efficiently with the maximum conversion of 89% and selectivity of 59%. It is demonstrated that sub-/supercritical water is a simple, rapid and promising method to synthesize efficient MoVTeNbOx catalysts.
2. Experimental section
2.1 Preparation
A MoVTeNbOx-mixed oxide with a nominal Mo/V/Te/Nb atomic ratio of 1/0.31/0.37/0.065 was prepared by a sub-/supercritical water method. First, an aqueous solution containing (NH4)6Mo7O24·4H2O and NH4VO3 was prepared at room temperature. In parallel, TeO2 and Nb(HC2O4)5·xH2O were dispersed/dissolved in deionized water, respectively. Next, the aqueous suspension of TeO2 and Nb(HC2O4)5·xH2O solution was transferred into a Mo–V-mixed solution in sequence to form a light yellow slurry. The slurry was stirred at 80 °C for 1 h and then introduced into a SUS 316 tubular reactor with an inner volume of 10 mL. After being tightly sealed, the reactor was immersed into the molten salt bath (KNO3, NaNO3, and Ca(NO3)2 in the weight ratio of 46![[thin space (1/6-em)]](https://www.rsc.org/images/entities/char_2009.gif) :
:![[thin space (1/6-em)]](https://www.rsc.org/images/entities/char_2009.gif) 24
24![[thin space (1/6-em)]](https://www.rsc.org/images/entities/char_2009.gif) :
:![[thin space (1/6-em)]](https://www.rsc.org/images/entities/char_2009.gif) 30), which was heated to a desired temperature (250–450 °C) beforehand. After 1 h, the reactor was quenched in cold water. The resulting powders were filtered and washed with water several times. Then, the products were dried overnight at 90 °C under vacuum.
30), which was heated to a desired temperature (250–450 °C) beforehand. After 1 h, the reactor was quenched in cold water. The resulting powders were filtered and washed with water several times. Then, the products were dried overnight at 90 °C under vacuum.
For the nomenclature, the final dark powder products obtained at 250, 300, 350, 400 and 450 °C were labeled as S250, S300, S350, S400 and S450, respectively. All of the above reagents were analytical reagent (AR) grade and purchased from Sinopharm Chemical Reagent Co, Ltd. (Shanghai, China).
2.2 Characterization
The powder X-ray diffraction (XRD) patterns were recorded on an Empyrean X-ray generator (PANalytical B.V., Netherlands). Diffraction intensities were measured from 20 to 50° with a 2θ step of 0.01° for 8 s per point using Cu Kα radiation. The transmission electron microscopy (TEM) and energy dispersive X-ray spectroscopy (EDX) were carried out by using a TECNAI G2 F20 microscope (FEI, USA) equipped with an EDX analyzer system at an accelerating voltage of 200 kV. The X-ray photoelectron spectroscopy (XPS) was carried out on an ESCALAB250 spectrometer (Thermo Electron, USA). Hydrogen temperature-programmed reduction (H2-TPR) and ammonia temperature-programmed desorption (NH3-TPD) were carried out in a ChemBET system (Quantachrome, USA) equipped with a thermal conductivity detector. For H2-TPR, 0.1 g catalyst was reduced in 10% H2/Ar with a flow rate of 30 mL min−1 from room temperature to 800 °C at a heating rate of 10 °C min−1. For NH3-TPD, catalysts were carried out in 7% NH3/He from room temperature to 700 °C with the same heating rate. The specific surface area was recorded by the BET method using nitrogen adsorption–desorption isotherms at liquid nitrogen temperature of −196 °C on an Autosorb-IQ gas adsorption analyzer (Quantachrome, America).2.3 Catalytic tests
The catalytic performance of MoVTeNbOx-mixed oxides was evaluated under different temperatures ranging from 380 to 440 °C at atmospheric pressure. The experiments were carried out in a fixed-bed stainless steel tubular reactor (i.d. 8 mm; length 400 mm). After being tableted, crushed and sieved, 1.0 g of each catalyst was diluted with silica sands of the same quality in order to achieve homogeneous heat distribution within the catalyst bed, and then introduced in the middle of the reactor. Afterward, the reactor was heated to the desired temperature under the reaction gas feed flow composed of C3H6, H2O, N2 and O2 in the mole ratio of 1.0![[thin space (1/6-em)]](https://www.rsc.org/images/entities/char_2009.gif) :
:![[thin space (1/6-em)]](https://www.rsc.org/images/entities/char_2009.gif) 3.0
3.0![[thin space (1/6-em)]](https://www.rsc.org/images/entities/char_2009.gif) :
:![[thin space (1/6-em)]](https://www.rsc.org/images/entities/char_2009.gif) 8.0
8.0![[thin space (1/6-em)]](https://www.rsc.org/images/entities/char_2009.gif) :
:![[thin space (1/6-em)]](https://www.rsc.org/images/entities/char_2009.gif) 1.8. The reaction products were collected at a given time interval after being condensed with ice water and then analyzed by a gas chromatograph (GC7890, Agilent, USA) equipped with a thermal conductivity detector (TCD) and Porapak-Q column.
1.8. The reaction products were collected at a given time interval after being condensed with ice water and then analyzed by a gas chromatograph (GC7890, Agilent, USA) equipped with a thermal conductivity detector (TCD) and Porapak-Q column.
3. Results and discussion
3.1 Characterization
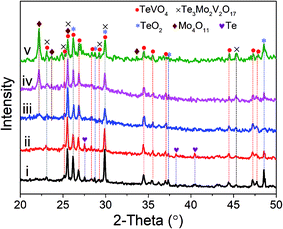
Fig. 1 shows the XRD patterns of as-prepared MoVTeNbOx-mixed oxide samples under different temperatures in a sub-/supercritical water system. For S250 and S300, the diffraction peaks are indexed to mixed phases of TeVO4, Te3Mo2V2O17, TeO2 and Te. These main peaks at 2θ = 23.0, 25.5, 26.1, 26.8, 29.8, 34.4, 44.4 and 47.2° are related to TeVO4 (JCPDS # 25-0930), the peaks located at 2θ = 23.0, 25.5, 26.1, 29.8, and 45.4° are attributable to Te3Mo2V2O17 (JCPDS # 35-0129), the peaks at 2θ = 26.1, 29.8, 37.3 and 48.5° are associated with TeO2 (JCPDS # 74-1666) and the peaks at 27.5, 38.2 and 40.4° correspond to Te (JCPDS # 36-1452). For S350, another phase (2θ = 22.1, 23.6 and 25.5°) corresponding to orthorhombic Mo4O11 (JCPDS # 65-2473) emerges in the pattern. Moreover, it is apparent that the relative peak intensity of Mo4O11 increases obviously when the temperature was elevated from 350 to 450 °C (see pattern iv and v). In contrast, the peaks belonging to Te become very weak from pattern iii to v.It is clear that the sub-/supercritical water system temperature had a substantial influence on the crystal phase composition of MoVTeNbOx-mixed oxides. Four phases including TeVO4, Te3Mo2V2O17, Te and Mo4O11 could be synthesized, in which the former two were the essential constituents, while Te and Mo4O11 were formed only under certain conditions. Higher temperatures were favorable for the fabrication of Mo4O11, whereas the formation of Te occurred at lower temperatures. It should be noted that the diffraction peaks of TeO2 existed in all samples, suggesting some tellurium dioxide did not participate in the reaction, but the morphology changed in the process. Moreover, Mo4O11 was an oxygen defect shear structure of MoO3.33 Based on this, it was possible that MoO3 was first formed via the decomposition of (NH4)6Mo7O24·4H2O and then further converted to Mo4O11 through phase evolution under the sub-/supercritical water system with a rapid heating and quenching process.34 No phase formed by Nb was observed, which is probably due to the insertion of Nb into the lattice of other mixed oxide systems (TeVO4 and Te3Mo2V2O17) as a substitution element for V.35 The above results reveal that MoVTeNbOx-mixed oxides with different crystal phase compositions can be facilely and controllably fabricated by adjusting the synthesis system temperature.
Fig. 2 and 3 show the TEM and HRTEM images and EDX analyses of as-synthesized MoVTeNbOx-mixed oxides at different synthesis system temperatures. As shown in Fig. 2, S250 and S300 present obvious assembled morphologies that form aggregates of small particles (Fig. 2a–c), whereas S350, S400 and S450 display distinct nanoflake-like morphologies (Fig. 3a–c). On the one hand, such a morphology change of MoVTeNbOx can be explained by the crystal re-growth resulting from the improved solubility of products at the higher temperature. Small crystalline nuclei were first formed in a supersaturated solution and then followed by subsequent crystal growth, which is just like the Ostwald ripening process.36,37 On the other hand, according to the XRD patterns in Fig. 1, orthorhombic Mo4O11 arose when the preparation temperature increased from 300 to 350 °C. It was documented that the orthorhombic crystal system is inclined to anisotropic growth and easily forms flakes.38 Therefore, the existence of orthorhombic Mo4O11 in these samples might be another reason for the change of morphology. Furthermore, it is noteworthy that with the increase of synthesis system temperature, the dimension of these flakes evolves gradually from slender (average size of 10 nm in width and 200 nm in length for S350) (Fig. 3a) to short and thick (average size of 60 nm in width and 100 nm in length for S450) (Fig. 3c). According to crystal growth theory, the crystal morphology is usually determined by the relative growth rate of the different crystal faces.39 Therefore, it was inferred that the surface energy of each crystal face of the product was different under the given sub-/supercritical water system, leading to various growth rates between crystal faces. Consequently, nanoflakes with different widths and lengths were formed along with the elimination of fast growing crystal facets and the preservation of slow ones. EDX analyses in Fig. 2b and c and 3a–c further indicate the presence of Mo, V, Te and Nb in MoVTeNbOx samples. Moreover, the detailed HRTEM characterizations show that various interplanar spacing d values are observed in S350–S450 (Fig. 3d–i), among which 0.352, 0.333 and 0.337 nm can be attributed to the (−111), (−112) and (102) lattice planes of TeVO4, 0.406 nm corresponds to the (101) lattice plane of TeO2 or (600) of Mo4O11, while 0.397, 0.398, 0.400, and 0.336 nm are assigned to the (211) and (002) lattice planes of Mo4O11, respectively.
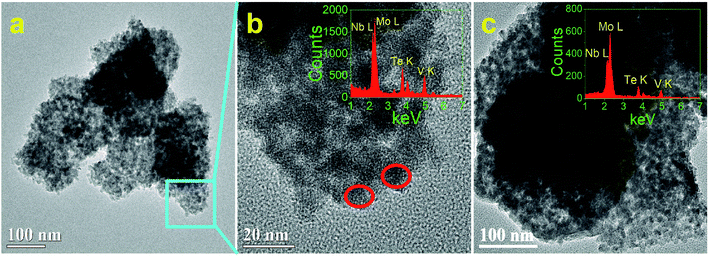 | ||
| Fig. 2 TEM, HRTEM images and EDX analyses of MoVTeNbOx samples, S250 (a and b) and S300 (c). ((b) is the detailed morphology of the zone marked in (a), and the insets are the corresponding EDX). | ||
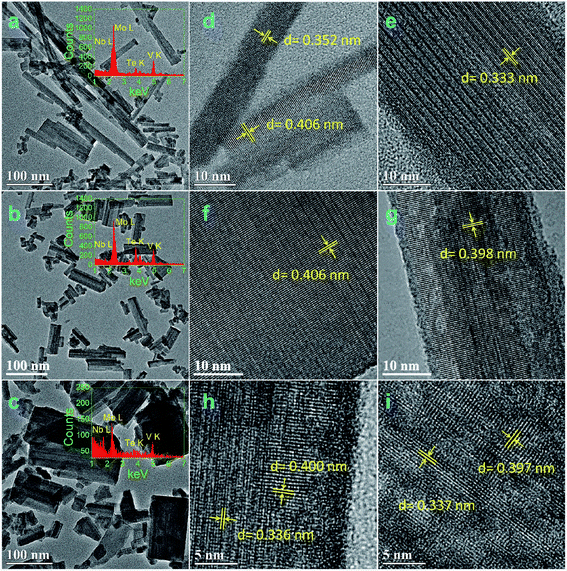 | ||
| Fig. 3 TEM, HRTEM images and EDX analyses of MoVTeNbOx samples, S350 (a, d, e), S400 (b, f, g), and S450 (c, h, i) (the insets are the corresponding EDX). | ||
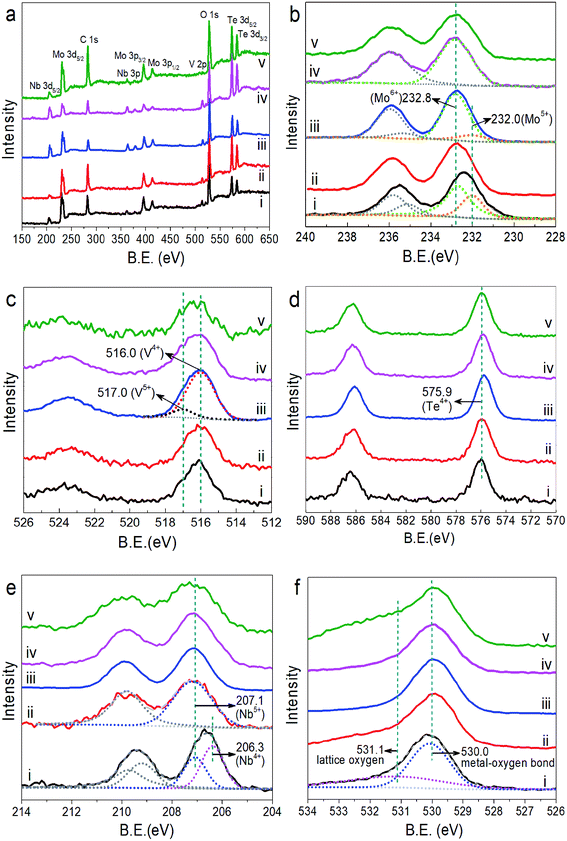
XPS was applied to investigate the element valence state on the sample surface. Fig. 4 presents the XPS survey spectrum and high resolution spectra of Mo 3d, V 2p, Te 3d, Nb 3d and O 1s of MoVTeNbOx, in which XPS spectra were calibrated to the adventitious C 1s peak at a binding energy of 284.6 eV. In the XPS survey spectra (Fig. 4a), five peaks centered at around 232.8, 516.0, 575.9, 207.1 and 530.0 eV correspond to Mo 3d5/2, V 2p3/2, Te 3d5/2, Nb 3d5/2 and O 1s, respectively.40-44 Fig. 4b shows that the Mo 3d5/2 BE peak of S250 can be split into two peaks at 232.8 and 232.0 eV, indicating that the surface Mo species consist of Mo6+ and Mo5+.45,46 For S300 and S350, there are also both Mo6+ and Mo5+. However, considering that the peak values are closer to 232.8 eV, the amount of Mo6+ largely outweighs that of Mo5+. Split peak fitting further verifies this. On the surface of S400 and S450, only Mo6+ is detected, illustrating that higher synthesis temperatures are favorable for the enrichment of Mo6+ on the sample surface. For V, two valence states of +4 (516.0 eV) and +5 (517.0 eV)43,46 exist on the surface of all MoVTeNbOx samples (Fig. 4c), and it is clear that V4+ has the highest concentration. In Fig. 4d, the BE value around 575.9 eV (Te 3d5/2) can be attributed to Te4+,42,,47,48 demonstrating tellurium is in a uniform state on the sample surfaces. As Fig. 4e shown, the Nb 3d peak of S250 is split into two peaks at 206.3 and 207.1 eV, which are ascribed to Nb4+ and Nb5+, respectively.48-50 Unlike S250, only Nb5+ exists in the samples of S300–S450. It can be seen from Fig. 4b and e that more low valence metal ions such as Mo5+ and Nb4+ exist on the surface of S250 than that of S300–S450, which is probably due to the weaker oxidation of sub-critical water at low temperatures. Furthermore, the peaks of O 1s can be fit into two peaks centered at binding energies of 530.0 and 531.1 eV, which belong to the typical metal–oxygen bonding and lattice oxygen, respectively.44,51
The acid sites of as-synthesized samples were determined by NH3-TPD and the profiles are presented in Fig. 5a. According to the literature, the desorption peaks centered at 250 °C and 624 °C in the profile of sample S250, marked as α and β, can be attributed to weak and strong acidic sites, respectively.52,53 With the increase of synthesis temperature from 250 to 400 °C, the area of peak α is continuously enlarged, meanwhile, an obvious shift of peak β to higher temperatures (from 624 °C for S250 to 710 °C for S450) is observed. In addition, another desorption peak γ, also corresponding to strong acidic sites, emerges at 577 °C in the curve of S400, which is enlarged greatly in S450. Unlike the former four samples, S450 possesses peak δ (326 °C) related to medium acidic sites52,53 instead of peak α. According to the results of XRD and XPS, it could be seen that the amount of the Mo4O11 phase, Mo6+ and Nb5+ increased evidently with the increase of synthesis system temperature. It was reported that metallic oxides with high valence states could behave as acidic oxides.33 Therefore, the increase of Mo6+, Nb5+ and the corresponding phase could be responsible for the shift of acid sites to high temperature and abundance.
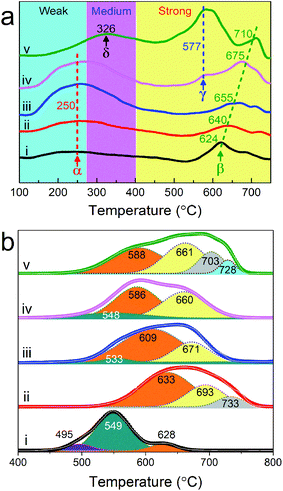 | ||
| Fig. 5 NH3-TPD (a) and H2-TPR (b) profiles of MoVTeNbOx. S250 (i), S300 (ii), S350 (iii), S400 (iv) and S450 (v). | ||
The reduction behaviors of MoVTeNbOx are examined by H2-TPR. As Fig. 5b shows, six types of reduction peaks at 495 (I), 533–549 (II), 586–633 (III), 660–693 (IV), 703–733 (V) and 728 °C (VI) are observed in the H2-TPR profiles of samples. It is documented that the peak type I, II and III at low temperature originate from the reduction of metal cation (Mo6+, V5+ and Te4+) species in mixed metal oxides54-57 while type IV can be attributed to the reduction of TeMoOx.58 Moreover, the peak type V and VI at high temperatures are likely related to the monometallic oxide. According to the study, the reduction temperature can reflect the migration of lattice oxygen from the bulk to the surface.57 Therefore, the S250 sample exhibited the greatest reducibility of lattice oxygen. In addition, these samples display changes in the TPR patterns depending on the synthesis system temperature and there is an obvious tendency for reduction peaks to move towards high temperatures from S250 to S450. The total peak areas of S300, S350, S400 and S450 are larger than that of S250, indicating that the number of lattice oxygens in samples increased dramatically59 when the synthesis system temperature was higher than 250 °C.
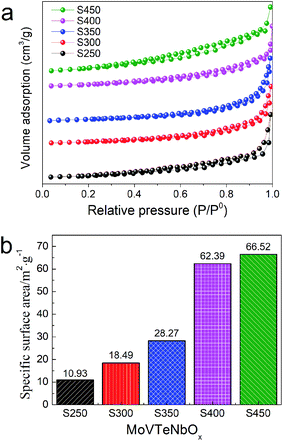
The N2 adsorption–desorption isotherms and specific surface area of the samples are shown in Fig. 6. The isotherm profiles of all the samples exhibit a type III isotherm based on the IUPAC classification, featuring an H3-type hysteresis loop in the relative pressure (P/P0) of 0.2–1.0 (Fig. 6a). In addition, with the increase of synthesis system temperature, the specific surface area of samples is increased progressively. As shown in Fig. 6b, S250 shows the lowest specific surface area of 10.93 m2 g−1, while S450 as-prepared at the highest temperature possesses the maximal specific surface area of 66.52 m2 g−1. S300, S350 and S400 exhibit that of 18.49, 28.27 and 62.39 m2 g−1, respectively. In view of the close relationship between the specific surface area and morphology, it was supposed that the low specific surface areas of S250 and S300 could be ascribed to the agglomeration of particles.
3.2 Catalytic performance
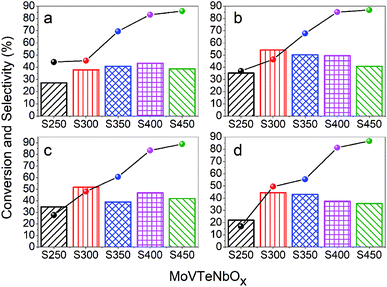
The catalytic performance of as-prepared MoVTeNbOx was tested for the selective oxidation of propylene to acrylic acid at different catalytic temperatures with an interval of 20 °C (380, 400, 420 and 440 °C) and the results are shown in Fig. 7. It can be observed that there is an apparent rising trend in propylene conversion with the increase of synthesis system temperature (from S250 to S450) for all catalytic temperatures (see line chart in Fig. 7), and the conversion reaches a maximum of 89% at 420 °C for sample S450 (Fig. 7c). Furthermore, the selectivity to acrylic acid ranges from 22.07% to 54.16%, in which sample S250 and S300 exhibit the minimum and maximum at catalytic temperatures of 400 °C and 440 °C, respectively. It is apparent that the catalytic temperature had a great influence on the selectivity to acrylic acid, and almost all samples exhibit the maximum selectivity at 400 °C.It is well known that the activity of a catalyst is greatly affected by the specific surface area. In this work, the trend of propylene conversion was completely consistent with that of the specific surface area of samples (Fig. 6b and 7). S450 possessed the largest specific surface area, which is one of the main reasons for its maximum propylene conversion. In addition, S450 and S400 contained more of the Mo4O11 phase (Fig. 1), an oxygen defect shear structure of MoO3, which has shown excellent catalytic activity for the oxidation of propylene.33,60 The XPS results showed that there were abundant superficial Mo6+ ions in the samples, which also played an important role in such a reaction. On the one hand, Mo6+ could strengthen the binding of the catalyst with the organic fragment, facilitating the hydrolysis reaction of this surface complex on its path towards acrylic acid formation.61 On the other, the synergism of Mo6+ and Te4+ could abstract an allylic hydrogen from propylene, improving the conversion of propylene.62 For the same reason, the lowest ratio of Mo6+/Mo5+ of S250 might be another reason for its lowest propylene conversion. Although S250 possessed the greatest reducibility of lattice oxygen (Fig. 5b), it did not seem to play a significant role in activating propylene.
Compared with the other four catalysts, S250 showed the worst selectivity to acrylic acid at all catalytic temperatures, which might be attributed to the less weak acidic sites and more strong acidic sites (see Fig. 5a). It is documented that the superficial acid–base properties of a catalyst have an important effect on the selectivity of partial oxidation reactions.8,46 The ideal acidity of the catalyst should be able to interact properly with the reactant and target product to facilitate desorption of target products, avoiding over-oxidation. Besides S250, the average selectivity of S450 was also significantly lower than that of S300, S350 and S400, which was ascribed to the over-oxidation caused by the more strong acidic sites. In addition, Nb was also considered to improve the selectivity to acrylic acid by reducing the over-oxidation rate of acrylic acid.5,35 Based on this, it was speculated that the more superficial niobium ions with low valence states of S250 (Fig. 4e) had an adverse impact on its selectivity.
Time-on-stream experiments were also carried out to investigate the stability of the prepared catalyst. Taking S400 catalyst as an example, the time-on-stream results of selective oxidation of propylene to acrylic acid over MoVTeNbOx at 400 °C are shown in Fig. 8. It is revealed that the conversion of propylene and selectivity to acrylic acid is well-maintained during a 30 h reaction test.
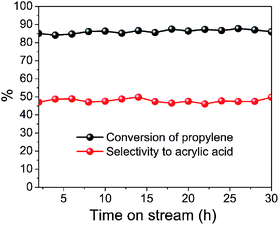 | ||
| Fig. 8 Time-on-stream of selective oxidation of propylene to acrylic acid over MoVTeNbOx (S400 catalyst) at 400 °C. | ||
In addition, the structure and performance of the catalysts in this work were compared with the MoVTeNbOx-mixed metal oxides prepared conventionally. It was documented that the most important factor affecting the performance of MoVTeNbOx catalyst is the phase composition. The phases of conventional MoVTeNbOx catalysts for propylene oxidation to acrylic acid consist of M1, M2, Mo5−x(V/Nb)xO14, V0.95Mo0.97Ox, TeMo5O16, TeMo4O13 and V0.33Mo0.67O2. It was reported that the conversion of propylene and selectivity to acrylic acid range from 4.5–86.9% and 0–89.6%, respectively.7,61,63,64 Among which, the highest yield of 56.1% could be obtained when the crystal phase of the catalyst was pure M1.63 In this work, distinct phases consisting of TeVO4, Te3Mo2V2O17, Mo4O11 and TeO2 were detected. Nevertheless, the results showed that these catalysts also exhibit good performance, in which the highest conversion and selectivity achieved 88.9% and 54.2%, respectively.
4. Conclusions
Five MoVTeNbOx-mixed metal oxides were fabricated simply and rapidly by using a sub-/supercritical water technique without a post-heat treatment and their catalytic performance were investigated. It is concluded that the crystalline phase, morphology, surface properties, as well as acidic and redox properties were influenced greatly by the synthesis system temperature. Nanoflake-like MoVTeNbOx consisting of TeVO4, Te3Mo2V2O17, Mo4O11 and TeO2 were obtained at 400–450 °C, showing large specific surface areas of ca. 62–66 m2 g−1. Compared with the others, the samples prepared at 250 °C possessed more superficial Mo5+ and Nb4+. In the process of catalytic reaction, there was a significant positive correlation between the conversion of propylene and the specific surface area of the samples. A certain amount of Mo4O11 and superficial Mo6+, Te4+ ions also contributed to the conversion. Samples prepared at 300–400 °C owning suitable acidic sites and adequate superficial Nb5+ ions showed excellent selectivity to acrylic acid, in which the maximum yield of acrylic acid reached 43%. For the synthesis of a MoVTeNbOx catalyst with excellent catalytic performance, it is demonstrated that sub-/supercritical water is a simple, rapid and promising method.Conflicts of interest
There are no conflicts of interest to declare.Acknowledgements
The authors gratefully acknowledge the financial supports by the National Natural Science Foundation of China (Grant No. 21706165), Scientific Research Fund of Liaoning Provincial Education Department, China (Grant No. LQ2019007) and the Natural Science Foundation of Liaoning Province, China (Grant No. 20170540714).References
- J. S. Valente, H. Armendáriz-Herrera, R. Quintana-Solórzano, P. del Ángel, N. Nava, A. Massó and J. M. López Nieto, ACS Catal., 2014, 4, 1292–1301 CrossRef CAS.
- E. V. Ishchenko, T. V. Andrushkevich, G. Y. Popova, T. Y. Kardash, A. V. Ishchenko, L. S. Dovlitova and Y. A. Chesalov, Appl. Catal., A, 2014, 476, 91–102 CrossRef CAS.
- H. Watanabe and Y. Koyasu, Appl. Catal., A, 2000, 194–195, 479–485 CrossRef CAS.
- H. Jiang, W. Lu and H. Wan, Catal. Commun., 2004, 5, 29–34 CrossRef CAS.
- W. Ueda, D. Vitry and T. Katou, Catal. Today, 2005, 99, 43–49 CrossRef CAS.
- G. Mazloom and S. M. Alavi, Part. Sci. Technol., 2014, 33, 204–212 CrossRef.
- D. Vitry, Y. Morikawa, J. L. Dubois and W. Ueda, Appl. Catal., A, 2003, 251, 411–424 CrossRef CAS.
- S. Hernández-Morejudo, A. Massó, E. García-González, P. Concepción and J. M. López Nieto, Appl. Catal., A, 2015, 504, 51–61 CrossRef.
- L. Annamalai, Y. Liu, S. Ezenwa, Y. Dang, S. L. Suib and P. Deshlahra, ACS Catal., 2018, 8, 7051–7067 CrossRef CAS.
- A. L. Pacquette, D. S. Oh and A. A. Gewirth, J. Phys. Chem. C, 2016, 120, 15553–15562 CrossRef CAS.
- M. Claverie, M. Diez-Garcia, F. Martin and C. Aymonier, Chemistry, 2019, 25, 5814–5823 CrossRef CAS.
- H. Weingartner and E. U. Franck, Angew. Chem., 2005, 44, 2672–2692 CrossRef.
- M. Diez-Garcia, J. J. Gaitero, J. S. Dolado and C. Aymonier, Angew. Chem., Int. Ed. Engl., 2017, 56, 3162–3167 CrossRef CAS.
- C. Aymonier, G. Philippot, A. Erriguible and S. Marre, J. Supercrit. Fluids, 2018, 134, 184–196 CrossRef CAS.
- S. P. Sasikala, P. Poulin and C. Aymonier, Adv. Mater., 2017, 29, 1605473 CrossRef.
- T. Voisin, A. Erriguible, D. Ballenghien, D. Mateos, A. Kunegel, F. Cansell and C. Aymonier, J. Supercrit. Fluids, 2017, 120, 18–31 CrossRef CAS.
- L. Maurizi, F. Bouyer, M. Ariane, R. Chassagnon and N. Millot, RSC Adv., 2014, 4, 45673–45678 RSC.
- A. Aimable, H. Muhr, C. Gentric, F. Bernard, F. Le Cras and D. Aymes, Powder Technol., 2009, 190, 99–106 CrossRef CAS.
- B. Jiang, C. Li, M. Imura, J. Tang and Y. Yamauchi, Adv. Sci., 2015, 2, 1500112 CrossRef.
- J. Lee and A. S. Teja, Mater. Lett., 2006, 60, 2105–2109 CrossRef CAS.
- A. Nugroho, D. Yoon, O.-S. Joo, K. Y. Chung and J. Kim, Chem. Eng. J., 2014, 258, 357–366 CrossRef CAS.
- A. Nugroho and J. Kim, J. Ind. Eng. Chem., 2014, 20, 4443–4446 CrossRef CAS.
- M. Diez-Garcia, J. J. Gaitero, J. I. Santos, J. S. Dolado and C. Aymonier, J. Flow Chem., 2018, 8, 89–95 CrossRef CAS.
- H. Hayashi and Y. Hakuta, Materials, 2010, 3, 3794–3817 CrossRef CAS.
- T. Adschiri, Y. Hakuta and K. Arai, Ind. Eng. Chem. Res., 2000, 39, 4901–4907 CrossRef CAS.
- Y. Hakuta, H. Hayashi and K. Arai, Curr. Opin. Solid State Mater. Sci., 2003, 7, 341–351 CrossRef CAS.
- R. B. Yahya, H. Hayashi, T. Nagase, T. Ebina, Y. Onodera and N. Saitoh, Chem. Mater., 2001, 13, 842–847 CrossRef CAS.
- Q. Zheng, B. Li and X. Tao, CrystEngComm, 2011, 13, 750–752 RSC.
- S.-A. Hong, S. J. Kim, K. Y. Chung, Y.-W. Lee, J. Kim and B.-I. Sang, Chem. Eng. J., 2013, 229, 313–323 CrossRef CAS.
- S.-A. Hong, S. J. Kim, K. Y. Chung, M.-S. Chun, B. G. Lee and J. Kim, J. Supercrit. Fluids, 2013, 73, 70–79 CrossRef CAS.
- S.-A. Hong, S. J. Kim, J. Kim, B. G. Lee, K. Y. Chung and Y.-W. Lee, Chem. Eng. J., 2012, 198–199, 318–326 CrossRef CAS.
- A. Nugroho, S. J. Kim, K. Y. Chung, B.-W. Cho, Y.-W. Lee and J. Kim, Electrochem. Commun., 2011, 13, 650–653 CrossRef CAS.
- J. C. Védrine, E. K. Novakova and E. G. Derouane, Catal. Today, 2003, 81, 247–262 CrossRef.
- M. Mihalev, C. Hardalov, C. Christov, M. Michailov, B. Ranguelov and H. Leiste, J. Phys.: Conf. Ser., 2014, 514, 012022 CrossRef.
- W. Ueda, D. Vitry and T. Katou, Catal. Today, 2004, 96, 235–240 CrossRef CAS.
- S. Sun, P. Li, S. Liang and Z. Yang, Nanoscale, 2017, 9, 11357–11404 RSC.
- C. Coughlan, M. Ibanez, O. Dobrozhan, A. Singh, A. Cabot and K. M. Ryan, Chem. Rev., 2017, 117, 5865–6109 CrossRef CAS.
- G. Tan, J. Huang, L. Zhang, H. Ren and A. Xia, Ceram. Int., 2014, 40, 11671–11679 CrossRef CAS.
- J. B. Rawlings, S. M. Miller and W. R. Witkowski, Ind. Eng. Chem. Res., 1993, 32, 1275–1296 CrossRef CAS.
- E. V. Ishchenko, R. V. Gulyaev, T. Y. Kardash, A. V. Ishchenko, E. Y. Gerasimov, V. I. Sobolev and V. M. Bondareva, Appl. Catal., A, 2017, 534, 58–69 CrossRef CAS.
- R. López-Medina, M. O. Guerrero-Pérez and M. A. Bañares, New J. Chem., 2019, 43, 17661–17669 RSC.
- T. Y. Kardash, E. V. Lazareva, D. A. Svintsitskiy, E. P. Kovalev and V. M. Bondareva, Kinet. Catal., 2019, 60, 355–365 CrossRef CAS.
- Y. S. Yun, M. Lee, J. Sung, D. Yun, T. Y. Kim, H. Park, K. R. Lee, C. K. Song, Y. Kim, J. Lee, Y.-J. Seo, I. K. Song and J. Yi, Appl. Catal., B, 2018, 237, 554–562 CrossRef CAS.
- H. W. Nam, C. V. V. M. Gopi, S. Sambasivam, R. Vinodh, K. V. G. Raghavendra, H.-J. Kim, I. M. Obaidat and S. Kim, J. Energy Storage, 2020, 27, 101055 CrossRef.
- K. Asakura, K. Nakatani, T. Kubota and Y. Iwasawa, J. Catal., 2000, 194, 309–317 CrossRef CAS.
- E. V. Ishchenko, T. Y. Kardash, R. V. Gulyaev, A. V. Ishchenko, V. I. Sobolev and V. M. Bondareva, Appl. Catal., A, 2016, 514, 1–13 CrossRef CAS.
- X. Yang, R. Feng, W. Ji and C. Au, J. Catal., 2008, 253, 57–65 CrossRef CAS.
- G. Wang, Y. Guo and G. Lu, Fuel Process. Technol., 2015, 130, 71–77 CrossRef CAS.
- G. Mestl, J. L. Margitfalvi, L. Végvári, G. P. Szijjártó and A. Tompos, Appl. Catal., A, 2014, 474, 3–9 CrossRef CAS.
- M. K. Bahl, J. Phys. Chem. Solids, 1975, 36, 485–491 CrossRef CAS.
- M. Hua, L. Xu, F. Cui, J. Lian, Y. Huang, J. Bao, J. Qiu, Y. Xu, H. Xu, Y. Zhao and H. Li, J. Mater. Sci., 2018, 53, 7621–7636 CrossRef CAS.
- N. Karanwal, D. Verma, P. Butolia, S. M. Kim and J. Kim, Green Chem., 2020, 22, 766–787 RSC.
- V. Ranaware, D. Verma, R. Insyani, A. Riaz, S. M. Kim and J. Kim, Green Chem., 2019, 21, 1021–1042 RSC.
- B. Chu, H. An, X. Chen and Y. Cheng, Appl. Catal., A, 2016, 524, 56–65 CrossRef CAS.
- R.-M. Feng, X.-J. Yang, W.-J. Ji, H.-Y. Zhu, X.-D. Gu, Y. Chen, S. Han and H. Hibst, J. Mol. Catal. A: Chem., 2007, 267, 245–254 CrossRef CAS.
- X.-J. Yang, R.-M. Feng, W.-J. Ji and C.-T. Au, J. Catal., 2008, 253, 57–65 CrossRef CAS.
- Z. Deng, H. Wang, W. Chu and W. Yang, Chin. J. Catal., 2008, 29, 1032–1036 CrossRef CAS.
- I. Ramli, P. Botella, F. Ivars, W. Pei Meng, S. M. M. Zawawi, H. A. Ahangar, S. Hernández and J. M. L. Nieto, J. Mol. Catal. A: Chem., 2011, 342–343, 50–57 CrossRef CAS.
- H. Wang, Z. Deng, W. Chu and W. Yang, Chin. J. Catal., 2009, 30, 490–496 CAS.
- T. V. Andrushkevich, L. M. Plyasova, G. G. Kuznetsova, V. M. Bondareva, T. P. Gorshkova, I. P. Olenkova and N. I. Lebedeva, React. Kinet. Catal. Lett., 1979, 12, 463–467 CrossRef CAS.
- R. K. Grasselli, C. G. Lugmair, A. F. Volpe, A. Andersson and J. D. Burrington, Catal. Lett., 2008, 126, 231–240 CrossRef CAS.
- R. K. Grasselli, Catal. Today, 2005, 99, 23–31 CrossRef CAS.
- F. Ivars, B. Solsona, S. Hernández and J. M. López Nieto, Catal. Today, 2010, 149, 260–266 CrossRef CAS.
- R. K. Grasselli, C. G. Lugmair, A. F. Volpe Jr, A. Andersson and J. D. Burrington, Catal. Today, 2010, 157, 33–38 CrossRef CAS.
| This journal is © The Royal Society of Chemistry 2020 |

