 Open Access Article
Creative Commons Attribution 3.0 Unported Licence
TiN nanotube supported Ni catalyst Ni@TiN-NTs: experimental evidence of structure–activity relations in catalytically hydrolyzing ammonia borane for hydrogen evolution†
Yawei Liu,
Jun Zhang *,
Quanxing Liu and
Xiang Li
Chemical Engineering & Pharmaceutics School, Henan University of Science & Technology, Luoyang 471023, China. E-mail: j-zhang@126.com
First published on 8th October 2020
Abstract
With commercial TiO2 as the precursor, titanium nitride nanotubes (TiN-NTs) were fabricated through a hydrothermal – ammonia nitriding route, and next non-noble metal nanosized Ni particles were evenly and firmly anchored on the surface of the TiN-NTs via a PVP-mediated non-aqueous phase reduction–deposition strategy, to obtain the supported catalyst Ni@TiN-NTs. The X-ray powder diffraction (PXRD), field emission scanning and transmission electron microscopy (FE-SEM/TEM) and specific surface area measurements were used to characterize and analyze the phase composition, surface microstructure and morphological features of the product. The catalytic activity of the Ni@TiN-NTs for hydrolyzing ammonia borane to generate hydrogen (H2) under different conditions was evaluated systematically. The results reveal that the as-fabricated TiN-NTs are composed of TiN and a small amount of TiNxOy with the approximate molar atomic ratio of Ti to N at 1![[thin space (1/6-em)]](https://www.rsc.org/images/entities/char_2009.gif) :
:![[thin space (1/6-em)]](https://www.rsc.org/images/entities/char_2009.gif) 1, existing as hollow microtubules with mean tube diameter of 130 nm and length of about 1 μm. Via in situ reduction and deposition, Ni nanoparticles can be uniformly anchored on the surface of TiN-NTs. The catalytic activities of Ni(x)@TiN-NTs with different Ni loading amounts are all higher than that of single metal Ni nanoparticles. The temperature has a positive effect on the catalytic activity of Ni(20)@TiN-NTs, and its total turnover frequency for hydrolyzing ammonia borane is 11.73 mol(H2) (mol Ni)−1 min−1, with an apparent activation energy of 52.05 kJ mol−1 at 303 K. After 5 cycles, the Ni(20)@TiN-NTs catalyst still maintains 87% of the initial catalytic activity. It could be suggested that these tactics can also be extended to the fabrication of other metal or alloy catalysts supported by TiN-NTs, with great application potential and development prospects.
1, existing as hollow microtubules with mean tube diameter of 130 nm and length of about 1 μm. Via in situ reduction and deposition, Ni nanoparticles can be uniformly anchored on the surface of TiN-NTs. The catalytic activities of Ni(x)@TiN-NTs with different Ni loading amounts are all higher than that of single metal Ni nanoparticles. The temperature has a positive effect on the catalytic activity of Ni(20)@TiN-NTs, and its total turnover frequency for hydrolyzing ammonia borane is 11.73 mol(H2) (mol Ni)−1 min−1, with an apparent activation energy of 52.05 kJ mol−1 at 303 K. After 5 cycles, the Ni(20)@TiN-NTs catalyst still maintains 87% of the initial catalytic activity. It could be suggested that these tactics can also be extended to the fabrication of other metal or alloy catalysts supported by TiN-NTs, with great application potential and development prospects.
Research and development of hydrogen energy, recognized as a new green energy with high efficiency and eco-friendliness, is increasingly attracting extensive attention.1,2 Safe, convenient and controllable hydrogen storage/release tactics is the premise and basis for large-scale utilization of hydrogen energy, which is also the key factor restricting the rapid development of the hydrogen energy economy, still confronting much theoretical and technical challenges so far.3–6 Ammonia borane (AB, NH3BH3) is a typical representative of chemical hydrogen storage materials with a theoretical hydrogen storage capacity of 19.6 wt%, regarded as the compound with the highest hydrogen content found up to now.7,8 AB can exist in the solid state under the atmospheric environment, with the unique physicochemical properties such as nontoxicity, incombustiblity, no corrosion and no explosion so on. Moreover, AB can release hydrogen gas (H2) in a controllable manner via catalytic hydrolysis or alcoholysis, which is thus considered as an ideal hydrogen storage medium for fuel cells.9 It is well documented in current studies that most of the catalysts for hydrolyzing ammonia borane to release H2 are made up of precious metals acted as the main active ingredient.10–13 Although these catalysts hold good catalytic activity, the high price limits their large-scale application. Therefore, to seek new catalysts with high activity and low cost is of urgent practical demand, with the considerably potential R&D prospect. Titanium nitride (TiN), as a kind of multifunctional metal ceramic with some unique physicochemical properties, is causing wide concern in recent years.14,15 Due to inserting N atoms into the Ti metal lattice, the d-band holes increase and the Fermi energy level drops, rendering the similar surface properties of TiN with those of Pt-group noble metals.16,17 Thus, the TiN metal ceramic is endowed with high hardness, low density, high strength, corrosion resistance and good electrical conductivity, which has made it find lots of applications in the catalytic materials,18 electrode materials19 and other fields. In contrast, nanotube-like microstructured TiN, or TiN-NTs, possesses the relatively larger specific surface area and pore volume. Owing to the complicated multi-dimensional structure and charged network that are conducive to the directional and rapid electron conduction, the TiN-NTs gives particular edge as the catalyst carrier.20–22 Fabian and coworkers23 prepared the carbon-coated TiN nanotube array material, and used it as the cathode of the supercapacitor, finding that the cathode holds excellent reversibility for charge storage. Pan et al.24 loaded Pt onto TiN nanotubes and experimentally validated that its catalytic activity for oxygen reduction was significantly enhanced. The current research findings manifest that TiN with regular and ordered nanotube texture could engender obvious collaborative or synergistic effect with some metal atoms (e.g. Pt, Pd, etc.), thus generating more active sites on its surface, and effectively improving its catalytic ability. Based on the above cognition and analysis for the structure–activity relationship of the TiN-NTs, via elaborately designing the hydrothermal treatment-nitriding synthesis route, we first fabricated TiN-NTs microarchitectures with regular profiles; and then by way of the solvothermal reduction-deposition tactics that was in situ mediated by PVP, non-noble metal Ni nanoparticles were dispersed and immobilized on the TiN-NTs surface, to obtain highly efficient and low-cost Ni@TiN-NTs supported catalyst with no noble metals contained. Meanwhile, a set of feasible device and scheme were devised to scientifically evaluate the catalytic ability of Ni@TiN-NTs on hydrolyzing ammonia borane to release H2, and satisfactory results were obtained.
1 Experimental
1.1 Reagents and instruments
Titanium dioxide (TiO2, 99%), nitric acid (HNO3, 65%), sodium hydroxide (NaOH, 98%), ethylene glycol ((CH2OH)2, EG, 99%), nickel chloride (NiCl2·6H2O, 98%), hydrazine hydrate (N2H4·H2O, 85%), absolute ethyl alcohol (C2H5OH, 98%) and polyvinylpyrrolidone (PVP, Mw = 1 × 10⁴), are pure analytical reagents purchased from Shanghai Sinopharm Group and used directly without further purification. Ammonia borane (NH3BH3, referred to as AB) was prepared in our laboratory according to the method depicted in the related report.25 Based on our comprehensive analysis, the purity of as-prepared AB was determined to be no less than 98%.9 The water used in the whole experiment was doubly distilled water, whose conductivity (298 K) was less than 1.0 μS cm−1. The phase structure of the serial products was analyzed by X-ray powder diffraction (PXRD) (Advance-D8, Bruker, Germany). Their morphologies were minutely investigated by field emission scanning electron microscopy (FE-SEM) (JEM-2100, JEOL, Japan) and transmission electron microscopy (TEM) (JEM 2100, Hitachi, Japan). Specific surface area measurements were performed and recorded on the fully automated micropore analyzer (Autosorb-IQ-MP, Quantachrome, USA).1.2 Fabriction of titanium nitride nanotubes (TiN-NTs)
Typically, 0.75 g TiO2 micropowder was added to 85 ml concentrated NaOH solution (10 mol l−1), followed by ultrasonic dispersion for 40 min to get a milky suspension, which was transferred into a 100 ml teflon-lined autoclave. After closely sealed, the autoclave was placed in a furnace and heated to 140 °C to hydrothermally react for 24 hours. Upon finishing the reaction, it was naturally cooled to room temperature. After decanting the supernatant from the autoclave, the remaining precipitate was transferred into 0.1 mol l−1 HNO3 solution. Via stirring and pickling for 2 hours, the precipitate was repeatedly washed with deionized water until neutral, prior to vacuum drying at 40 °C for 6 hours. Next, the precipitate was thermally treated in a program control furnace at 400 °C for 2 h, so as to be transformed to the anatase phase TiO2-NTs. Placing the TiO2-NTs in a tube furnace, followed by inletting nitrogen gas to the tube for 20 min to remove the air, the tube furnace was heated to 500 °C at a heating rate of about 5 °C min−1, staying at this temperature for 10 min. Afterwards, the inlet gas was switched to high purity ammonia with flow rate of 120 ml min−1, and the tube furnace was heated from 500 °C to 850 °C at the same heating rate. At the temperature (850 °C) the reaction in the furnace was maintained for 3 h, followed by the natural cooling to room temperature, and the resulting product, or titanium nitride nanotube particles (TiN-NTs), could be harvested.1.3 Preparation of nanosized Ni particles and in situ loading on TiN-NTs
According to the similar preparation procedure and conditions, by separately adjusting the dosage of Ni salt and reducing agent N2H4·H2O, the serial supported catalysts with Ni load of 16%, 12% and 8%, could be fabricated, which were accordingly labeled as Ni(16)@TiN-NTs, Ni(12)@TiN-NTs and Ni(8)@TiN-NTs, respectively.
1.4 Catalytic activity evaluation method
Under a certain temperature and pressure condition, hydrogen (H2) amount generated by catalytic hydrolysis of ammonia borane (AB) in unit time can be accurately measured, which could be used to evaluate the catalytic activity of the relevant catalysts. The catalytic hydrolysis test was conducted in a homemade pressure-resistant thick-wall glass reactor, which was placed in a constant temperature water bath with a temperature control accuracy of ±0.5 K. The upper outlet of the reactor is connected to a short-neck drying tube filled with soft, loose, breathable glass wool. The other end of the drying tube is linked to a vertical condenser, which is cooled by circulating ice water in order to capture volatile matters in real time. The cooled gas is fed into an absorption tube containing a certain amount of anhydrous calcium chloride to remove other gaseous impurities. The purified hydrogen is then introduced into the burette with fine scale to record the volume change of H2 gas in the tube per unit time.26 Once the hydrolysis reaction begins, the H2 volume generated at different time intervals needs to be accurately measured and recorded. In this work, the concentration of AB aqueous solution was set at 0.10 mol l−1, and the addition amount of catalyst (Ni-NPs, Ni(x)@TiN-NTs) powder was controlled at 5 mg per 10 ml AB solution.2 Results and discussion
2.1 Phase constitution analysis
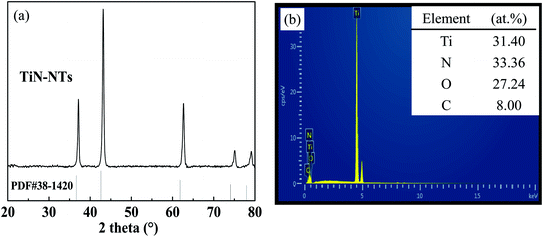
The phase constitution of as-prepared TiN-NTs, Ni particles and the supported catalyst Ni(x)@TiN-NTs sample were analyzed by means of X-ray powder diffraction (PXRD), and the results are shown in Fig. 1 and Fig. 2, respectively. As can be seen from Fig. 1(a), for the TiN-NTs sample five distinct and sharp diffraction peaks appeared at 2θ = 36.8°, 42.6°, 62.2°, 74.4° and 78.5°. The comparison with the JCPDS standard card (PDF) reveals that these peaks could be basically assigned to the face centered cubic TiN (PDF 38-1420), indexed to the (111), (200), (220), (311) and (222) crystal planes of TiN, respectively. However, further detailed analysis finds that compared with the normative diffraction peak of TiN (PDF 38-1420), the five diffraction peaks of the as-fabricated TiN-NTs sample all indicate minor positive offset to different degrees in the direction of the high angle, and the mean deviation of 2θ angle is 0.13. According to the Bragg diffraction principle, the positive shift of diffraction peak may originate from the diminution of lattice parameters, which means that the TiN-NTs sample could contain other atoms smaller than the nitrogen atom radius.27 As is shown in the SEM-EDS spectrum of the TiN-NTs sample in Fig. 1(b), besides Ti and N elements, the TiN-NTs sample also contains a certain amount of O element. Through the analysis we can realize that the precursor of nitriding reaction process is TiO2-NTs, involving O atom, with the smaller atom radius (0.066 nm) than that of N atom (0.075 nm). During the nitriding reaction, O atoms in TiO2-NTs may not be completely replaced by N atoms, so some O atoms remain. Moreover, the atomic ratio of Ti and N elements is close to 1![[thin space (1/6-em)]](https://www.rsc.org/images/entities/char_2009.gif) :
:![[thin space (1/6-em)]](https://www.rsc.org/images/entities/char_2009.gif) 1, which further proves that the TiN-NTs samples may be composed of abundant TiN, bits of amorphous titanium nitride oxide (TiNxOy) and low-value titanium oxide (TinO2n−1).28 There exist various bond forms such as Ti–N bond, Ti–O bond or O–Ti–N bond, which are conducive to increasing the catalytic performance of TiN-NTs.29
1, which further proves that the TiN-NTs samples may be composed of abundant TiN, bits of amorphous titanium nitride oxide (TiNxOy) and low-value titanium oxide (TinO2n−1).28 There exist various bond forms such as Ti–N bond, Ti–O bond or O–Ti–N bond, which are conducive to increasing the catalytic performance of TiN-NTs.29
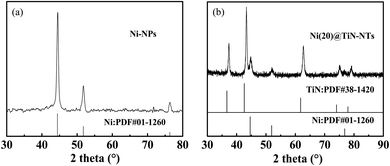
Fig. 2 represents the PXRD patterns of Ni(20)@TiN-NTs and the metal Ni micro–nano powder prepared in this work. As seen from Fig. 2(a), three peaks arise at 44.5°, 51.8° and 76.4°, which should be attributed to the three crystal planes (111), (200) and (220) of the face-centered cubic metal Ni (PDF 01-1260), respectively. No other unknown peaks are found, indicating that no oxides or hydroxides of nickel exist, and the purity of the as-prepared Ni powder is relatively high. From the PXRD pattern of Ni(20)@TiN-NTs (cf. Fig. 2(b)), it can be found that two sets of diffraction peaks can be discriminated, which could be attributed to those of TiN (PDF 38-1420) and metal Ni (PDF 01-1260), respectively. Based on the PXRD results it can be judged that the metal Ni nanoparticles have been supported on the surface of TiN-NTs.
2.2 Morphology analysis
The SEM and TEM images of the as-prepared TiO2 and TiN samples are displayed in Fig. 3. As clearly shown in Fig. 3(a), the intermediate product TiO2 presents microsized wire shape, with 120 nm mean diameter, more than 2 μm length and greater than 16 aspect ratio. The surface of the TiO2 micro-wires is relatively smooth, with visually compact texture, emerging as the mutually discrete state. However, after HNO3 pickling, the morphology of TiO2 significantly changed from micrometer line to nano-sized tube structure, just as shown in Fig. 3(a1). The diameter of TiO2 nanotubes after pickling is about 90 nm, which is slightly smaller than that before pickling. The thickness of the tube wall is about 25 nm, with a well-defined tube shape and obvious hollow structure. Via making a subtle observation, it can be seen that the surface of the nanotube has many finer micropores and tiny hairs (cf. Fig. 3(a2)). After nitriding treatment, TiO2 can be converted to TiN, and the corresponding shape also changes greatly (cf. Fig. 3(b)). The TiN product takes hollow short tubular shape with apparent mean diameter of 130 nm, and the length of the tube is obviously shorter than TiO2-NTs. The wall of the tube appears to be cross-linked by a large number of nano-particles and then curled into a tubular shape, with the tube surface full of pores. The unique structure of TiN-NTs facilitates the free conduction of internal electrons, while the larger specific surface area also provides more active sites and channels for the distribution and anchoring of active metal components.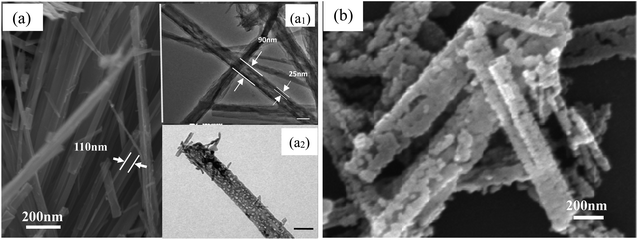 | ||
| Fig. 3 SEM image (a) and TEM image (a1 and a2) of the TiO2 samples; SEM image of the TiN-NTs samples (b). The scale bars in Fig.3 (a1 and a2) denote 100 nm. | ||
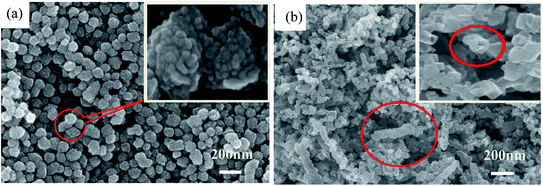
In contrast, the as-prepared metal Ni particles reveal relatively regular, disperse and uniform microsphere shape with mean size of 70 nm and less agglomeration, just as indicated in Fig. 4(a). But, it can be found from the inserted image that the surface of the Ni particles is quite rough, formed by aggregating of even smaller nanoparticles (10–20 nm). Fig. 4(b) demonstrates the surface profile of the as-fabricated Ni(20)@TiN-NTs. Via careful observation, it is easily identified that a bit of TiN nanotubes still exist, just become obviously shortened and irregular. The tiny Ni particles attached to the surface of TiN-NTs freely interlink with each other, resulting in the unordered, porous and diverse shape (see SEM-mapping Fig. S1 in ESI,† omitted here for saving space and simplicity). In consideration of the fabricating procedure, it could be speculated that ultrasonic and washing treatment should be responsible for the length shortening and channel collapse of the TiN-NTs microstructure.
2.3 Specific surface area measurement and analysis
2.4 Catalytic activity of Ni-NPs and Ni(x)@TiN-NTs
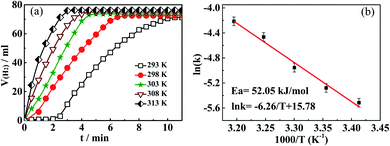 | ||
| Fig. 8 (a) Influence of temperature on catalytic performance of Ni(20)/TiN-NTs; (b) plotting of ln(k) against 1/T according to Arrhenius equation. | ||
In order to calculate the turnover frequency (TOF) for the catalyst Ni(20)@TiN-NTs, we here suggest a concise but reasonable equation:26 TOF = [P × VH2/RT]/nM × t, where P denotes the local atmospheric pressure; VH2 is the H2 volume generated in given reaction time; R and T stand for the universal gas constant and reaction temperature, respectively; nM and t separately represent the mole number of the metal in the catalyst and the given reaction time. According to the above temperature-dependent experimental results, the turnover frequency (TOF) at the room temperature (298 K) in the initial 3 min reaction time can be determined to be 11.73 mol(H2) (mol Ni)−1 min−1, or 294268 mol(H2) (mol Ni)−1 min−1.
Allowing for the far outweighing amount of H2O than that of AB, the concentration of H2O can be regarded to be unchanged during hydrolysis, and the hydrolysis reaction of AB could thus be viewed as a one-reactant type. On base of the principle of chemical kinetics, we plot a graph of ln(VH2) against the initial reaction time t, and get a good linear relationship. This result surely reveals that the AB hydrolysis reaction accords with the first order dynamic characteristics, which is consistent with our previous studies.31 From the straight slopes, we can get a series of reaction rate constants (k) that corresponds to the different temperatures. In accordance to Arrhenius equation, plotting natural logarithm ln(k) to the reciprocal (1/T) of temperature T provides an approximate line with a slope of −6.26 (cf. Fig. 8(b)), by means of which the apparent activation energy Ea can be determined to be 52.05 kJ mol−1. In line with the comparison of the activation energy, the key indicator for catalytic kinetics, it is definitely judged that the catalytic ability of Ni(20)@TiN-NTs surpasses some transition metals or their alloys (e.g., NiCu@C,32 Cu0.1@Co0.45Ni0.45/graphene33), even some noble metal-based catalyst (e.g., Pt/C (2wt%),34 PtNi@SiO2,35 PtPd NPs,36 PtNiO/NGO,37 Pt@SiO2 (ref. 38)).
At last, it is very essential for us to point out that no any NH3 or similar species were detected during all the above hydrolytic process, reflecting the satisfactory catalytic selectivity for the Ni(20)@TiN-NTs catalysts from one aspect.
3 Conclusion
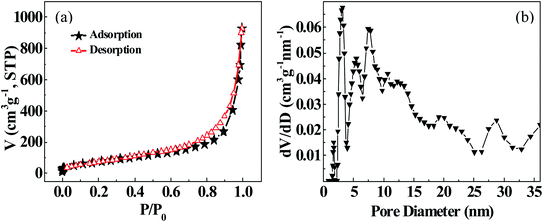
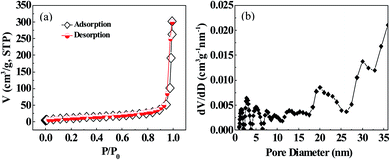
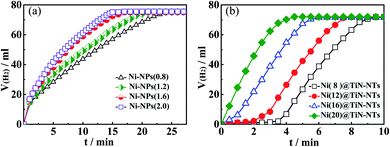
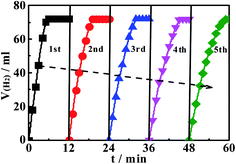
We here put forward a flexible and efficient hydrothermal-nitriding tactics for fabricating titanium nitride nanotubes (TiN-NTs), and deposit nanosized Ni particles on surface of the TiN-NTs via PVP-mediated non-aqueous phase reduction–deposition route, to obtain the supported catalyst Ni@TiN-NTs. The comprehensive characterization results manifest that the as-fabricated TiN-NTs takes hollow short tubular shape with apparent mean diameter of 130 nm, and the length of the tube is obviously shorter than the precursor TiO2-NTs, with the tube surface full of pores. The tiny Ni particles attached to the surface of TiN-NTs freely link with each other, resulting in the unordered, porous and diverse morphology. The specific surface area and average pore diameter of TiN-NTs are, respectively, 40.9 m2 g−1 and 39.5 nm, and especially the later presents an increase by 1.5 times compared with the precursor TiO2-NTs. It is the unique microstructure of Ni(x)@TiN-NTs that can provide larger specific surface area, more active sites and channels, availing the enhancement of catalytic activity. The supported Ni catalysts Ni(x)@TiN-NTs hold better catalytic activity than the metal Ni nanoparticles (NPs(2.0)), which should be largely ascribed to the larger specific surface area, high dispersion and excellent electron conductivity of the carrier TiN-NTs. With the rise of hydrolysis reaction temperature, the catalytic activity of Ni(x)@TiN-NTs gradually improves, and the H2 release rate markedly increases, signifying the positive correlation effect of temperature with the hydrogen evolution reaction. The existence of induction period at the lower temperature (293 K) and low Ni loading amount (Ni(8)@TiN-NTs, Ni(12)@TiN-NTs) could be expected to be used for purposively regulating the hydrogen release rate. The Ni supported catalyst Ni(20)@TiN-NTs has the highest catalytic activity among the involved catalysts, with the total turnover frequency of 11.73 mol(H2) (mol Ni)−1 min−1, and apparent activation energy of 52.05 kJ mol−1 at 303 K. After 5 using cycles, the Ni(20)@TiN-NTs catalyst still maintained 87% of the initial catalytic activity. Theoretically, the preparing strategy for TiN-NTs and Ni(x)@TiN-NTs can also be extended to the fabrication of other metal or alloy supported catalysts, with great potential development prospects.Data availability
The specific experimental data used for depicting the figures of this study are available from the corresponding author upon request.Conflicts of interest
The authors declare no competing financial interest.Acknowledgements
The authors gratefully appreciate the financial supports of National Natural Science Foundation of China (grant no. 21576073, 21076063).References
- S. Veras, S. Mozer and S. Danielle, Hydrogen: trends, production and characterization of the main process worldwide, Int. J. Hydrogen Energy, 2016, 42(4), 2018–2033 CrossRef.
- J. Andrews and B. Shabani, The role of hydrogen in a global sustainable energy strategy, Wiley Interdiscip. Rev.: Energy Environ., 2014, 3(5), 474–489 Search PubMed.
- N. Mudita and K. Rita, An evolving energy solution: intermediate hydrogen storage, Int. J. Hydrogen Energy, 2018, 43(27), 12168–12188 CrossRef.
- J. Zhang, Y. Duan, Y. Zhu, Y. Wang, H. Yao and G. Mi, Evenly dispersed microspherical amorphous alloy CoxB1−x: robust and magnetically recyclable catalyst for alcoholyzing ammonia borane to release H2, Mater. Chem. Phys., 2017, 201, 297–301 CrossRef CAS.
- K. S. Yao, C. C. Zhao, N. Wang, T. J. Li, W. W. Lu and J. J. Wang, An aqueous synthesis of porous PtPd nanoparticles with reversed bimetallic structures for highly efficient hydrogen generation from ammonia borane hydrolysis, Nanoscale, 2020, 12, 638–647 RSC.
- F. Fu, C. Wang, Qi Wang and A. M. Martinez-Villacorta, Highly selective and sharp volcano-type synergistic Ni2Pt@ZIF-8-Catalyzed hydrogen evolution from ammonia borane hydrolysis, J. Am. Chem. Soc., 2018, 140, 10034–10042 CrossRef CAS.
- H. Z. Li, P. Y. Wang and X. N. Chen, Ammonia borane: a high capacity chemical hydrogen storage material, Chin. Sci. Bull., 2014, 59(19), 1823–1837 CrossRef.
- J. Zhang, H. Li, H. Zhang, Y. Zhu and G. Mi, Porously hierarchical Cu@Ni cubic-cage microstructure: very active and durable catalyst for hydrolytically liberating H2 gas from ammonia borane, Renewable Energy, 2016, 99, 1038–1045 CrossRef CAS.
- J. Zhang, Y. Dong, Y. Wang, Y. Zhu and Y. Duan, A novel route to synthesize hydrogen storage material ammonia borane via copper(II)–ammonia complex liquid phase oxidization, Int. J. Energy Res., 2018, 42(14), 4395–4401 CrossRef CAS.
- B. Sen, K. Esra, D. Buse and O. O. Tugba, Highly efficient polymer supported monodisperse ruthenium–nickel nanocomposites for dehydrocoupling of dimethylamine borane, J. Colloid Interface Sci., 2018, 526, 480–486 CrossRef CAS.
- M. Matteo, M. Tiziano, F. Emiliano and C. Matteo, Nanostructured Pd/Pt nanoparticles: evidences of structure/performance relations in catalytic H2 production reactions, Appl. Catal., B, 2018, 236, 88–98 CrossRef.
- S. Peng, J. Liu, J. Zhang and F. Wang, An improved preparation of graphene supported ultrafine ruthenium(0) NPs: very active and durable catalysts for H2 generation from methanolysis of ammonia borane, Int. J. Energy Res., 2015, 4, 10856–10866 Search PubMed.
- P. Xu, W. W. Lu, J. Zhang and L. Zhang, Efficient Hydrolysis of Ammonia Borane for Hydrogen Evolution Catalyzed by Plasmonic Ag@Pd Core–Shell Nanocubes, ACS Sustainable Chem. Eng., 2020 DOI:10.1021/acssuschemeng.0c02276.
- M. S. Park, K. Jin Kyu and T.-S. Han, Impregnation approach for poly(vinylidene fluoride)/TiN oxide nanotube composites with high tribological performance, J. Mater. Sci. Technol., 2020, 37, 19–25 CrossRef.
- D. Brock, Li Yi and M. Andrei, Plasmon-Enhanced Electron Harvesting in Robust Titanium Nitride Nanostructures, J. Phys. Chem. C, 2019, 123(30), 18521–18527 CrossRef.
- X. Peng, K. F. Huo and J. J. Fu, Coaxial PANI/TiN/PANI nanotube arrays for high-performance supercapacitor electrodes, Chem. Commun., 2013, 49(86), 10172–10174 RSC.
- M. Negar, C. Venkateswara Rao and S. O. Salley, Nanostructured titanium nitride as a novel cathode for high performance lithium/dissolved polysulfide batteries, J. Power Sources, 2016, 321, 87–93 CrossRef.
- Y. Xiao, G. Zhan and Z. Fu, Robust non-carbon titanium nitride nanotubes supported Pt catalyst with enhanced catalytic activity and durability for methanol oxidation reaction, Electrochim. Acta, 2014, 141, 279–285 CrossRef CAS.
- W. Lu, Y. Zhang, J. Zhang and P. Xu, Reduction of Gas CO2 to CO with High Selectivity by Ag Nanocube-Based Membrane Cathodes in a Photoelectrochemical System, Ind. Eng. Chem. Res., 2020, 59, 5536–5545 CrossRef CAS.
- N. Mosavati, V. R. Chitturi and S. O. Salley, Nanostructured titanium nitride as a novel cathode for high performance lithium/dissolved polysulfide batteries, J. Power Sources, 2016, 321, 87–93 CrossRef CAS.
- K. Yao, C. Zhao, N. Sun, W. Lu, Y. Zhang, H. Wang and J. Wang, Freestanding CuS nanowalls: ionic liquid-assisted synthesis and prominent catalytic performance for the decomposition of ammonium perchlorate, CrystEngComm, 2017, 19, 5048–5057 RSC.
- Z. Wen, S. Cui and H. Pu, Metal nitride graphene nanohybrids general synthesis and multifunctional titanium nitride grapheme electrocatalyst, Adv. Mater., 2011, 23(45), 5445–5450 CrossRef CAS.
- F. Grote, H. Zhao and Y. Lei, Self-supported carbon coated TiN nanotube arrays innovative carbon coating leads to an improved cycling ability for supercapacitor applications, J. Mater. Chem. A, 2015, 3, 3465–3470 RSC.
- Z. Pan, Y. Xiao, Z. Fu, G. Zhan and S. Wu, Hollow and porous titanium nitride nanotubes as high-performance catalyst supports for oxygen reduction reaction, J. Mater. Chem. A, 2014, 2(34), 13966–13975 RSC.
- P. V. Ramachandran and P. D. Gagare, Preparation of ammonia borane in high yield and purity, methanolysis, and regeneration, Inorg. Chem., 2007, 46(19), 7810–7817 CrossRef CAS.
- J. Zhang, Y. Dong, Q. Liu, M. Zhou, G. Mi and X. Du, Hierarchically alloyed Pd-Cu microarchitecture with tunable shapes: morphological engineering, and catalysis for hydrogen evolution reaction of ammonia borane, Int. J. Hydrogen Energy, 2019, 44, 30226–30236 CrossRef CAS.
- C. Yang, H. Wang, S. Lu and C. Wu, Titanium nitride as an electrocatalyst for V(II)/V(III) redox couples in all-vanadium redox flow, Electrochim. Acta, 2015, 182, 834–840 CrossRef CAS.
- M. Thotiyl, M. Ottakam, T. R. Kumar and S. Sampath, Pd Supported on Titanium Nitride for Efficient Ethanol Oxidation, J. Phys. Chem. C, 2010, 114(41), 17934–17941 CrossRef CAS.
- O. T. Musthafa Muhammed and S. Srinivasan, High performance platinized titanium nitride catalyst for methanol oxidation, Chem. Commun., 2008, 1, 67–69 RSC.
- J. Byun, S. H. Ahn and J. J. Kim, Self-terminated electrodeposition of platinum on titanium nitride for methanol oxidation reaction in acidic electrolyte, Int. J. Hydrogen Energy, 2020, 45(16), 9603–9611 CrossRef CAS.
- J. Zhang, Y. Wang, Y. Zhu, G. Mi, X. G. Du and Y. N. Dong, Shape-selective fabrication of Cu nanostructures: contrastive study of catalytic ability for hydrolytically releasing H2 from ammonia borane, Renewable Energy, 2018, 118, 146–151 CrossRef CAS.
- A. Yousef, N. A. M. Barakat, M. El-Newehy and H. Y. Kim, Stable electrospun NiCu nanorods@carbon nanofibers for highly efficient dehydrogenation of ammonia borane, Int. J. Hydrogen Energy, 2012, 37, 17715–17723 CrossRef CAS.
- X. Meng, L. Yang, N. Cao, C. Du, K. Hu, J. Su, W. Luo and G. Cheng, Graphene-supported trimetallic core–shell Cu@CoNi nanoparticles for catalytic hydrolysis of amine borane, ChemPlusChem, 2014, 79, 325–332 CrossRef CAS.
- Q. Xu and M. Chandra, A portable hydrogen generation system: catalytic hydrolysis of ammonia-borane, J. Alloys Compd., 2007, 446, 729–732 CrossRef.
- X. Qi, X. Li, Bo Chen, H. Lu and Le Wang, Highly Active Nanoreactors: Patchlike or Thick Ni Coating on Pt Nanoparticles Based on Confined Catalysis, ACS Appl. Mater. Interfaces, 2016, 8(3), 1922–1928 CrossRef CAS.
- A. J. Amali, K. Aranishi, T. Uchida and Q. Xu, PdPt Nanocubes: A High-Performance Catalyst for Hydrolytic Dehydrogenation of Ammonia Borane, Part. Part. Syst. Charact., 2013, 30, 888–892 CrossRef CAS.
- B. Zhao, F. Kun, Y. Wang, X. Lv and H. Zheng, PtxNi10−xO nanoparticles supported on N-doped graphene oxide with a synergetic effect for highly efficient hydrolysis of ammonia borane, Catal. Sci. Technol., 2017, 7, 5128–5135 RSC.
- Y. Hu, Y. Wang, Z.-H. Lu, X. Chen and L. Xiong, Core–shell nanospheres Pt@SiO2 for catalytic hydrogen production, Appl. Surf. Sci., 2015, 341, 185–189 CrossRef CAS.
Footnote |
| † Electronic supplementary information (ESI) available. See DOI: 10.1039/d0ra06920e |
| This journal is © The Royal Society of Chemistry 2020 |

