 Open Access Article
Assessment of the vigor of rice seeds by near-infrared hyperspectral imaging combined with transfer learning
Yong Yanga,
Jianping Chenab,
Yong He ce,
Feng Liud,
Xuping Fengce and
Jinnuo Zhang
 *ce
*ce
aState Key Laboratory for Managing Biotic and Chemical Treats to the Quality and Safety of Agro-products, Key Laboratory of Biotechnology for Plant Protection, Ministry of Agriculture, and Rural Affairs, Zhejiang Provincial Key Laboratory of Biotechnology for Plant Protection, Institute of Virology and Biotechnology, Zhejiang Academy of Agricultural Science, Hangzhou, China
bState Key Laboratory for Managing Biotic and Chemical Treats to the Quality and Safety of Agro-products, Key Laboratory of Biotechnology for Plant Protection, Ministry of Agriculture, and Rural Affairs, Zhejiang Provincial Key Laboratory of Biotechnology for Plant Protection, Institute of Plant Virology, Ningbo University, Ningbo, China
cCollege of Biosystems Engineering and Food Science, Key Laboratory of Spectroscopy, Ministry of Agriculture and Rural Affairs, Zhejiang University, Hangzhou, China. E-mail: jnzhang@zju.edu.cn; Tel: +86-137-773-88835
dCollege of Life Sciences, Nanjing Agricultural University, Nanjing, China
eHuanan Industrial Technology Research Institute of Zhejiang University, Guangzhou, China
First published on 15th December 2020
Abstract
Rice seed vigor plays a significant role in determining the quality and quantity of rice production. Thus, the quick and non-destructive identification of seed vigor is not only beneficial to fully obtain the state of rice seeds but also the intelligent development of agriculture by instant monitoring. Thus, herein, near-infrared hyperspectral imaging technology, as an information acquisition tool, was introduced combined with a deep learning algorithm to identify the rice seed vigor. Both the spectral images and average spectra of the rice seeds were sent to discriminant models including deep learning models and traditional machine learning models, and the highest accuracy of vigor identification reached 99.5018% using the self-built model. The parameters of the established deep learning models were frozen to be feature extractor for transfer learning. The identification results whose highest number also reached almost 98% indicated the possibility of applying transfer learning to improve the universality of the models. Moreover, by visualizing the output of convolutional layers, the progress and mechanism of spectral image feature extraction in the established deep learning model was explored. Overall, the self-built deep learning models combined with near-infrared hyperspectral images in the determination of rice seed vigor have potential to efficiently perform this task.
1. Introduction
Rice (Oryza sativa L.) is considered to be one of the most vital cultivated cereal crops for human consumption since more than half the global population is fed by it.1,2 Although the stable annual rice production meets the current requirement to sustain life, the expanding population means that the improvement of rice production is an urgent need. Among the most important factors, the vigor of rice seeds plays an essential role in achieving high and stable yields. It is widely acknowledged that the quality of rice seeds can be represented by their germination percentage, but some unscrupulous merchants deliberately mix rice seeds that have been harvested in different years with similar physical shapes to reduce their costs, leading to a low percentage of germination. The prolonged storage of seeds also inevitably gives rise to their deterioration.3 Thus, to better monitor rice seed quality, it is imperative that measures are put in place to identify the activity of rice seeds that may have been collected from different years. However, the traditional artificial germination test to determine the vigor of seeds4 is laborious, time consuming and inefficient. Other methods available include staining and conductivity tests to indirectly estimate seed vigor by establishing relationships between the measured physical and chemical features and germination rates.3,5,6 However, these methods require complex chemical processing and relative professional techniques, which hinder highly efficient seed vigor testing, and their large-scale use is generally deemed to be time-consuming and unrealistic.Near-infrared hyperspectral imaging (NIR-HSI) technology is an information acquisition method that has been fully developed to rapidly and non-destructively accomplish various tasks such as object classification and detection of bioactive molecules in many application areas.7–9 What makes hyperspectral imaging particularly beneficial is that it integrates both spectral and spatial information in the spectral images and presents the data in the form of a 3D data cube. The near-infrared spectrum obtained contains abundant features related to the composition and structure of the sample tested and is produced by the energy level transition that comes from molecule vibration driving the ground state to a higher energy state. Especially when parts of the sample are composed of hydrogen-containing groups, distinct absorbance or reflectance at different wavelengths can be exploited and analysed.10,11 Femenias et al. (2020) applied the average spectra from NIR-HSI to build classification and quantification models of deoxynivalenol (DON)-contaminated wheat kernels and found its potential in DON management.12 Furthermore, chilling injury in mature fruit was detected using NIR-HSI by Babellahi et al. and a discriminant model selected wavelengths that were related to the degradation of phenolic content, achieving a satisfactory classification rate of 87%.13
Besides internal information, NIR-HSI gives more informative and adaptive external features such as the morphological characteristics that lie in the spatial domain at the object level.14 Cao et al. (2020) proposed a new method based on the cascaded support vector machine (SVM) using spectral-spatial information to classify ground cover, and the results showed that the performance of the model was satisfactory with much less computation complexity.15 After collecting numerous papers using fusion of spectral and spatial information, Imani et al. were able to characterize three main method groups, namely segmentation methods, feature fusion methods and multi-classifier voting methods to better comprehend the superior performance of combined spectral-spatial information.16 However, for samples of small sizes such as rice seeds, most studies used the average spectra instead of spectral-spatial fusion data in the near infrared range as their information resource.10,17 Therefore, it is necessary to devise other innovative measures to utilize both the spatial and spectral information of the comparatively small rice seeds in images to acquire much more robust and accurate results.
For analysing big data, deep learning is the best algorithm because of its powerful ability to extract and represent features. With the rapid development of computer science and calculation capacity, deep learning algorithms have been widely applied in various fields including image processing, speech recognition, and object detection.18 Compared to the traditional machine learning methods, the intricate structure of the deep learning model is more capable of automatically extracting the hidden characteristics, providing a huge improvement in data processing and reducing the complexity of manual calculations, resulting in the model exhibiting a highly improved performance.19 The convolutional neural network (CNN), which is composed of several convolutional layers, pooling layers and fully connected layers has been proved to be an excellent algorithm to process images. In the field of agriculture, Velumani et al. (2020) built and trained a CNN model to identify the presence and state of wheat spikes using RBG images to predict the wheat heading date.20 An error of only two days occurred compared with visual scoring by experts. Average spectra of okra seeds and loofah seeds were fed into the CNN by Nie et al. (2019) and a classification rate of greater than 95% was achieved.21 However, the researchers in these studies did not make full use of the spectral-spatial information and did they not consider the generalization ability of the model. Separate models had to be validated for each seed variety in the same task, requiring a large amount of data. In these cases, transfer learning including fine-tuning employs the similarity of tasks to apply an established model created using one type of seed spectrum to the learning process of another new type of seed spectrum, perfectly resolving the problem of data shortage and improving the generalized ability. Chen et al. (2020) achieved image-based plant identification using pre-trained VGGNet with a validation accuracy of 91.83%,22 proving that transfer learning can be used successfully with image-sized data.
In this study, near-infrared hyperspectral images were obtained from rice seeds of two different varieties that had been collected in different years to investigate the possibility of the rapid and non-destructive determination of their vigor. The spectral-spatial information of NIR-HSIs whose size was limited was adequately exploited using deep learning algorithms. The specific objectives herein were as follows: (1) exploring the possibility of establishing a high performance vigor identification model based on hyperspectral images combined with deep learning; (2) examining the influence of the training epoch number on the results and determining the most suitable combination for vigor discrimination; (3) investigating the application of transfer learning within the vigor identification of these two different rice varieties; (4) exploring the essence of deep learning through structural visualization when it is used to study rice seed vigor.
2. Materials and methods
2.1. Sample preparation
The seeds of two different rice cultivars, RBQ and KN4, were provided by Nanjing Agricultural University. A total of 3960 RBQ seeds were collected in 2011, 2012, 2017 and 2018, while the 2671 KN4 seeds were harvested in 2015, 2017 and 2018. The seeds were indistinguishable in appearance and shape and were carefully collected from the same area every year. After harvesting, all the seeds were sun-dried for 5 sunny days, and then sealed in plastic bags and stored at 5 °C without further processing.2.2. Germination rate measurement
The viability of seeds is closely related to their harvest time and the duration and conditions of their storage. The germination rate is commonly used as the indicator of seed viability.23 The germination of the stored rice seeds was tested in 2020 using seedling trays covered with moist sackcloth to maintain moisture and incubated at 25 °C. The germination of 100 randomly-selected seeds per sample was assessed after 10 days based on radicle protrusion of at least the seed length and a shoot of at least half the seed length.4,242.3. Hyperspectral imaging system architecture
A laboratory-built near infrared hyperspectral imaging system was used in this study. The images were obtained from a high-performance spectrograph (ImSpector N17E; Spectral Imaging Ltd., Oulu, Finland) and captured by a CCD camera (C8484-05; Hamamatsu, Hamamatsu City, Japan). The samples were transported for imaging on a conveyer belt controlled by a stepper electromotor (Isuzu Optics Corp., Taiwan, China). A detailed description of the entire system and parameters was provided by Zhang et al.25 A preliminary experiment was used to determine the optimal settings for obtaining clear and non-distorted images, the result of which the motor speed was set to 13 mm s−1, exposure time of 3 ms and the lens height at 16 cm. Hyperspectral data was collected in the range 873–1734 nm with a spectral resolution of 5 nm and the size of the hyperspectral image determined by the camera was 320 × 320 with 256 channels. The rice seeds were first placed systematically and separately on a black plate before placing them on the conveyer belt. To correct the raw near-infrared hyperspectral images, dark reference calibration was done by completely covering the lens with its opaque cap and white reference calibration using a white Teflon tile with nearly 100% reflectance.2.4. Spectral data pre-processing
Although the images collected had 256 channels in the range of 873–1734 nm, the large amounts of noise in the extreme channels could affect the performance of the model developed, and therefore the data chosen for analysis consisted of 200 channels in the range of 924–1595 nm. Threshold segmentation and the mask algorithm were then used to distinguish the individual rice seeds from the background noise, and thus the hyperspectral image of each rice seed was extracted with a resolution of 32 pixels × 32 pixels. The average spectrum from all the rice seeds in each image was also extracted and calculated. Although pre-processing resulted in the loss of some spatial information, it maximized the crucial spectral information for the purpose of the model. Both hyperspectral images and average spectra were normalized to a similar distribution before sending to the identification models used. The ratio of training set to testing set was set to 7![[thin space (1/6-em)]](https://www.rsc.org/images/entities/char_2009.gif) :
:![[thin space (1/6-em)]](https://www.rsc.org/images/entities/char_2009.gif) 3 in order to build a robust model with the capacity for excellent generalization.
3 in order to build a robust model with the capacity for excellent generalization.
2.5. Data analysis methods
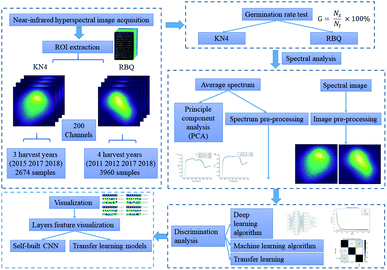
Several machine learning algorithms, including deep learning, were used to explore the connection between the spectral information and seed vigor. A flowchart of the data analysis process is shown in Fig. 1.Principal Component Analysis (PCA) was used to compress features and determine the contribution of each band among the whole spectral data. Through variable transformation of PCA, the original spectra were sequentially projected onto the loading vectors, which are the direction of maximum variance. Because there is a certain linear correlation within the NIR spectrum, the information in the original spectrum is mainly concentrated in the direction of the first few loading vectors. This study focused on analyzing the first loading vectors whose number corresponded with the number of spectral channels to explore the inner reasons for the vigor classification by utilizing chemometrics.
3. Results and discussion
3.1. Germination rate analysis
The germination rates of the rice seeds are shown in Fig. 4. For RBQ, the germination rates of the seeds harvested in 2011 and 2012 were clearly less than 10%, while that of the seeds harvested in 2017 and 2018 were higher than 50%, and the highest was as high as around 90%. For KN4, similarly, the germination rate of the seeds harvested in 2015 was around 5%, and that of the seeds harvested in 2017 and 2018 increased gradually. Obviously, the storage time had a huge influence on the germination rates. There was some difference between the rice cultivars, but overall, the older the seeds, the lower their germination ability. It was inevitable that the inner biomass of the rice seeds changed during the storage process, which was characterized by the germination rate. These big differences provided a suitable data set to establish a discriminant analysis model.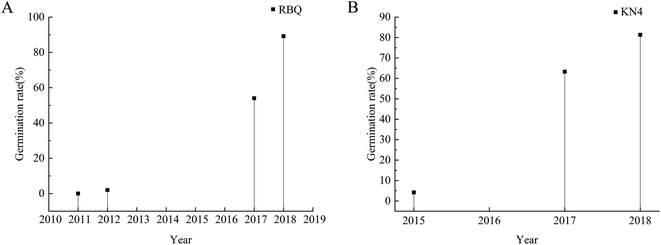 | ||
| Fig. 4 Germination rate drop-line charts of RBQ and KN4 rice seeds collected from different years (A: RBQ rice seeds from four different years and B: KN4 rice seeds from three different years). | ||
3.2. Spectroscopy analysis
The average spectra of all the samples were sent to the PCA algorithm for projection processing to obtain the first loading vectors, which represent the significance of the channels. Badaró et al. (2020) used the PCA loading plots to successfully identify the wavelength with the most significant contribution in building their determination model of pectin content.31 As shown in Fig. 5, the first PCA loading vectors, which corresponded to the first components, contained almost 96% of the original information. The shapes of the curves were nearly identical for the same rice variety, but there were differences between two varieties, showing the power of the near-infrared spectrum to identify differences. The curves showed the weight of each band in the information, which were related to the vibration of the hydrogen-containing groups. Thus, the pattern of peaks or valleys played an important role in identifying rice seed vigor. The curves of Fig. 5A peak at around 970 nm and exhibit a valley at around 1450 nm, corresponding to the stretching vibrations of the free O–H in the first and second overtone.32 The second overtone of combined O–H stretching vibration could be observed with a peak at around 1120 nm, followed by the stretching vibration of C–H at the valley at around 1200 nm. Moreover, the first overtone of the free N–H stretching vibration was also present in the slight peak at around 1540 nm. Although the peaks and valleys in Fig. 5B were not as evident as that in Fig. 5A, from the point view of weight values, the values of the corresponding bands of the related hydrogen-containing groups were large enough to address the significance. Thus, the spectra of the rice seeds collected from different years in Fig. 5 had a strong association with their constituents, perhaps especially the substances containing hydrogen groups such as starch, proteins and lipids. Zhang et al. (2019) established predictive models of the starch content in rice using NIR-HSI, and the correlation coefficient reached 0.8029.33 Sun et al. (2020) used HSI combined with chemometrics to successfully detect the fat content in peanut kernels, achieving a large correlation coefficient.34 During storage, there was an inevitable decline in seed vigor, which was mainly manifested by the changes in the related substances, resulting in a variation in the seed spectra. Therefore, it was possible to extract spectral features that were related to the constituents of rice seeds from different years to build discriminant models, which were able to identify seed vigor.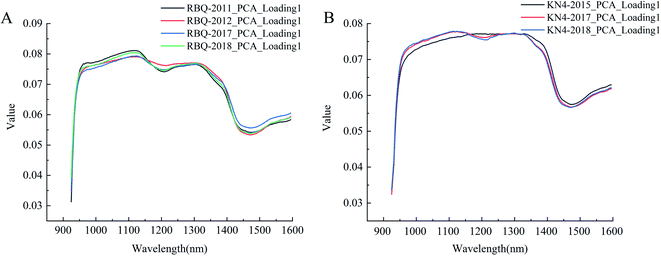 | ||
| Fig. 5 First PCA loading vector curves of different rice seeds (A: RBQ rice seed collected from four different years and B: KN4 rice seed collected from three different years). | ||
3.3. Seed vigor identification
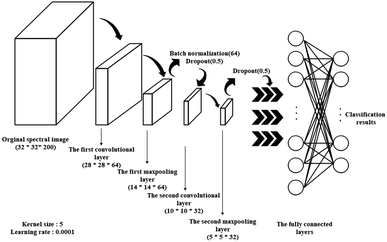
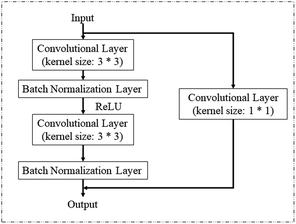
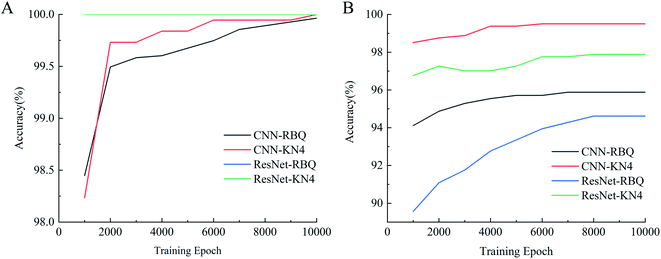
Spectral images, which combine both spatial and spectral information, were used as input to be sent into different deep learning models for vigor identification. Importantly, the impact of different numbers of training epochs, that is the training time, on modeling performance was studied. As shown in Fig. 6, both the training accuracies and testing accuracies increased with an increase in the number of training epochs, and when the training epoch reached around 8000, the testing accuracy stopped increasing and became relatively stable. Moreover, the testing accuracies of the self-built CNN models were higher than that of the ResNet18 models, which had a more complex structure with more trainable parameters. Also, the ResNet18 models with 100% training accuracies seemed to be trapped into an overfitting problem from the start of training. It appeared that increasing the training epochs and applying a self-built model were beneficial for identifying vigor. A similar conclusion was reached by Geetharamani et al. (2019) in their study to identify plant leaf diseases.35As shown in Table 1, over 94% accuracy in identifying vigor was achieved using the spectral images combined with deep learning algorithms. With both RBQ and KN4, the use of self-built CNN resulted in accuracies (95.87% for RBQ and 99.50% for KN4) superior to that using ResNet18, perhaps implying that a simple model structure can deal with information-rich data such as spectral images. Wu et al. (2018) used several 1-dimensional convolutional layers to classify Chrysanthemum varieties using NIR-HSI and also obtained their best accuracy of close to 100%.36 Zhang et al. (2020) also found that a simple deep learning structure combined only with spectra had great potential for determining chemical composition.8 However, the poor results from a traditional discriminant model based on PLS-DA demonstrated that a too simple a model structure, such as linear modelling, could not fulfill the task accurately. Non-linear discriminant models such as SVM, with their unique ability to process small datasets, can make full use of average spectra to nearly reach the accuracy of deep learning models, illustrating the significance of spectral information rather than spatial information in identifying vigor. However, deep learning models also possess the advantages of non-linear processing, image processing and large dataset processing, making them ideal for identifying seed vigor. In the study by Zhang et al. on seed identification,37 they reached the conclusion that the performance of models based on spectra was better than that based on spectral images for their particular objective and method of resizing images. Thus, it is always vital to choose the most suitable model algorithm based on the size of the dataset and the form of the data.
| Variety | Harvest year | Amount | Epoch | Self-built CNN | ResNet18 | ||||
|---|---|---|---|---|---|---|---|---|---|
| Training set (%) | Testing set (%) | F1-score | Training set (%) | Testing set (%) | F1-score | ||||
| RBQ | 2011 | 1213 | 10![[thin space (1/6-em)]](https://www.rsc.org/images/entities/char_2009.gif) 000 000 |
99.8556 | 95.8789 | 0.994 | 100 | 94.6173 | 0.989 |
| 2012 | 1033 | 0.930 | 0.933 | ||||||
| 2017 | 894 | 0.975 | 0.963 | ||||||
| 2018 | 820 | 0.934 | 0.928 | ||||||
| KN4 | 2015 | 1024 | 10![[thin space (1/6-em)]](https://www.rsc.org/images/entities/char_2009.gif) 000 000 |
99.9465 | 99.5018 | 1.000 | 100 | 97.8829 | 1.000 |
| 2017 | 689 | 0.994 | 0.964 | ||||||
| 2018 | 958 | 0.995 | 0.965 | ||||||
| Average spectrum | PLS-DA | SVM | |||||||
|---|---|---|---|---|---|---|---|---|---|
| Training set (%) | Testing set (%) | F1-score | Training set (%) | Testing set (%) | F1-score | ||||
| RBQ | 2011 | 1213 | 73.7373 | 72.3063 | 0.883 | 100 | 95.2020 | 0.994 | |
| 2012 | 1033 | 0.692 | 0.940 | ||||||
| 2017 | 894 | 0.590 | 0.929 | ||||||
| 2018 | 820 | 0.690 | 0.960 | ||||||
| KN4 | 2015 | 1024 | 87.2659 | 87.7805 | 0.933 | 100 | 99.2518 | 0.990 | |
| 2017 | 689 | 0.841 | 0.985 | ||||||
| 2018 | 958 | 0.891 | 0.990 | ||||||
Upon comparing the classification results of the different rice varieties, it was noticeable that the accuracies of both deep learning models decreased the more recent the harvest. This is mainly due to the restricted amount of training data, which could not provide better mapping relation, and the properties of the rice seeds harvested from different years. Although the F1-scores generally corresponded to the performance of the models, there were observable differences in the F1-scores between RBQ2011 and RBQ2012 and between RBQ2017 and RBQ2018. This can be explained by Fig. 4, which shows that the germination rates of these two combination were close. Thus, it also provides solid evidence that these classification results are strongly connected with the seed vigor from the relationship between seed germination rate and harvest year.
3.4. Transfer learning
To improve the universality of the deep learning models, the transfer learning method was performed using the established models as feature extractors, and the results acquired after 4000 training epochs are shown in Table 2. Although an obvious decline in the accuracy of both the training and testing sets can be noticed, considering the training time, some of the results are acceptable with an accuracy higher than 93%. It has been found that transfer learning for HSI classification can outperform the state-of-the-art methods.38 However, due to the limitation of training number and training image size, the superior characteristic of transfer learning was not fully revealed in this study. The performance of ResNet18 in transfer learning was much worse than that of the self-built CNN, which further proves that a complex structure with many trainable parameters will not be beneficial for the identification of seed vigor using NIR-HSI. It was also apparent that when the pre-trained model of RBQ became the feature extractor, the model performance of KN4 was relatively stable with the testing accuracy of 98.7547%, in contrast to the results of the KN4 extractor models. Through combined analysis with the results in Table 2, two reasons can explain this difference in the transfer learning process. On the one hand, the spectral features of KN4 itself made it easier to be applied to distinguish the harvest year. On the other hand, the trainable parameters of RBQ as a feature extractor were determined by more training samples, which made it more robust in extraction. Zhu et al. (2020) successfully identified over 9000 soybean seed hyperspectral images combined with transfer learning.39 Therefore, to increase the universality of the model for processing rice seed spectral images, it will be better to apply a suitable structure with large number of training samples as the feature extractor and consider the characteristics of the spectral images before using transfer learning.| Transfer learning path | Harvest year | Amount | Self-built CNN | ResNet18 | ||||
|---|---|---|---|---|---|---|---|---|
| Training set (%) | Testing set (%) | F1-score | Training set (%) | Testing set (%) | F1-score | |||
| KN4_EX-RBQ | 2011 | 1213 | 98.8452 | 89.2347 | 0.959 | 79.6824 | 65.8537 | 0.757 |
| 2012 | 1033 | 0.874 | 0.710 | |||||
| 2017 | 894 | 0.870 | 0.542 | |||||
| 2018 | 820 | 0.858 | 0.564 | |||||
| RBQ_EX-KN4 | 2015 | 1024 | 99.5182 | 98.7547 | 1.000 | 93.9507 | 93.2752 | 0.948 |
| 2017 | 689 | 0.985 | 0.912 | |||||
| 2018 | 958 | 0.985 | 0.940 | |||||
3.5. Visualization of convolutional layers features
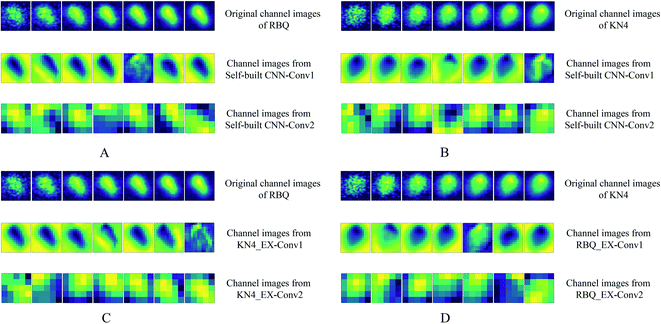
Fig. 7 shows the first 7 channels of each convolutional layer extracted and visualized in the form of a pseudo-color image. It is clear that distinct features from the same spectral image were addressed by different convolutional layers. Firstly, the variation within the original channel images of both RBQ and KN4 give solid proof that the different channels of the spectral image provide plenty of spectral information, which is different from the simple RGB images. It can also be seen that channel images from the first convolutional layer identified the physical shape of the original seed by emphasizing the background and edge of the rice seed. In the study by Pavlo et al. using feature visualization, they found that the CNN model, focusing on the main part of the character in the whole image, tended to identify hand written characters with high accuracy.40 With an increase in the learning depth, the feature images with low resolution of convolutional layer became more abstract. However, it was also observable that the spectral information of different parts of the rice seed in the form of a brighter pixel was concentrated in the abstract channel images. Finally, these local features, which contained both spectral and spatial information of different channels, were flattened and sent into the fully connected layers.Briefly, on the one hand, the physical shape of these rice seeds from different years was almost identical. Thus, the final results of vigor assessment could hardly benefit from appearance features. On the other hand, combining the results of spectral analysis and convolutional layers features visualization, it was predictable that the information related to the vibration of hydrogen-containing groups within the high-dimensional spectral images played an important role in the process. With an increase in the depths of the deep learning model, spectra from different parts of the whole seeds were locally focused and analyzed in a space form by different convolutional kernels.
Fig. 7C and D additionally present the feature extraction progress of transfer learning. It was predictable that the feature extraction path of the transfer learning model was identical with the corresponding self-built CNN model, which was applied as the feature extractor, because the learning pattern of the feature extractor was frozen. Interestingly, a comparison of Fig. 7B and C showed that similar channel images of each convolutional layer were displayed, which validates the transfer learning. A similar phenomenon can also be found in Fig. 7A and B. The similarity of the transfer learning feature extraction mode is to some extent expressed in the result of the transfer learning and visualization images. Thus, making good use of transfer learning is beneficial for reducing the computational pressure and improving the versatility of models that handle similar tasks.
4. Conclusions
In this study, near-infrared hyperspectral images combined with deep learning were used to identify the vigor of rice seeds harvested in different years. A total of 2671 KN4 rice seeds and 3960 RBQ rice seeds were acquired and analysed, and as expected, the rice seeds stored for the shortest time had the highest vigor. Then, PCA was applied to reduce the dimensions of the average spectra so that the first loading values, which addressed the significance of the spectral channels, could be presented. The differences in the PCA loading values were consistent with the changes in seed vigor, satisfying the theoretical basis of the discriminant models.Spectral images of both RBQ and KN4 were used to build the self-built CNN and ResNet18 models. After testing and comparing the performance of the deep learning model using different training epochs and different structures, it was concluded that increasing the number of training epochs and applying a self-built model helped in identifying the seed vigor. The identification accuracy of the self-built CNN for the KN4 cultivar reached 99.5018%. In addition, traditional machine learning algorithms such as SVM and PLS-DA were used to build discriminant models combined with average spectra. Non-linear algorithms such as SVM were also able to achieve nearly the best performance with the same amount and form of training data as that herein, but were not more robust than the self-built CNN. In addition, transfer learning in which the established deep learning structure was frozen as the feature extractor was also performed. The universality of the model for processing rice spectral images could be increased by introducing a suitable structure with a large amount of training samples as the feature extractor and a more classifiable spectral image dataset. Finally, the channel images that came from each convolutional layer of self-built CNN were shown to visually demonstrate the validity of the deep learning model and the feature extraction path of transfer learning. Therefore, this study provides a potential method of identifying rice seed vigor using near-infrared hyperspectral images combined with deep learning, and suggests the possibility of increasing the universality of vigor identification models by transfer learning. A more universal and powerful rice seed vigor identification model can be established by extending the spectral database and applying transfer learning in the future.
Conflicts of interest
There are no conflicts to declare.Acknowledgements
The authors thank Professor M. J. Adams for critically reading the manuscript. And this work was funded by Science and Technology Department of Guangdong Province (2019B020216001), National Key Research and Development Program of China (2016YFD0200804, 2016YFD0100601-15), National Natural Science Foundation of China (31801891), State Key Laboratory for Managing Biotic and Chemical Threats to Quality and Safety of Agro-products (2010DS700124-ZZ1907) and Zhejiang Provincial Key Research and Development Plan (2019C02006).Notes and references
- N. Jiang, J. Yan, Y. Liang, Y. L. Shi, Z. Z. He, Y. T. Wu, Q. Zeng, X. L. Liu and J. H. Peng, Rice, 2020, 13, 12 Search PubMed.
- N. Ghanghas, M. T. Mukilan, S. Sharma and P. K. Prabhakar, Food Rev. Int., 2020, 30, DOI:10.1080/87559129.2020.1733596.
- T. G. Min and W. S. Kang, Hortic., Environ. Biotechnol., 2011, 52, 240–245 Search PubMed.
- H. Liu, Y. F. Zhu, X. Liu, Y. Jiang, S. M. Deng, X. R. Ai and Z. J. Deng, J. For. Res., 2020, 31, 769–779 Search PubMed.
- K. Mavi, A. A. Powell and S. Matthews, Seed Sci. Technol., 2016, 44, 393–409 Search PubMed.
- I. Demir, B. B. Kenanoglu and E. Ozden, Not. Bot. Horti Agrobot. Cluj-Napoca, 2019, 47, 881–886 Search PubMed.
- M. M. Zhang, W. Li, Q. Du, L. R. Gao and B. Zhang, IEEE Trans. Cybern., 2020, 50, 100–111 Search PubMed.
- C. Zhang, W. Y. Wu, L. Zhou, H. Cheng, X. Q. Ye and Y. He, Food Chem., 2020, 319, 9 Search PubMed.
- B. Baca-Bocanegra, J. Nogales-Bueno, J. M. Hernandez-Hierro and F. J. Heredia, Food Chem., 2018, 244, 206–212 Search PubMed.
- N. Wu, H. B. Jiang, Y. D. Bao, C. Zhang, J. Z. Zhang, W. J. Song, Y. Y. Zhao, C. X. Mi, Y. He and F. Liu, Sens. Actuators, B, 2020, 308, 12 Search PubMed.
- S. S. Zhu, L. Feng, C. Zhang, Y. D. Bao and Y. He, Foods, 2019, 8, 12 Search PubMed.
- A. Femenias, F. Gatius, A. J. Ramos, V. Sanchis and S. Marin, Food Control, 2020, 111, 11 Search PubMed.
- F. Babellahi, J. Paliwal, C. Erkinbaev, M. L. Amodio, M. M. A. Chaudhry and G. Colelli, Postharvest Biol. Technol., 2020, 162, 11 Search PubMed.
- M. Fauvel, Y. Tarabalka, J. A. Benediktsson, J. Chanussot and J. C. Tilton, Proc. IEEE, 2013, 101, 652–675 Search PubMed.
- X. H. Cao, D. Wang, X. Z. Wang, J. Zhao and L. C. Jiao, Int. J. Remote Sens., 2020, 41, 4528–4548 Search PubMed.
- M. Imani and H. Ghassemian, Inf. Fusion, 2020, 59, 59–83 Search PubMed.
- L. Zhang, H. Sun, Z. Rao and H. Ji, Spectrochim. Acta, Part A, 2020, 229, 117973 Search PubMed.
- Y. LeCun, Y. Bengio and G. Hinton, Nature, 2015, 521, 436–444 Search PubMed.
- L. Zhou, C. Zhang, F. Liu, Z. J. Qiu and Y. He, Compr. Rev. Food Sci. Food Saf., 2019, 18, 1793–1811 Search PubMed.
- K. Velumani, S. Madec, B. de Solan, R. Lopez-Lozano, J. Gillet, J. Labrosse, S. Jezequel, A. Comar and F. Baret, Field Crops Res., 2020, 252, 12 Search PubMed.
- P. C. Nie, J. N. Zhang, X. P. Feng, C. L. Yu and Y. He, Sens. Actuators, B, 2019, 296, 12 Search PubMed.
- J. D. Chen, J. X. Chen, D. F. Zhang, Y. D. Sun and Y. A. Nanehkaran, Comput. Electron. Agric., 2020, 173, 11 Search PubMed.
- N. Zhang, B. Zhao, H. J. Zhang, S. Weeda, C. Yang, Z. C. Yang, S. X. Ren and Y. D. Guo, J. Pineal Res., 2013, 54, 15–23 Search PubMed.
- F. Wu, Q. Fang, S. W. Yan, L. Pan, X. J. Tang and W. L. Ye, Environ. Sci. Pollut. Res., 2020, 8, DOI:10.1007/s11356-020-08965-0.
- J. N. Zhang, X. P. Feng, X. D. Liu and Y. He, Appl. Sci., 2018, 8, 13 Search PubMed.
- K. M. He, G. Gkioxari, P. Dollar and R. Girshick, IEEE Trans. Pattern Anal. Mach. Intell., 2020, 42, 386–397 Search PubMed.
- D. P. Kingma and L. J. Ba, presented in part at the International Conference on Learning Representations (ICLR), 2015, 2015 Search PubMed.
- K. M. He, X. Y. Zhang, S. Q. Ren, J. Sun and IEEE, in 2016 IEEE Conference on Computer Vision And Pattern Recognition, IEEE, New York, 2016, pp. 770–778, DOI:10.1109/cvpr.2016.90.
- C. Q. Tan, F. C. Sun, T. Kong, W. C. Zhang, C. Yang and C. F. Liu, in Artificial Neural Networks And Machine Learning – ICANN 2018, Pt III, ed. V. Kurkova, Y. Manolopoulos, B. Hammer, L. Iliadis and I. Maglogiannis, Springer International Publishing Ag, Cham, 2018, vol. 11141, pp. 270–279 Search PubMed.
- J. B. Li, W. Q. Huang, C. J. Zhao and B. H. Zhang, J. Food Eng., 2013, 116, 324–332 Search PubMed.
- A. T. Badaro, J. F. Garcia-Martin, M. D. Lopez-Barrera, D. F. Barbin and P. Alvarez-Mateos, Food Chem., 2020, 323, 9 Search PubMed.
- T. J. Bruno and P. D. N. Svoronos, CRC handbook of fundamental spectroscopic correlation charts, CRC Press, 2005 Search PubMed.
- Z. H. Zhang, X. Yin and C. Y. Ma, Anal. Methods, 2019, 11, 5910–5918 Search PubMed.
- J. F. Sun, G. X. Wang, H. Zhang, L. M. Xia, W. P. Zhao, Y. M. Guo and X. Sun, Infrared Phys. Technol., 2020, 105, 7 Search PubMed.
- G. Geetharamani and J. A. Pandian, Comput. Electr. Eng., 2019, 76, 323–338 Search PubMed.
- N. Wu, C. Zhang, X. L. Bai, X. Y. Du and Y. He, Molecules, 2018, 23, 14 Search PubMed.
- J. Zhang, Y. Yang, X. Feng, H. Xu, J. Chen and Y. He, Front. Plant Sci., 2020, 11 Search PubMed.
- X. He, Y. S. Chen and P. Ghamisi, IEEE Trans. Geosci. Remote Sens., 2020, 58, 3246–3263 Search PubMed.
- S. L. Zhu, J. Y. Zhang, M. N. Chao, X. J. Xu, P. W. Song, J. L. Zhang and Z. W. Huang, Molecules, 2020, 25, 14 Search PubMed.
- P. Melnyk, Z. Q. You and K. Q. Li, Soft Comput., 2020, 24, 7977–7987 Search PubMed.
| This journal is © The Royal Society of Chemistry 2020 |

