 Open Access Article
A fluorescent target-guided Paal–Knorr reaction†
Sachin B. Wagh a,
Vladimir Maslivetc
 a,
James J. La Clair
 *b and
Alexander Kornienko
 *a
*a
aThe Department of Chemistry and Biochemistry, Texas State University, San Marcos 78666, USA. E-mail: a_k76@txstate.edu
bXenobe Research Institute, P. O. Box 3052, San Diego, USA. E-mail: i@xenobe.org
First published on 7th October 2020
Abstract
It has become increasingly apparent that high-diversity chemical reactions play a significant role in the discovery of bioactive small molecules. Here, we describe an expanse of this paradigm, combining a ‘target-guided synthesis’ concept with Paal–Knorr chemistry applied to the preparation of fluorescent ligands for human prostaglandin-endoperoxide synthase (COX-2).
Over the last decade, it has become clear that techniques such as protein-templated fragment ligation (PTFL)1 or target-guided synthesis (TGS)2 demonstrate the potential of biological targets to not only participate in the structure–activity relationship (SAR) analyses, but also engage in the synthetic effort. Other approaches have shown the use of proteins and cells as vehicles for lead isolation and selection,3 therein identifying the possibility for methods enabling medicinal chemical studies to be conducted directly in the presence of a protein target.
To date, reversible chemical reactions catalyzed by protein pockets referred to as PTFL, include syntheses of hemiacetals, acetals, imines, hydrazones, oximes, N,S-acetals, boronate esters, disulfides, olefin cross-metathesis, and nitro-aldol additions.4 Unfortunately, many of these reactions result in unstable ligands and often require additional operations to improve stability, such as the reduction of imines to amines with NaBH3CN. Such added steps are undesirable, as amines could have different binding preferences than imine intermediates.4c Irreversible processes, commonly referred to as TGS, are primarily limited to addition of thiols to various electrophilic molecules5a and the click reaction,5b resulting in the formation of a thioether and triazole products, respectively. Clearly, adaptation of diverse irreversible reactions to TGS is required to enable the use of multifarious drug-friendly moieties.6
Pyrroles are a fundamental motif found in natural products and marketed drugs. It has been shown to deliver leads with anti-cancer, anti-inflammatory, anti-bacterial, anti-viral, anti-malarial, anti-convulsant, anti-hypertensive, anti-psychotic, anti-cholesterolimic and anti-nociceptive activities.7 While many methods to synthesize pyrroles exist, the classical Paal–Knorr reaction,8 involving the condensation of a primary amine with a 1,4-dicarbonyl, stands out due to the mild reaction conditions. This reaction has been well documented through a variety of synthetic applications, such as the commercial preparation of Lipitor.9 In addition, the Paal–Knorr reaction is well known biologically.10 It plays a role in human metabolism and has been implicated in the neurotoxicity of n-hexane.10,11
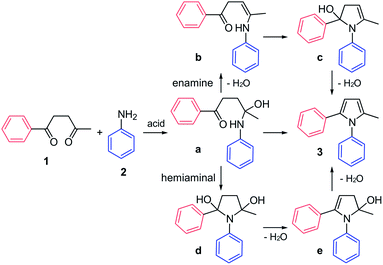
The mechanism of the Paal–Knorr reaction has been the subject of numerous investigations. The two main possibilities involve initial formation of enamine (a to b, Fig. 1) or hemiaminal (a to d Fig. 1). The calculation of potential energy surfaces using density functional theory suggests that the hemiaminal cyclization is the preferred reaction pathway.12 This is further corroborated by real-time monitoring of the reaction between aniline and acetonylacetone using extractive electrospray ionization tandem mass spectrometry, where the dihydroxy compound (d, Fig. 1) was found to be a key intermediate on the reaction path.13
The Paal–Knorr reaction requires a mild acid, which is not surprising since each step in the reaction, namely initial attack of aniline 2 onto a carbonyl in 1 resulting in adduct a, cyclization of the latter to give d, and subsequent dehydrations leading ultimately to pyrroles 3, could be accelerated by an acid catalyst. It is also tempting to propose that the Paal–Knorr reaction should proceed efficiently in presence of protein containing hydrogen bond donor residues provided that the substituents present in diketone 1 or aniline 2 and ultimately in pyrrole 3 could be accommodated at the binding site (see TOC graphic and Fig. S1†).
Moreover, when starting materials, intermediates and pyrrole products 3 are sterically and electronically compatible with the protein pocket, binding can bring reactants into close proximity thus promoting the transformation. This proposal is consistent with previous reports suggesting that the Paal–Knorr reaction could be accelerated in the presence of proteins.14
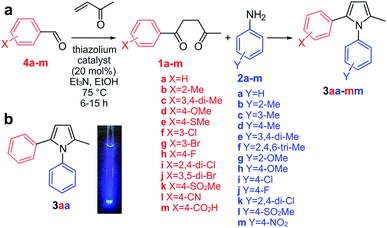
To reduce this proposal to practice, we adopted the transformation of aryl diketones 1a–m and anilines 2a–m to afford a panel of pyrroles 3aa–mm as the focus of our study (Fig. 2a). We envisioned that this reaction would be catalyzed at the active site of COX-2, an important anti-inflammatory drug target.15 This choice was based on the prior work describing diarylpyrroles as COX-2 selective inhibitors,16 and the presence of multiple hydrogen-bond donor residues at its active site (H75, Q178, Y355, Y385, R499). It should also be noted that this enzyme has been previously reported to catalyze an “in situ” click reaction, resulting in the formation of triazole products.17 This Paal–Knorr target-guided strategy is schematically illustrated in Fig. S1.†
We began by applying the Stetter reaction16 utilizing methyl vinyl ketone to prepare 1,4-diketones 1a–m from aldehydes 4a–m (Fig. 2a). Here, we found that use of 20 mol% of thiazolium catalyst provides moderate to high yields of the diketone products in a highly reproducible fashion. Using diketone 1a and aniline 2a as a model, we then established screening to produce 3aa in aqueous media. This began by developing conditions where 1a and 2a were sufficiently soluble in aqueous media. Using NMR methods, we found that 5% CH3CN in PBS pH 7.2 provided sufficient solubility (at 250 μM concentration for 1a or 2a) in PBS pH 7.2 without inducing undesired reactivity such as acetal formation (MeOH, EtOH) or oxidation (DMSO).
We then prepared pyrrole 3aa synthetically (Fig. 2a) and found that it displayed blue fluorescence with λmax of 435 ± 10 nm (Fig. 2b). Using 3aa as a guide, we developed a fluorescent screen to evaluate reactions containing 250 μM diketones 1a–m with 250 μM anilines 2a–m in PBS at pH 7.2 containing 5% CH3CN. At this concentration, we screened the levels of COX-2 required to generate a fluorescent response. Fluorescence spectra were collected with λex at 260 nm and measuring the fluorescence from λem at 280–600 nm from each well, compared to wells without COX-2. At concentrations above 30 nM, a consistent trend was obtained over 3 repetitions and 0.1 μM COX-2 was set as the concentration for screening. Next, we evaluated the optimal reaction times. Time course fluorescent monitoring indicated that this process was ideally conducted by starting the reaction at 0 °C for 2 h and then warming it up to 23 °C over 1 h and incubating for ≥10 h at 23 °C.
Over 2 repetitions, we screened a 13 × 13 array of 1a–m against 2a–m (Fig. 3) using 250 μM 1a–m, 250 μM 2a–m, 0.1 μM COX-2 in PBS pH 7.2 containing 5% CH3CN. Spectra for each reaction were compared against the corresponding reactions in the absence of COX-2 and the difference between these spectra were determined by subtracting the spectrum of the reaction without COX-2 from that with COX-2 (Fig. 3a). As shown in Fig. 3b, the presence of COX-2 either caused an increase (1j + 2f) or reduction in fluorescence (1j + 2g). This data was effectively displayed using a heat map based on the maximal change in the level of fluorescence (Fig. 3a). Interesting, the difference between the reactions with and without COX-2 also led to a change in wavelength (Fig. 3c). These shifts were observed from 300 nm to >350 nm as illustrated by maxima for 1e + 2b, 1c + 2b and 1j + 2b at λem = 340, 325, and 318 nm, respectively (Fig. 3d).
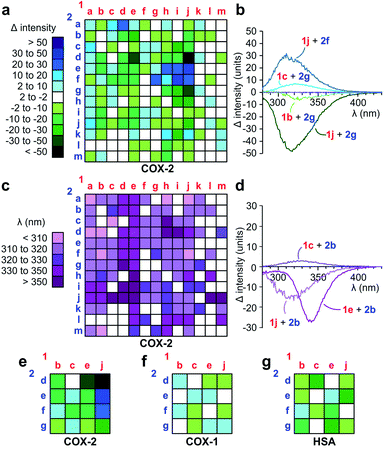 | ||
| Fig. 3 Discovery of fluorescent ligands to COX-2. (a–d) Primary screen. Ketones 1a–m (250 μM) were screened in an array against anilines 2a–m (250 μM). The entire array was run in parallel for 2 h at 0 °C then 12 h at rt in presence (0.1 μM COX-2) or absence of COX-2. (a) Heat maps depicting difference in fluorescence between the reactions in the presence or absence of COX-2. Blue indicates a gain in fluorescence and green a loss in fluorescence. (b) Selected spectra used to generate the fluorescent intensity change heat maps. (c) In addition to intensity changes, different wavelengths of fluorescence were also observed from the spectra collected in the presence or absence of COX-2. Wavelengths are given from <310 nm (light purple) to >350 nM (dark purple). White indicates no fluorescence. (d) Selected spectra used to generate the spectral shift heat maps. We observed a change in the intensity and fluorescence maxima across the 169 reactions (13 × 13 reaction matrix). (e–g) Selectivity screen. A subset of the primary screen was subjected to selectivity analyses. Using identical conditions, we compared the fluorescence obtained in the presence of (e) 0.1 μM COX-2 to that generated in the presence of (f) 0.1 μM COX-1 and (g) 0.1 μM human serum albumin (HSA) in order to identify COX-2 selective products relative to COX-1 and general protein binders using HSA. Structures of all products in (e–g) are provided in Fig. S2.† Structures with the largest response (Δ > 20) in (a) are provided in Fig. S4.† | ||
Next, we challenged the Paal–Knorr approach to generate fluorescent pyrroles that would demonstrate selectivity for COX-2, the predominating cyclooxygenase at sites of inflammation, and not COX-1, constitutively expressed in the gastrointestinal tract.18 For therapeutic use, the identification of fully-selective COX-2 inhibitors would reduce the effects on gastric mucosal prostaglandin synthesis observed with non-specific COX-2 targeting candidates.19 While phylogenetically more primitive and very similar to COX-1,15 COX-2 is distinguished by a smaller pocket within its active site. This pocket has played a key role in the selectivity of agents such as rofecoxib (Vioxx) or celecoxib (Celebrex).20
Using the data in Fig. 3a–d, we selected 16 reactions and prepared a 4 × 4 reaction array based on the highest differential in activity (dark green to dark blue, Fig. 3a) during our primary COX-2 screen. We found only modest changes in fluorescence in the presence of 0.1 μM COX-1 (Fig. 3f) or 0.1 μM HSA (Fig. 3g) when compared to 0.1 μM COX-2 (Fig. 3e). This selectivity was clearly evident in reactions conducted with 1j (right column, Fig. 3e–g). Here, the 3,5-dibromo-substitution in diketone 1j resulted in a positive gain in fluorescence when presented to 2e and 2f in the presence of COX-2 and a loss in fluorescence when presented to 2d or 2g.
We then evaluated if pyrrole formation would occur in the absence of COX-2 under the same set of conditions as used in the screens (Fig. 3). We scaled up the reactions of 1j with 2d, 2e, and 2f, so that we could chemically monitor them with TLC and 1H NMR analyses (Fig. S5†). The reactions were conducted using 250 μM of diketone and 250 μM aniline in 0.4 mL of PBS buffer containing 5% CH3CN at 23 °C. NMR and fluorescent monitoring (every 2.5 h for 15 h) indicated no conversion or fluorescence characteristic from pyrroles 3 during this period.
We then prepared samples of 3cd, 3jd, 3je, and 3jf synthetically (Fig. 2a) and compared the effect of COX-2 on their fluorescence relative to that observed in the reactions in Fig. 3. As shown in Fig. 4, we observed a decrease in fluorescence from reactions of 1j with 2d in the presence of COX-2, while the reactions between 1j and 2e or 2f, resulted in a gain in fluorescence, when compared to reactions in absence of COX-2. In contrast, the incubation of synthetically prepared 3cd and 3jd–jf all resulted in a loss in fluorescence upon binding to COX-2. This fluorescence quench was observed after adding COX-2 to 3cd, 3jd, 3je, or 3jf. This indicates that while the levels of fluorescence will increase over the course of a reaction due to the formation of 3jd, 3je, 3jf or 3cd in the presence of COX-2, product binding to COX-2 would mask the fluorescent response.
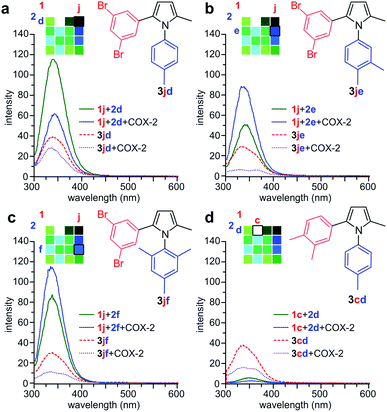 | ||
| Fig. 4 Validation studies. (a) Comparison of the reaction of 1j + 2d in the absence (green) or presence (blue) of COX-2 against 3jd in the absence (red) or presence (purple) of COX-2 (b) comparison of the reaction of 1j + 2e in the absence (green) or presence (blue) of COX-2 against 3je in the absence (red) or presence (purple) of COX-2. (c) Comparison of the reaction of 1j + 2f in the absence (green) or presence (blue) of COX-2 against 3jf in the absence (red) or presence (purple) of COX-2. (d) Comparison of the reaction of 1c + 2d in the absence (green) or presence (blue) of COX-2 against 3cd in the absence (red) or presence (purple) of COX-2. Reactions were conducted using 250 μM 1c or 250 μM 1j and 250 μM 2d–f using same conditions as in Fig. 3. Spectra were collected from reactions with 0.1 μM COX-2 or without COX-2. Spectra of the products were collected using 25 μM 3cd or 25 μM 3jd–jf with 0.2 μM COX-2 or without COX-2. A two-fold increase in COX-2 was used with 3jd–jf to highlight the spectral changes. | ||
Next, we turned to NMR for validation. As shown in Fig. 5a–c, we were able to observe the production of 3jd, 3je or 3jf in the presence of COX-2 by 1H NMR with a 35 μL sample in a 1.7 mm capillary NMR tube. Using integration to compare relative concentrations of diketone 1j to pyrroles 3jd–jf, we determined that conversions for 3jd, 3je or 3jf were 22%, 31%, and 5%, respectively. This corresponded to a turnover of 528, 740, 120 for 3jd, 3je or 3jf, respectively, indicating that, while slow, this templated reaction did turnover. Additional studies indicated that celecoxib blocked this reaction (Fig. S6†), further suggesting that the reaction occurred within a pocket of COX-2 (Fig. 6). To further explore this selectivity, we applied our NMR methods to evaluate reactions that did not show a fluorescent response. As shown in Fig. 5d, we did not observe a reaction between 1c and 2d in the presence of COX-2, suggesting that a lack of fluorescent response suggests no Paal–Knorr reactivity.
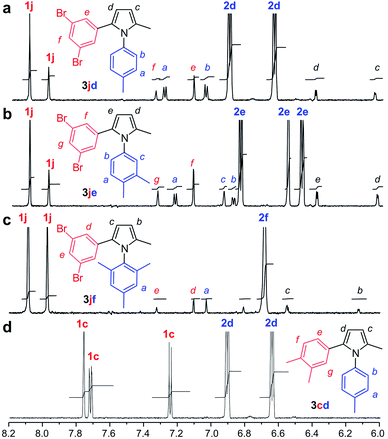 | ||
| Fig. 5 Microscale NMR evaluation. (a) 1H NMR trace indicating the formation of 3jd from the reaction of 250 μM 1j with 1250 μM 2d in the presence of 0.1 μM COX-2. (b) Comparable spectral data from the reaction of 250 μM 1j with 1250 μM 2e in the presence of 0.1 μM COX-2. (c) Comparable spectral data from the reaction of 250 μM 1j with 1250 μM 2f in the presence of 0.1 μM COX-2. (d) Comparable spectral data from the reaction of 250 μM 1c with 1250 μM 2d in the presence of 0.1 μM COX-2. These reactions were run at 10-fold increased scale compared to Fig. 3 (2 mL) to ensure accurate yield calculations. Five-fold excess of the aniline component was used in these reactions to encourage turnover. Additional spectra are provided in the ESI.† | ||
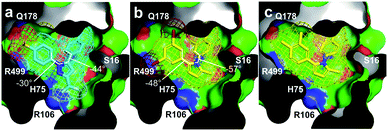 | ||
Fig. 6 Structural evaluation. (a) X-ray crystal structure (PDB ID 3LN1) depicting celecoxib (cyan) binding pocket in COX-2. The aromatic rings of celecoxib undergo deconjugative rotation, so that the aryl torsional angles21 are φ1 = −30°, φ2 = −44°. (b) Image depicting 3je (yellow) docked within the celecoxib binding pocket of COX-2 shown in (a). Here, the 3,5-dibromoaryl ring in 3je could mimic the two S![[double bond, length as m-dash]](https://www.rsc.org/images/entities/char_e001.gif) O bonds within the sulphonamide in celecoxib (proximal to R499 and Q178). Energy minimized conformations of 3je impose torsion angles of φ1 = −48°, φ2 = −57° indicating that conformation access within the biaryl motifs of 3je was comparable to that in celecoxib. (c) Image depicting 3cd (yellow) docked within the celecoxib-binding pocket of COX-2. Expanded renderings in Fig. S3.† O bonds within the sulphonamide in celecoxib (proximal to R499 and Q178). Energy minimized conformations of 3je impose torsion angles of φ1 = −48°, φ2 = −57° indicating that conformation access within the biaryl motifs of 3je was comparable to that in celecoxib. (c) Image depicting 3cd (yellow) docked within the celecoxib-binding pocket of COX-2. Expanded renderings in Fig. S3.† | ||
Interestingly, the fluorescence quench appears to arise from the fact that binding to COX-2 requires a conformational regulation leading to a reduction of conjugated states when bound. This suggestion is in part supported by the X-ray crystal structure of celecoxib bound to COX-2 (Fig. 6a).20 In order to explain why 3je formed and 3cd did not, we evaluated how these pyrroles occupy the celecoxib pocket in COX-2. We found that 3je (Fig. 6b) can dock within the same bi-aryl pocket as celecoxib. Pyrrole 3cd (Fig. 6c), which only contains methyl groups in these positions, would present additional steric requirements as well as lack the electronegativity required for interactions with COX-2.
Overall, we have shown that the Paal–Knorr reaction can be induced in the presence of COX-2 and utilized the combination of fluorescence screening and capillary NMR validation. Our work demonstrates a clear pipeline to implement this procedure for the development of fluorescent probes to a targeted protein (COX-2). Efforts are now underway to translate these materials into fluorescent probes for cellular applications as well as explore their pharmacological potential.
Conflicts of interest
There are no conflicts to declare.Acknowledgements
This work was supported by funding from the NIH under grant 1R21GM131717-01.Notes and references
- (a) O. Seitz, J. Pept. Sci., 2019, 25, e3198 CrossRef; (b) M. Jaegle, E. L. Wong, C. Tauber, E. Nawrotzky, C. Arkona and J. Rademann, Angew. Chem., Int. Ed., 2017, 56, 7358 CrossRef CAS.
- X. Hu and R. Manetsch, Chem. Soc. Rev., 2010, 39, 1316 RSC.
- P. Singh, K. Madhaiyan, M.-D. Duong-Thi, B. W. Dymock and S. Ohlson, SLAS Discovery, 2017, 22, 440 CAS.
- (a) L. Zhang, J. Dong, X. Xu and Q. Liu, Chem. Rev., 2016, 116, 287 CrossRef CAS; (b) E. Burda and J. Rademann, Nat. Commun., 2014, 5, 1 Search PubMed; (c) M. F. Schmidt, A. El-Dahshan, S. Keller and J. Rademann, Angew. Chem., Int. Ed., 2009, 48, 6346 CrossRef CAS.
- (a) E. Oueis, F. Nachon, C. Sabot and P.-Y. Renard, Chem. Commun., 2014, 50, 2043 RSC; (b) E. Oueis, C. Sabot and P.-Y. Renard, Chem. Commun., 2015, 51, 12158 RSC.
- J. Ohkanda, Chem. Rec., 2013, 13, 561 CrossRef CAS.
- V. Bhardwaj, D. Gumber, V. Abbot, S. Dhiman and P. Sharma, RSC Adv., 2015, 5, 15233 RSC.
- D. R. Dasari, J. J. La Clair and A. Kornienko, Chembiochem, 2017, 18, 1792 CrossRef.
- Y. V. Novozhilov, M. V. Dorogov, M. V. Blumina, A. V. Smirnov and M. Krasavin, Chem. Cent. J., 2015, 9, 7 CrossRef CAS.
- A. Kornienko and J. J. La Clair, Nat. Prod. Rep., 2017, 34, 1051 RSC.
- J. W. Werner-Allen, J. F. DuMond, R. L. Levine and A. Bax, Angew. Chem., Int. Ed., 2016, 55, 7374 CrossRef CAS.
- B. Mothana and R. J. Boyd, J. Mol. Struct.: THEOCHEM, 2007, 811, 97 CrossRef CAS.
- X. Zhang, M. Pei, D. Wu, S. Yang and Z. Le, Sci. Rep., 2019, 9, 19279 CrossRef.
- N. Salehi and B. B. F. Mirjalili, Iran. J. Catal., 2019, 9, 185 CAS.
- M. D. Ferrer, C. Busquets-Cortés, X. Capó, S. Tejada, J. A. Tur, A. Pons and A. Sureda, Curr. Med. Chem., 2019, 26, 3225 CrossRef CAS.
- I. K. Khanna, R. M. Weier, Y. Yu, P. W. Collins, J. M. Miyashiro, C. M. Koboldt, A. W. Veenhuizen, J. L. Currie, K. Seibert and P. C. Isakson, J. Med. Chem., 1997, 40, 1619 CrossRef CAS.
- A. Bhardwaj, J. Kaur, M. Wuest and F. Wuest, Nat. Commun., 2017, 8, 1 CrossRef.
- J. A. Mitchell, N. S. Kirkby, B. Ahmetaj-Shala, P. Armstrong, M. Crescente, P. Ferreira, M. E. L. Pires, R. K. Vaja and T. D. Warner, Pharmacol. Ther., 2020, 5, 107624 CrossRef.
- S. A. Schug, B. Parsons, C. Li and F. Xia, J. Pain Res., 2017, 10, 2451 CrossRef CAS.
- B. J. Orlando and M. G. Malkowski, Acta Crystallogr., Sect. F: Struct. Biol. Commun., 2016, 72, 772 CrossRef CAS.
- T. Egawa, K. Shinashi, T. Ueda, E. J. Ocola, W.-Y. Chiang and J. Laane, J. Phys. Chem. A, 2014, 118, 1103 CrossRef CAS.
Footnote |
| † Electronic supplementary information (ESI) available: Experimental procedures and copies of spectral data. See DOI: 10.1039/d0ra06962k |
| This journal is © The Royal Society of Chemistry 2020 |

