 Open Access Article
Suppressing loss tangent with significantly enhanced dielectric permittivity of poly(vinylidene fluoride) by filling with Au–Na1/2Y1/2Cu3Ti4O12 hybrid particles
Pornsawan Kum-onsaa,
Nutthakritta Phromviyob and
Prasit Thongbai *cd
*cd
aMaterials Science and Nanotechnology Program, Faculty of Science, Khon Kaen University, Khon Kaen 40002, Thailand
bSustainable Infrastructure Research and Development Center, Department of Civil Engineering, Faculty of Engineering, Khon Kaen University, Khon Kaen 40002, Thailand
cDepartment of Physics, Faculty of Science, Khon Kaen University, Khon Kaen 40002, Thailand. E-mail: pthongbai@kku.ac.th
dInstitute of Nanomaterials Research and Innovation for Energy (IN–RIE), NANOTEC–KKU RNN on Nanomaterials Research and Innovation for Energy, Khon Kaen University, Khon Kaen 40002, Thailand
First published on 6th November 2020
Abstract
Three-phase gold nanoparticle–Na1/2Y1/2Cu3Ti4O12 (Au–NYCTO)/poly(vinylidene fluoride) (PVDF) composites with 0.095–0.487 hybrid particle volume fractions (f) were fabricated. Au nanoparticles with a diameter of ∼10 nm were decorated on the surfaces of high-permittivity NYCTO particles using a modified Turkevich's method. The polar β-PVDF phase was confirmed to exist in the composites. Significantly enhanced dielectric permittivity of ∼98 (at 1 kHz) was obtained in the Au–NYCTO/PVDF composite with fAu–NYCTO = 0.487, while the loss tangent was suppressed to 0.09. Abrupt changes in the dielectric and electrical properties, which signified percolation behavior, were not observed even when fAu–NYCTO = 0.487. Using the effective medium percolation theory model, the percolation threshold (fc) was predicted to be at fAu–NYCTO = 0.69, at which fAu was estimated to ∼0.19 and close to the theoretical fc value for the conductor–insulator composites (fc = 0.16). A largely enhanced dielectric response in the Au–NYCTO/PVDF composites was contributed by the interfacial polarization effect and a high permittivity of the NYCTO ceramic filler. Au nanoparticles can produce the local electric field in the composites, making the dipole moments in the β-PVDF phase and NYCTO particles align with the direction of the electric field.
1. Introduction
Polymer-matrix composites (PMCs) with excellent dielectric properties are increasingly needed due to the rapid development of polymer-based electronics, especially energy-storage devices and embedded capacitors in microelectronics.1–3 Basically, the process of improving the dielectric properties of PMCs must consist of several improvement procedures: (1) selection of polymer matrices that possess good dielectric properties, (2) selection of a ceramic filler with high dielectric permittivity, and/or (3) incorporation of a conductive organic or inorganic filler for incorporation into a polymer matrix.4Poly(vinylidene fluoride) (PVDF) is an interesting polymer that has been widely used as a polymer matrix since it can exhibit a higher dielectric permittivity (ε′ ∼ 10) compared to other polymers.5–7 Furthermore, PVDF has a high breakdown voltage, which is desirable for electronics applications.
High permittivity oxide particles (e.g., BaTiO3 (BT))5,8,9 and giant permittivity oxides in the ACu3Ti4O12 (ACTO) family10–12 have been used as fillers in polymer matrices to enhance the dielectric permittivity (ε′) of the PMCs. In addition to the CaCu3Ti4O12 (CCTO) ceramic, the giant dielectric properties of other compounds in the ACTO family have been studied. Among them, Na1/2Y1/2Cu3Ti4O12 (NYCTO) is one of the most interesting oxides that has been investigated.13–15 NYCTO ceramics exhibited a large ε′ values of ∼103 to 104 with low loss tangents (tan![[thin space (1/6-em)]](https://www.rsc.org/images/entities/char_2009.gif) δ) of ∼0.03–0.1 at 1 kHz. Use of metallic fillers (e.g., Ni,16 Al,17 and Ag18,19) is also a good strategy to achieve a high ε′ value of metal–polymer composites with a relatively low loading. Unfortunately, it is hard to control the filler loading near the percolation threshold, which leads to a high tan
δ) of ∼0.03–0.1 at 1 kHz. Use of metallic fillers (e.g., Ni,16 Al,17 and Ag18,19) is also a good strategy to achieve a high ε′ value of metal–polymer composites with a relatively low loading. Unfortunately, it is hard to control the filler loading near the percolation threshold, which leads to a high tan![[thin space (1/6-em)]](https://www.rsc.org/images/entities/char_2009.gif) δ as well.
δ as well.
Balancing the tradeoff between significantly increased ε′ values while retaining low tan![[thin space (1/6-em)]](https://www.rsc.org/images/entities/char_2009.gif) δ is still a challenge. In recent years, simultaneous incorporation of high-permittivity oxide particles and metallic nanoparticles have been used to prepare three-phase PMCs. This has become an effective way to obtain high ε′ and simultaneously suppress the tan
δ is still a challenge. In recent years, simultaneous incorporation of high-permittivity oxide particles and metallic nanoparticles have been used to prepare three-phase PMCs. This has become an effective way to obtain high ε′ and simultaneously suppress the tan![[thin space (1/6-em)]](https://www.rsc.org/images/entities/char_2009.gif) δ. The strategy of incorporating hybrid particles consisting of two different filler types into a polymer matrix is of great interest to researchers. For example, Luo et al. found high a ε′ ∼ 160 and tan
δ. The strategy of incorporating hybrid particles consisting of two different filler types into a polymer matrix is of great interest to researchers. For example, Luo et al. found high a ε′ ∼ 160 and tan![[thin space (1/6-em)]](https://www.rsc.org/images/entities/char_2009.gif) δ ∼ 0.11 (at 1 kHz) were obtained in PVDF matrix nanocomposites filled with Ag–BT hybrid nanoparticles.20 Hybrid particles consisting of Au metal and NYCTO oxide nanoparticles may be one of the most effective fillers to obtain a PMC with high dielectric performance. To the best of our knowledge, a three-phase Au–NYCTO/PVDF composite system has never been reported.
δ ∼ 0.11 (at 1 kHz) were obtained in PVDF matrix nanocomposites filled with Ag–BT hybrid nanoparticles.20 Hybrid particles consisting of Au metal and NYCTO oxide nanoparticles may be one of the most effective fillers to obtain a PMC with high dielectric performance. To the best of our knowledge, a three-phase Au–NYCTO/PVDF composite system has never been reported.
In this work, a novel ternary phase composite employing Au and NYCTO as filler particles was fabricated in a PVDF polymer matrix. The NYCTO particles were synthesized via a combustion method. The surfaces of NYCTO particles were decorated with spherical Au nanoparticles using a modified Turkevich's method. Interestingly, a significantly enhanced dielectric response and low dielectric loss were accomplished in the resulting Au–NYCTO/PVDF composites. The dielectric behavior of the PMCs is described in detail.
2. Method
2.1 Preparation of NYCTO particles
NYCTO particles were synthesized using a combustion method. First, the appropriate amounts of NaNO3 (99%, KANTO), Y(NO3)3·6H2O (99.9%, KANTO) and Cu(NO3)2·4H2O (99.5%, CARLO ERBA) were dissolved in CH3COOH (ACI Labscan) using a magnetic bar stirrer at room temperature for 1 h to produce a homogenous solution. Then, C16H28O6Ti (75 wt%, Sigma-Aldrich) was dissolved into the solution and stirred for 1 h to obtain a transparent solution. Next, NH2CH2COOH (99%, ACI Labscan) was added into the solution and heated to 150 °C under continuous stirring to form a wet gel. After that, the gel was combusted at 350 °C for 0.5 h. Finally, a fine NYCTO powder was achieved by calcination at 1000 °C for 10 h.2.2 Preparation of Au–NYCTO particles
Au–NYCTO hybrid particles were fabricated using a modified Turkevich's method. First, the obtained NYCTO particles were dispersed in deionized water with the aid of ultrasonication for 0.5 h. Next, this NYCTO solution was stirred for 0.5 h at room temperature. After that, 1 mM of HAuCl4·3H2O was dissolved in this solution and then temperature of solution was increased to 100 °C with constant stirring. Next, C6H5Na3O7·2H2O (Sigma-Aldrich) was continuously dropped into the solution. To ensure the reaction was completed, the light brown solution was stirred until a dark brown solution was formed. After that, the dark brown solution was centrifuged at 8500 rpm and was washed several times with deionized water. Finally, the resulting powder was freeze-dried to produce Au–NYCTO particles.2.3 Preparation of Au–NYCTO/PVDF polymer composites
Three-phase PMCs with various volume fractions of Au–NYCTO hybrid particles (fAu–NYCTO) were prepared using the following steps. First, the Au–NYCTO hybrid particles were mixed with PVDF powder (Mw ∼ 534![[thin space (1/6-em)]](https://www.rsc.org/images/entities/char_2009.gif) 000, Sigma-Aldrich) in ethanol by ball-milling for 3 h at room temperature. Then, the mixture was heated at 80 °C for 24 h to eliminate the ethanol. Next, the dried mixture of powders was molded to disk-shapes with a diameter of 12 mm and 1.0 mm in thickness under a pressure of 10 MPa and simultaneously heated to 200 °C for 0.5 h. Finally, Au–NYCTO/PVDF samples with fAu–NYCTO = 0, 0.095, 0.191, 0.289, 0.387, and 0.487 were obtained and immediately cooled to room temperature. These Au–NYCTO/PVDF polymer composites are respectively referred to as the PVDF, Au–NYCTO/PVDF-1, Au–NYCTO/PVDF-2, Au–NYCTO/PVDF-3, Au–NYCTO/PVDF-4, and Au–NYCTO/PVDF-5 samples, respectively.
000, Sigma-Aldrich) in ethanol by ball-milling for 3 h at room temperature. Then, the mixture was heated at 80 °C for 24 h to eliminate the ethanol. Next, the dried mixture of powders was molded to disk-shapes with a diameter of 12 mm and 1.0 mm in thickness under a pressure of 10 MPa and simultaneously heated to 200 °C for 0.5 h. Finally, Au–NYCTO/PVDF samples with fAu–NYCTO = 0, 0.095, 0.191, 0.289, 0.387, and 0.487 were obtained and immediately cooled to room temperature. These Au–NYCTO/PVDF polymer composites are respectively referred to as the PVDF, Au–NYCTO/PVDF-1, Au–NYCTO/PVDF-2, Au–NYCTO/PVDF-3, Au–NYCTO/PVDF-4, and Au–NYCTO/PVDF-5 samples, respectively.
2.4 Characterization and dielectric measurement
The phase structures of NYCTO and Au–NYCTO particles were examined using X-ray diffractometry (XRD, PANalytical, EMPYREAN). Surface morphologies of Au, NYCTO and Au–NYCTO particles were revealed using transmission electron microscopy (TEM, FEI Tecnai G2 20). The fractured microstructure of the composites was observed using scanning electron microscopy (SEM, SEC, SNE-4500M). The crystalline phase of nanocomposites was determined using Fourier transform infrared spectroscopy (FTIR, Bruker, TENSOR27) in the wavenumber range of 600–1300 cm−1. Thermal behavior and crystallinity of Au–NYCTO/PVDF composites were studied using a differential scanning calorimetry (DSC, PerkinElmer, 8000 Advanced Double-Furnace) with a heating rate of 20 °C min−1 under nitrogen atmosphere. Dielectric measurements of all samples were recorded using an impedance analyzer (KEYSIGHT E4990A) over the frequency range from 102 to 106 Hz. The temperature dependence of the dielectric properties was determined over the range of −60 °C to 150 °C. The oscillation voltage was 0.5 volts. The sample electrodes were silver coated on both surfaces of samples before dielectric measurements.3. Results and discussion
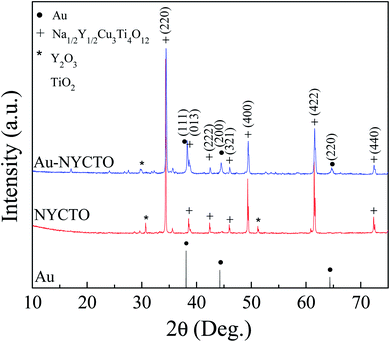
The XRD patterns of the Au standard data, NYCTO, and Au–NYCTO powders are illustrated in Fig. 1. Comparing the XRD peak intensities of the NYCTO and Au–NYCTO powders, three additional diffraction peaks were observed in the XRD pattern of the Au–NYCTO powder, corresponding to the standard data of Au (JCPDS 00-001-1172). These peaks corresponded to the (111), (200) and (220) planes. The dominant peaks of (220), (013), (222), (321), (400), (422), and (440) planes were observed in the XRD patterns of the NYCTO and Au–NYCTO, corresponding to the perovskite-like NYCTO crystalline structure. However, small amounts of Y2O3 and TiO2 phases were also detected.The morphologies of the NYCTO particles and Au–NYCTO hybrid particles are shown in Fig. 2. The inset of Fig. 2(a) shows the morphologies of a Au nanoparticle. As revealed in Fig. 2(a), it can be seen that NYCTO displays an irregular shape. Meanwhile, the Au nanoparticle has a spherical shape that is ≈10 nm in diameter. Fig. 2(b) presents the distribution of Au nanoparticles on the surfaces of NYCTO particles. Au nanoparticles were discretely attached onto NYCTO surfaces. As reported by Luo et al.,6 the discrete growth of Ag nanoparticles on BaTiO3 particles can cause an increase in the dielectric response of the Ag–BaTiO3/PVDF composites while suppressing increases in conductivity and dielectric losses. Similarly, enhanced dielectric performance is expected in the Au–NYCTO/PVDF composites.
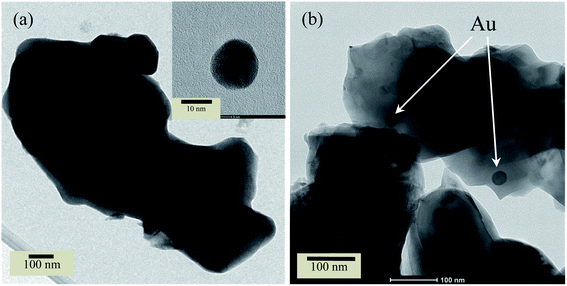 | ||
| Fig. 2 TEM images of surface morphologies of (a) NYCTO, (b) Au–NYCTO particles. Inset of (a) shows a Au nanoparticle. | ||
Fig. 3 shows XRD patterns of Au–NYCTO/PVDF nanocomposites with various loadings of Au–NYCTO filler. All composites exhibit the evident peaks of NYCTO. The dominant peaks did not change in the composites with different filler loadings. The small characteristic peaks of Au were observed in the Au–NYCTO/PVDF composites. It is notable that the concentration of Au was ≈7.3 wt% in the Au–NYCTO hybrid particles. In the XRD patterns of the Au–NYCTO/PVDF composites, the α-PVDF phase was almost invisible since the semi-crystalline phase of PVDF decreased with the increased crystalline phase of Au–NYCTO. However, small amounts of impurity phases were still detected in the composites.
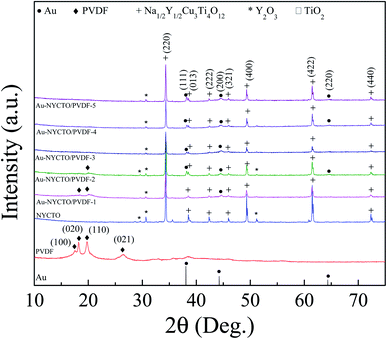 | ||
| Fig. 3 XRD patterns of Au standard data, NYCTO particles and Au–NYCTO/PVDF nanocomposites with various contents of Au–NYCTO. | ||
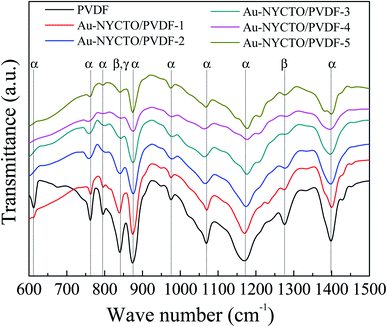
Fig. 4 presents the FTIR spectra of the Au–NYCTO/PVDF composites with various volume fractions of Au–NYCTO hybrid particles (fAu–NYCTO). Characteristic transmittance peaks were observed, corresponding to the α-, β- and γ-phases of the PVDF polymer.7,21 The characteristic bands of α-phase were observed at 613, 762, 797, 874, 976, 1071, 1177 and 1398 cm−1.22–24 The band at 841 cm−1, assigned to the γ-phase.22,23 At the same time appear bands at 841 and 1275 cm−1, characteristic for β-phase.22,23 Moreover, the bands at 613, 762, 874 and 1275 cm−1 were attributed to the CCC skeletal bending vibration. The characteristic bands at 874, 1071 and 1275 cm−1 were assigned to the CC skeletal symmetric stretching vibration, while the bands at 841, 874, 1177 and 1275 cm−1 were assigned to the CF2 symmetric stretching vibration. The bending of CF2 group was detected at 613 and 762 cm−1. The wagging of CH2 group was observed at 1398 cm−1. The rocking of CH2 and the twisting of CH2 groups were detected at 841, 797 and 976, 1177 cm−1, respectively. After Au–NYCTO hybrid particles were incorporated into the PVDF matrix, the transmittance intensity of the composites was reduced. The peaks of the α-, β- and γ-phases became weaker because of decreasing PVDF content. Notably, the β-PVDF phase was presented in the composites, which can result in enhancement of ε′.25
Fig. 5 displays SEM images of the fractured cross-sections of Au–NYCTO/PVDF composites with various fAu–NYCTO fractions. As shown in Fig. 5(a), the PVDF matrix forms a continuous phase. The Au–NYCTO particles were homogenously and randomly dispersed due to a low fAu–NYCTO. When fAu–NYCTO was increased to 0.191 and 0.289 [Fig. 5(b) and (c)] agglomeration of the filler was observed.
 | ||
| Fig. 5 SEM images of fractured morphologies of (a) Au–NYCTO/PVDF-1, (b) Au–NYCTO/PVDF-2, and (c) Au–NYCTO/PVDF-3 composites. | ||
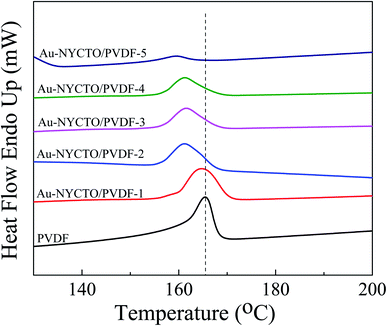
The DSC spectra of the Au–NYCTO/PVDF composites are shown in Fig. 6. The positions of the melting peaks (Tm) slightly shifted to a low temperature by incorporating Au–NYCTO. Besides, as the Au–NYCTO content increased, the enthalpy of melting (ΔHm) and the crystallinity degree (Xc) of nanocomposites decreased obviously, as summarized in Table 1. The Xc of composites can be calculated by using the following equation  , where ΔHm is the melting enthalpy of the sample (J g−1), and ΔHm100% is the melting enthalpy of fusion for 100% crystalline PVDF (104.7 J g−1). It can be observed that the Xc decreased from 18.36% for a pure PVDF polymer to 2.06% for the composite with fAu–NYCTO = 0.487. The result could be described that the Au–NYCTO particles hinder the PVDF polymer chain movement, affecting to the incomplete melting and crystallization process. This resulted in a further decrease in both the Xc and Tm.
| Sample | Melting temperature, Tm (°C) | Melting enthalpy, ΔHm (J g−1) | Crystallinity degree, Xc (%) |
|---|---|---|---|
| PVDF | 165.54 | 19.22 | 18.36 |
| Au–NYCTO/PVDF-1 | 164.75 | 18.91 | 18.06 |
| Au–NYCTO/PVDF-2 | 161.27 | 17.65 | 16.86 |
| Au–NYCTO/PVDF-3 | 161.58 | 14.65 | 13.99 |
| Au–NYCTO/PVDF-4 | 161.23 | 11.68 | 11.16 |
| Au–NYCTO/PVDF-5 | 159.43 | 2.16 | 2.06 |
The frequency dependence of ε′ and tan![[thin space (1/6-em)]](https://www.rsc.org/images/entities/char_2009.gif) δ at room temperature for the Au–NYCTO/PVDF composites with various fAu–NYCTO fractions is shown in Fig. 7. ε′ significantly increased with the fAu–NYCTO faction over the frequency range of 102 to 106 Hz. The ε′ value of Au–NY/PVDF-5 (fAu = 0.075, and fNYCTO = 0.412) reached 97.9 at 1 kHz, which is ≈10 times higher than pure PVDF polymer. At 102 Hz, ε′ was greater than 100. Furthermore, ε′ of all composites was slightly dependent on the frequency over the measured frequency range. It is noteworthy that the tan
δ at room temperature for the Au–NYCTO/PVDF composites with various fAu–NYCTO fractions is shown in Fig. 7. ε′ significantly increased with the fAu–NYCTO faction over the frequency range of 102 to 106 Hz. The ε′ value of Au–NY/PVDF-5 (fAu = 0.075, and fNYCTO = 0.412) reached 97.9 at 1 kHz, which is ≈10 times higher than pure PVDF polymer. At 102 Hz, ε′ was greater than 100. Furthermore, ε′ of all composites was slightly dependent on the frequency over the measured frequency range. It is noteworthy that the tan![[thin space (1/6-em)]](https://www.rsc.org/images/entities/char_2009.gif) δ values at 103 Hz of the composites were all lower than 0.1. This result is rarely observed in other ceramic/polymer composite systems.10,26–32 Compared with two-phase NYCTO/PVDF composites (ε′ ∼ 84, tan
δ values at 103 Hz of the composites were all lower than 0.1. This result is rarely observed in other ceramic/polymer composite systems.10,26–32 Compared with two-phase NYCTO/PVDF composites (ε′ ∼ 84, tan![[thin space (1/6-em)]](https://www.rsc.org/images/entities/char_2009.gif) δ ∼ 0.11 at 1 kHz) with fNYCTO = 0.5, a higher ε′ value (∼98) for the three-phase Au–NYCTO/PVDF composite with fAu–NYCTO = 0.487 was achieved with a lower tan
δ ∼ 0.11 at 1 kHz) with fNYCTO = 0.5, a higher ε′ value (∼98) for the three-phase Au–NYCTO/PVDF composite with fAu–NYCTO = 0.487 was achieved with a lower tan![[thin space (1/6-em)]](https://www.rsc.org/images/entities/char_2009.gif) δ, ∼0.09. This demonstrates that surface decoration of NYCTO with Au nanoparticles should result in increased dielectric response. Fang et al.33 reported a greatly enhanced ε′ ∼ 208 at 1 kHz in the BT–(31 wt%)Ag/PVDF composite with fBT–Ag = 0.563, while tan
δ, ∼0.09. This demonstrates that surface decoration of NYCTO with Au nanoparticles should result in increased dielectric response. Fang et al.33 reported a greatly enhanced ε′ ∼ 208 at 1 kHz in the BT–(31 wt%)Ag/PVDF composite with fBT–Ag = 0.563, while tan![[thin space (1/6-em)]](https://www.rsc.org/images/entities/char_2009.gif) δ was very large (0.155). It was also reported that a high ε′ ∼ 320 at 1 kHz with high tan
δ was very large (0.155). It was also reported that a high ε′ ∼ 320 at 1 kHz with high tan![[thin space (1/6-em)]](https://www.rsc.org/images/entities/char_2009.gif) δ ∼ 0.2 was obtained in (f = 0.2)BT–(f = 0.2)Ni/PVDF composite.34 It is important to note that the ε′ value of the Au–NYCTO/PVDF composite with fAu–NYCTO = 0.487 was lower than those of the BT–Ag/PVDF and BT–Ni/PVDF composites. This may be due to the weakened δ-phase (polar phase) in composites.
δ ∼ 0.2 was obtained in (f = 0.2)BT–(f = 0.2)Ni/PVDF composite.34 It is important to note that the ε′ value of the Au–NYCTO/PVDF composite with fAu–NYCTO = 0.487 was lower than those of the BT–Ag/PVDF and BT–Ni/PVDF composites. This may be due to the weakened δ-phase (polar phase) in composites.
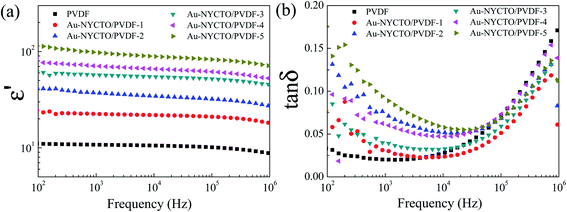 | ||
Fig. 7 Frequency dependence of (a) ε′ and (b) tan![[thin space (1/6-em)]](https://www.rsc.org/images/entities/char_2009.gif) δ at room temperature of Au–NYCTO composites with various contents of Au–NYCTO filler. δ at room temperature of Au–NYCTO composites with various contents of Au–NYCTO filler. | ||
Obviously, incorporation of small amounts of Au nanoparticles into the composite system can promote interfacial polarization, giving rise to the increased dielectric response. In other words, the increased conductivity of the interlayer between NYCTO and PVDF created by Au nanoparticles enhances the Maxwell–Wagner–Sillars (MWS) effect.35 tan![[thin space (1/6-em)]](https://www.rsc.org/images/entities/char_2009.gif) δ shows a different tendency in low- and high-frequency ranges, as seen in Fig. 7(b). The tan
δ shows a different tendency in low- and high-frequency ranges, as seen in Fig. 7(b). The tan![[thin space (1/6-em)]](https://www.rsc.org/images/entities/char_2009.gif) δ values in the low-frequency range from 102 to 105 Hz are greatly increased with fAu–NYCTO due to interfacial polarization, which is obviously weakened with increased frequency. A sharp increase tan
δ values in the low-frequency range from 102 to 105 Hz are greatly increased with fAu–NYCTO due to interfacial polarization, which is obviously weakened with increased frequency. A sharp increase tan![[thin space (1/6-em)]](https://www.rsc.org/images/entities/char_2009.gif) δ is noted at frequencies over 105 Hz, which is a typical feature of the glass transition relaxation of the PVDF matrix.10 In a high-frequency range, tan
δ is noted at frequencies over 105 Hz, which is a typical feature of the glass transition relaxation of the PVDF matrix.10 In a high-frequency range, tan![[thin space (1/6-em)]](https://www.rsc.org/images/entities/char_2009.gif) δ slightly decreased with increasing fAu–NYCTO. It noteworthy that the enhanced ε′ of the Au–NYCTO/PVDF composites was significantly increased, while largely increased tan
δ slightly decreased with increasing fAu–NYCTO. It noteworthy that the enhanced ε′ of the Au–NYCTO/PVDF composites was significantly increased, while largely increased tan![[thin space (1/6-em)]](https://www.rsc.org/images/entities/char_2009.gif) δ was suppressed. ε′ and tan
δ was suppressed. ε′ and tan![[thin space (1/6-em)]](https://www.rsc.org/images/entities/char_2009.gif) δ values at 103 and 104 Hz (at room temperature) of the Au–NYCTO/PVDF composites with various filler loadings are given in Table 2.
δ values at 103 and 104 Hz (at room temperature) of the Au–NYCTO/PVDF composites with various filler loadings are given in Table 2.
![[thin space (1/6-em)]](https://www.rsc.org/images/entities/char_2009.gif) δ at 1 kHz and 10 kHz of Au–NYCTO/PVDF nanocomposites
δ at 1 kHz and 10 kHz of Au–NYCTO/PVDF nanocomposites
| Sample | fAu | fNYCTO | fAu–NYCTO | 1 kHz | 10 kHz | ||
|---|---|---|---|---|---|---|---|
| ε′ | tan![[thin space (1/6-em)]](https://www.rsc.org/images/entities/char_2009.gif) δ δ |
ε′ | tan![[thin space (1/6-em)]](https://www.rsc.org/images/entities/char_2009.gif) δ δ |
||||
| PVDF | 0 | 0 | 0 | 10.8 | 0.020 | 10.6 | 0.028 |
| Au–NYCTO/PVDF-1 | 0.008 | 0.087 | 0.095 | 22.5 | 0.030 | 21.9 | 0.023 |
| Au–NYCTO/PVDF-2 | 0.019 | 0.172 | 0.191 | 37.3 | 0.073 | 34.4 | 0.051 |
| Au–NYCTO/PVDF-3 | 0.032 | 0.257 | 0.289 | 51.2 | 0.040 | 54.7 | 0.033 |
| Au–NYCTO/PVDF-4 | 0.049 | 0.338 | 0.387 | 70.8 | 0.061 | 66.1 | 0.047 |
| Au–NYCTO/PVDF-5 | 0.075 | 0.412 | 0.487 | 97.9 | 0.090 | 89.0 | 0.068 |
The temperature dependence of ε′ and tan![[thin space (1/6-em)]](https://www.rsc.org/images/entities/char_2009.gif) δ for the Au–NYCTO composites with various fAu–NYCTO fractions are illustrated in Fig. 8. The ε′ value increased with temperature. Generally, in a low-temperature range, the dipoles freeze and become resistant to rotation caused by the applied electric field.36,37 At higher temperatures, the dipoles can easily be rotated by an applied electric field. Hence, polarization can be fully produced, giving rise to obtain a larger ε′. It was observed that ε′ rapidly increased at temperatures higher than 100 °C, corresponding to greatly increased tan
δ for the Au–NYCTO composites with various fAu–NYCTO fractions are illustrated in Fig. 8. The ε′ value increased with temperature. Generally, in a low-temperature range, the dipoles freeze and become resistant to rotation caused by the applied electric field.36,37 At higher temperatures, the dipoles can easily be rotated by an applied electric field. Hence, polarization can be fully produced, giving rise to obtain a larger ε′. It was observed that ε′ rapidly increased at temperatures higher than 100 °C, corresponding to greatly increased tan![[thin space (1/6-em)]](https://www.rsc.org/images/entities/char_2009.gif) δ values. This result can be attributed to interfacial polarization associated with the conduction of free charge carriers in the composites.6 A tan
δ values. This result can be attributed to interfacial polarization associated with the conduction of free charge carriers in the composites.6 A tan![[thin space (1/6-em)]](https://www.rsc.org/images/entities/char_2009.gif) δ relaxation peak was observed in the temperature range from −50 to 0 °C, Fig. 8(b). This relaxation was attributed to the glass transition temperature of the PVDF polymer.38,39
δ relaxation peak was observed in the temperature range from −50 to 0 °C, Fig. 8(b). This relaxation was attributed to the glass transition temperature of the PVDF polymer.38,39
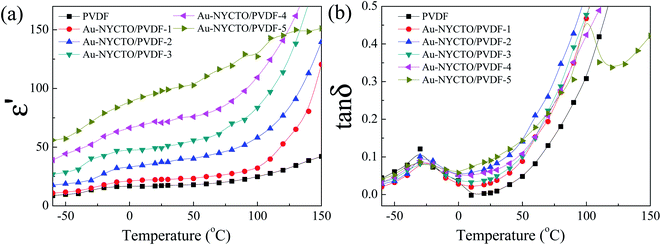 | ||
Fig. 8 Temperature dependence of (a) ε′, and (b) tan![[thin space (1/6-em)]](https://www.rsc.org/images/entities/char_2009.gif) δ at 103 Hz of Au–NYCTO/PVDF composites with various contents of Au–NYCTO composite. δ at 103 Hz of Au–NYCTO/PVDF composites with various contents of Au–NYCTO composite. | ||
Fig. 9 shows variations of ε′ and tan![[thin space (1/6-em)]](https://www.rsc.org/images/entities/char_2009.gif) δ for composites as a function of fAu–NYCTO at room temperature and 1 kHz. ε′ of the Au–NYCTO/PVDF composites continuously and linearly increased with the content of Au–NYCTO. The significant increase in ε′ of the Au–NYCTO/PVDF can be ascribed to the homogeneous dispersion of Au–NYCTO in the PVDF polymer. Surprisingly, tan
δ for composites as a function of fAu–NYCTO at room temperature and 1 kHz. ε′ of the Au–NYCTO/PVDF composites continuously and linearly increased with the content of Au–NYCTO. The significant increase in ε′ of the Au–NYCTO/PVDF can be ascribed to the homogeneous dispersion of Au–NYCTO in the PVDF polymer. Surprisingly, tan![[thin space (1/6-em)]](https://www.rsc.org/images/entities/char_2009.gif) δ was kept to values lower than 0.1 for all composites—no abrupt changes in ε′ and tan
δ was kept to values lower than 0.1 for all composites—no abrupt changes in ε′ and tan![[thin space (1/6-em)]](https://www.rsc.org/images/entities/char_2009.gif) δ at any fAu–NYCTO level was observed. Therefore, no percolation network or concurrent conducting pathways were formed in the composites with fAu–NYCTO ≤ 0.487.40,41 Thus, the percolation theory (PT) cannot be used to explain the dielectric behavior of the Au–NYCTO/PVDF composites. This may be due to the fact that the maximum loading of Au nanoparticles in the composites is 7.5 vol%, while the theoretical percolation threshold (fc) of an insulator-matrix composites filled with the spherical conductor-nanoparticles is ∼16 vol% (fc = 0.16).40,41 Basically, the effective medium theory (EMT), Maxwell–Garnett (M–G), Yamada, and Lichtenecker models cannot be used to describe the dielectric behavior of the Au–NYCTO/PVDF composites because these models were derived without considering the interfacial effect between the filler and matrix.
δ at any fAu–NYCTO level was observed. Therefore, no percolation network or concurrent conducting pathways were formed in the composites with fAu–NYCTO ≤ 0.487.40,41 Thus, the percolation theory (PT) cannot be used to explain the dielectric behavior of the Au–NYCTO/PVDF composites. This may be due to the fact that the maximum loading of Au nanoparticles in the composites is 7.5 vol%, while the theoretical percolation threshold (fc) of an insulator-matrix composites filled with the spherical conductor-nanoparticles is ∼16 vol% (fc = 0.16).40,41 Basically, the effective medium theory (EMT), Maxwell–Garnett (M–G), Yamada, and Lichtenecker models cannot be used to describe the dielectric behavior of the Au–NYCTO/PVDF composites because these models were derived without considering the interfacial effect between the filler and matrix.
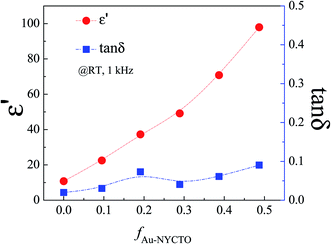 | ||
Fig. 9 ε′ and tan![[thin space (1/6-em)]](https://www.rsc.org/images/entities/char_2009.gif) δ at room temperature and 103 Hz for Au–NYCTO/PVDF composites with various contents of Au–NYCTO. δ at room temperature and 103 Hz for Au–NYCTO/PVDF composites with various contents of Au–NYCTO. | ||
Alternatively, a combination of the PT and EMT models, i.e., the effective medium percolation theory model (EMPT), may be more suitable than either model alone.27,42 The EMPT model is usually used to predict the ε′ value of ceramic–metal/polymer composites (e.g., BaTiO3–Cu/PVDF composites).43 The effective dielectric permittivity (εeff) of the composites can be expressed as eqn (1),
 | (1) |
fAu = 0.008![[thin space (1/6-em)]](https://www.rsc.org/images/entities/char_2009.gif) exp(4.609fAu−NYCTO). exp(4.609fAu−NYCTO).
| (2) |
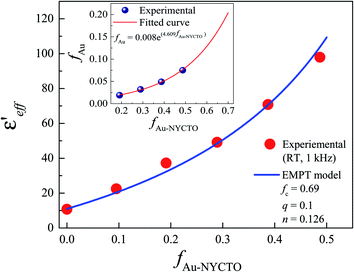 | ||
| Fig. 10 ε′ (1 kHz) of Au–NYCTO/PVDF composites fitted by EMPT model. Inset shows the correlation of fAu and fAu–NYCTO; the solid curve is the best exponential fitting data. | ||
When the volume fraction of Au–NYCTO hybrid particles increased to 0.487, the high-permittivity NYCTO loading and Au nanoparticles increased. Thus, the first reason for the increased dielectric response in the composite was attributed to a very high ε′ of the NYCTO filler particles. The ε′ and tan![[thin space (1/6-em)]](https://www.rsc.org/images/entities/char_2009.gif) δ values at 1 kHz of the two-phase NYCTO/PVDF composite with fNYCTO = 0.4 was found to be ∼66 and 0.099, respectively. The ε′ value of the three-phase composite with fAu–NYCTO = 0.487 (i.e., fAu = 0.075 and fNYCTO = 0.412) was ∼98. The ε′ of the NYCTO/PVDF composite with fNYCTO = 0.4 can be increased by ∼48% after the addition of 7 vol% Au nanoparticles. The second reason for the enhanced ε′ of the Au–NYCTO/PVDF composite was attributed to the increase in the interfacial polarization intensity. Furthermore, the interparticle distance between the Au–NYCTO hybrid particles would be shortened as fAu–NYCTO increased. The effect of micro–capacitor formation was dominant as the dielectric layer (i.e., β-PVDF) between two inner electrodes (i.e., Au nanoparticles) was thinner, giving rise to the enhanced capacitance value of the micro–capacitor. Notably, tan
δ values at 1 kHz of the two-phase NYCTO/PVDF composite with fNYCTO = 0.4 was found to be ∼66 and 0.099, respectively. The ε′ value of the three-phase composite with fAu–NYCTO = 0.487 (i.e., fAu = 0.075 and fNYCTO = 0.412) was ∼98. The ε′ of the NYCTO/PVDF composite with fNYCTO = 0.4 can be increased by ∼48% after the addition of 7 vol% Au nanoparticles. The second reason for the enhanced ε′ of the Au–NYCTO/PVDF composite was attributed to the increase in the interfacial polarization intensity. Furthermore, the interparticle distance between the Au–NYCTO hybrid particles would be shortened as fAu–NYCTO increased. The effect of micro–capacitor formation was dominant as the dielectric layer (i.e., β-PVDF) between two inner electrodes (i.e., Au nanoparticles) was thinner, giving rise to the enhanced capacitance value of the micro–capacitor. Notably, tan![[thin space (1/6-em)]](https://www.rsc.org/images/entities/char_2009.gif) δ values of the NYCTO/PVDF and Au–NYCTO/PVDF composites were nearly the same in value. Thus, the incorporation of Au nanoparticles has a slight effect on the dielectric loss. This may be due to the discrete growth of Au nanoparticles on the surface of NYCTO particles, preventing the direct contact between Au nanoparticles.6,44–46 It is worth noting that the dielectric properties of the Au–NYCTO/PVDF composites could be further improved by adjusting the Au concentration in the hybrid particles. A higher dielectric response may be achieved by increasing the Au concentration in the hybrid particles due to the increased interfacial polarization.
δ values of the NYCTO/PVDF and Au–NYCTO/PVDF composites were nearly the same in value. Thus, the incorporation of Au nanoparticles has a slight effect on the dielectric loss. This may be due to the discrete growth of Au nanoparticles on the surface of NYCTO particles, preventing the direct contact between Au nanoparticles.6,44–46 It is worth noting that the dielectric properties of the Au–NYCTO/PVDF composites could be further improved by adjusting the Au concentration in the hybrid particles. A higher dielectric response may be achieved by increasing the Au concentration in the hybrid particles due to the increased interfacial polarization.
4. Conclusions
PVDF polymer composites incorporating Au–NYCTO hybrid particles were successfully fabricated. Au nanoparticles were decorated on the NYCTO surfaces using a modified Turkevich's method. The polar β-PVDF phase was detected in the composites, which has an important contribution to the enhanced dielectric response. The weakened δ-phase in composites inhibited a largely enhanced ε′ value. The ε′ value at 103 Hz of the composite with fAu–NYCTO = 0.487 was obtained 97.9, while tan![[thin space (1/6-em)]](https://www.rsc.org/images/entities/char_2009.gif) δ was 0.09. According to fitted data using the EMPT model, the percolation behavior was predicted to exist at fAu–NYCTO = 0.69 (fAu ∼ 0.19), corresponding to fc = 0.16 for the theoretical value of the conductor–insulator composites. A largely enhanced ε′ in the Au–NYCTO/PVDF composites was associated with the interfacial polarization effect and a high ε′ of the NYCTO ceramic filler. The introduction of Au nanoparticles produced stronger interfacial polarization.
δ was 0.09. According to fitted data using the EMPT model, the percolation behavior was predicted to exist at fAu–NYCTO = 0.69 (fAu ∼ 0.19), corresponding to fc = 0.16 for the theoretical value of the conductor–insulator composites. A largely enhanced ε′ in the Au–NYCTO/PVDF composites was associated with the interfacial polarization effect and a high ε′ of the NYCTO ceramic filler. The introduction of Au nanoparticles produced stronger interfacial polarization.
Conflicts of interest
There are no conflicts to declare.Acknowledgements
This work was financially supported by the Synchrotron Light Research Institute, Khon Kaen University, and the Thailand Research Fund (TRF) [Grant No. BRG6180003]. It was partially supported by the Research Network NANOTEC (RNN) program of the National Nanotechnology Center (NANOTEC), NSTDA, Ministry of Higher Education, Science, Research, and Innovation (MHESI) and the Research Program of Khon Kaen University, Thailand. N. P. would like to thank the Graduate School, Khon Kaen University for partially support with a partial scholarship under the Post-doctoral Program (60170), Thailand. P. K. would like to thank the Science Achievement Scholarship of Thailand (SAST) for her PhD of Science Degree scholarship.References
- Z. M. Dang, Y. H. Lin and C. W. Nan, Adv. Mater., 2003, 15, 1625–1629 CrossRef CAS.
- Z.-M. Dang, H.-Y. Wang, Y.-H. Zhang and J.-Q. Qi, Macromol. Rapid Commun., 2005, 26, 1185–1189 CrossRef CAS.
- Z.-M. Dang, T. Zhou, S.-H. Yao, J.-K. Yuan, J.-W. Zha, H.-T. Song, J.-Y. Li, Q. Chen, W.-T. Yang and J. Bai, Adv. Mater., 2009, 21, 2077–2082 CrossRef CAS.
- W. Zhou, L. Xu, L. Jiang, J. Peng, Y. Gong, X. Liu, H. Cai, G. Wang and Q. Chen, J. Alloys Compd., 2017, 710, 47–56 CrossRef CAS.
- Z.-M. Dang, Y.-F. Yu, H.-P. Xu and J. Bai, Compos. Sci. Technol., 2008, 68, 171–177 CrossRef CAS.
- S. Luo, S. Yu, R. Sun and C.-P. Wong, ACS Appl. Mater. Interfaces, 2014, 6, 176–182 CrossRef CAS.
- P. Martins, A. C. Lopes and S. Lanceros-Mendez, Prog. Polym. Sci., 2014, 39, 683–706 CrossRef CAS.
- M.-F. Lin, V. K. Thakur, E. J. Tan and P. S. Lee, RSC Adv., 2011, 1, 576–578 RSC.
- X. Zhang, S. Zhao, F. Wang, Y. Ma, L. Wang, D. Chen, C. Zhao and W. Yang, Appl. Surf. Sci., 2017, 403, 71–79 CrossRef CAS.
- Y.-l. Su, C. Sun, W.-q. Zhang and H. Huang, J. Mater. Sci., 2013, 48, 8147–8152 CrossRef CAS.
- P. Thomas, R. S. E. Ravindran and K. B. R. Varma, Polym. Eng. Sci., 2014, 54, 551–558 CrossRef CAS.
- C. Yang, H.-s. Song and D.-b. Liu, Composites, Part B, 2013, 50, 180–186 CrossRef CAS.
- P. Liang, Y. Li, Y. Zhao, L. Wei and Z. Yang, J. Appl. Phys., 2013, 113, 224102 CrossRef.
- W. Somphan, N. Sangwong, T. Yamwong and P. Thongbai, J. Mater. Sci.: Mater. Electron., 2011, 23, 1229–1234 CrossRef.
- J. Jumpatam, A. Mooltang, B. Putasaeng, P. Kidkhunthod, N. Chanlek, P. Thongbai and S. Maensiri, Ceram. Int., 2016, 42, 16287–16295 CrossRef CAS.
- Z. Wang, W. Zhou, L. Dong, X. Sui, H. Cai, J. Zuo and Q. Chen, J. Alloys Compd., 2016, 682, 738–745 CrossRef CAS.
- H. S. Ju, D. H. Im, S. D. Park, H. G. Lee and E. S. Kim, Jpn. J. Appl. Phys., 2012, 51, 09ML01 CrossRef.
- X. Huang, P. Jiang and L. Xie, Appl. Phys. Lett., 2009, 95, 242901 CrossRef.
- J. Audoit, L. Laffont, A. Lonjon, E. Dantras and C. Lacabanne, Polymer, 2015, 78, 104–110 CrossRef CAS.
- S. Luo, S. Yu, R. Sun and C. P. Wong, ACS Appl. Mater. Interfaces, 2014, 6, 176–182 CrossRef CAS.
- N. Meng, X. Zhu, R. Mao, M. J. Reece and E. Bilotti, J. Mater. Chem. C, 2017, 5, 3296–3305 RSC.
- Y. Bormashenko, R. Pogreb, O. Stanevsky and E. Bormashenko, Polym. Test., 2004, 23, 791–796 CrossRef CAS.
- H.-C. Yang, Q.-Y. Wu, H.-Q. Liang, L.-S. Wan and Z.-K. Xu, J. Polym. Sci., Part B: Polym. Phys., 2013, 51, 1438–1447 CrossRef CAS.
- S. Lanceros-Méndez, J. F. Mano, A. M. Costa and V. H. Schmidt, J. Macromol. Sci., Part B: Phys., 2001, 40, 517–527 CrossRef.
- J. Yao, C. Xiong, L. Dong, C. Chen, Y. Lei, L. Chen, R. Li, Q. Zhu and X. Liu, J. Mater. Chem., 2009, 19, 2817–2821 RSC.
- P. Thomas, K. T. Varughese, K. Dwarakanath and K. B. R. Varma, Compos. Sci. Technol., 2010, 70, 539–545 CrossRef CAS.
- K. Meeporn, P. Thongbai, T. Yamwong and S. Maensiri, RSC Adv., 2017, 7, 17128–17136 RSC.
- Z.-M. Dang, H.-P. Xu, D. Xie and L. Li, Mater. Lett., 2007, 61, 511–515 CrossRef CAS.
- P. Kum-onsa, P. Thongbai, S. Maensiri and P. Chindaprasirt, J. Mater. Sci.: Mater. Electron., 2016, 27, 9650–9655 CrossRef CAS.
- D. Bhadra, A. Biswas, S. Sarkar, B. K. Chaudhuri, K. F. Tseng and H. D. Yang, J. Appl. Phys., 2010, 107, 124115 CrossRef.
- K. Meeporn, S. Maensiri and P. Thongbai, Appl. Surf. Sci., 2016, 380, 67–72 CrossRef CAS.
- M. Fang, Z. Wang, H. Li and Y. Wen, Ceram. Int., 2015, 41(suppl. 1), S387–S392 CrossRef CAS.
- F. Fang, W. Yang, S. Yu, S. Luo and R. Sun, Appl. Phys. Lett., 2014, 104, 132909 CrossRef.
- Z.-M. Dang, Y. Shen and C.-W. Nan, Appl. Phys. Lett., 2002, 81, 4814–4816 CrossRef CAS.
- C. Zhang, Q. Chi, J. Dong, Y. Cui, X. Wang, L. Liu and Q. Lei, Sci. Rep., 2016, 6, 33508 CrossRef CAS.
- C. C. Homes, T. Vogt, S. M. Shapiro, S. Wakimoto and A. P. Ramirez, Science, 2001, 293, 673–676 CrossRef CAS.
- J. Wu, C.-W. Nan, Y. Lin and Y. Deng, Phys. Rev. Lett., 2002, 89, 217601 CrossRef.
- A. C. Lopes, C. M. Costa, R. S. i. Serra, I. C. Neves, J. L. G. Ribelles and S. Lanceros-Méndez, Solid State Ionics, 2013, 235, 42–50 CrossRef CAS.
- T. Zhou, J.-W. Zha, R.-Y. Cui, B.-H. Fan, J.-K. Yuan and Z.-M. Dang, ACS Appl. Mater. Interfaces, 2011, 3, 2184–2188 CrossRef CAS.
- C. W. Nan, Y. Shen and J. Ma, Annu. Rev. Mater. Res., 2010, 40, 131–151 CrossRef CAS.
- C.-W. Nan, Prog. Mater. Sci., 1993, 37, 1–116 CrossRef CAS.
- K. Meeporn, N. Chanlek and P. Thongbai, RSC Adv., 2020, 10, 2747–2756 RSC.
- C. Li, S. Yu, S. Luo, W. Yang, Z. Ge, H. Huang, R. Sun and C.-P. Wong, RSC Adv., 2016, 6, 36450–36458 RSC.
- N. Phromviyo, N. Chanlek, P. Thongbai and S. Maensiri, Appl. Surf. Sci., 2018, 446, 59–65 CrossRef CAS.
- N. Phromviyo, P. Thongbai and S. Maensiri, Appl. Surf. Sci., 2018, 446, 236–242 CrossRef CAS.
- P. Kum-onsa, N. Chanlek, B. Putasaeng and P. Thongbai, Ceram. Int., 2020, 46, 17272–17279 CrossRef CAS.
| This journal is © The Royal Society of Chemistry 2020 |

