 Open Access Article
Needle-like CoO nanowire composites with NiO nanosheets on carbon cloth for hybrid flexible supercapacitors and overall water splitting electrodes†
Sa Li‡
ab,
Ruichao Feng‡ac,
Mai Li *a,
Xuan Zhaoa,
Beihe Zhanga,
Yuan Lianga,
Huanpo Ninga,
Jiale Wanga,
Chunrui Wang
 a and
Paul K. Chu
 d
d
aCollege of Science, Donghua University, Shanghai, 201620, People's Republic of China. E-mail: limai@dhu.edu.cn
bDepartment of Materials Processing and Control Engineering, University of Science and Technology Beijing, 30 Xueyuan Road, Haidian District, Beijing, 100083, People's Republic of China
cCollege of Mathematics and Physics, Shanghai University of Electric Power, Shanghai, 200090, People's Republic of China
dDepartment of Physics, Department of Materials Science and Engineering, Department of Biomedical Engineering, City University of Hong Kong, Tat Chee Avenue, Kowloon, Hong Kong, China
First published on 12th October 2020
Abstract
A nanoscale core–shell NiO@CoO composite is prepared on flexible carbon cloth for electrodes in supercapacitors and overall water splitting. The needle-like CoO nanowires with NiO nanosheets as the active materials improve the elemental constituents as well as surface area. The NiO@CoO electrode boasts a capacity of 2.87 F cm−2 (1024.05 F g−1) at 1 A g−1 current density, and even at a large current density of 20 A g−1 the retention ratio is 80.9% after 5000 cycles. The excellent specific capacity with high rate capability can be ascribed to the unique structure which increases the area of the liquid–solid interface and facilitates electron and ion transport, improving the utilization efficiency of active materials. The asymmetric hybrid supercapacitor prepared with the core–shell electrode shows the energy output of 40.3 W h kg−1 at 750 W kg−1 with a better retention (71.7%) of specific capacitance after 15![[thin space (1/6-em)]](https://www.rsc.org/images/entities/char_2009.gif) 000 cycles. In addition, linear sweep voltammetry is performed to assess the performance of the electrode in water splitting and the electrode shows excellent activity in the OER as manifested by a Tafel slope of 88.04 mV dec−1. Our results show that the bifunctional structure and design strategy have large potential in energy applications.
000 cycles. In addition, linear sweep voltammetry is performed to assess the performance of the electrode in water splitting and the electrode shows excellent activity in the OER as manifested by a Tafel slope of 88.04 mV dec−1. Our results show that the bifunctional structure and design strategy have large potential in energy applications.
1. Introduction
Owing to concerns of global climate change and depletion of fossil fuels, green and sustainable energy storage is playing a critical role in modern society. Supercapacitors1,2 are efficient energy storage devices which can bridge the energy power gap between traditional capacitors and lithium-ion batteries. Electrochemical supercapacitors have drawn extensive attention, and in fact, supercapacitors have wide application3 in electric vehicles, wind power generation, and micro power grids. Since the energy density of supercapacitors is less than that of lithium-ion batteries and the relatively high cost has hampered development and application, the pursuit of new electrode materials with higher energy densities, larger charging and discharging capacities, and shorter charge and discharge times is a common research goal.4–6Commercial carbon cloth (CC) with merits such as relatively low cost, mechanical flexibility, strength, chemical tolerance in acidic/alkaline environments, and environmental benignity is one of the preferred current collectors in electrodes in flexible supercapacitors. However, pristine carbon cloth is not attractive due to the small specific areal capacitance arising from the poor electrochemical activity and small surface area. As energy storage materials, transition metal oxides (TMOs) as active materials offer numerous benefits such as the high specific capacity, natural abundance, low cost and environmental friendliness and can be combined with carbon materials to take advantages of the merits of the two materials,7,8 especially for flexible, lightweight, and safe energy storage devices as well as portable and wearable electronics.9 For example, cobalt monoxide has excellent chemical stability and electrochemical capacitance and the theoretical specific capacitance up to 4000 F g−1. Liu et al. fabricated metal-coordinated polymer-derived CoO/C nanowires and the CoO/C electrode built a specific capacity of 187 F g−1 at the current density of 1 A g−1.10 However, the pseudocapacitive properties are not superior due to the low electrical conductivity and large volume variation during charging and discharging.11,12 To overcome the hurdles, besides designing special nanostructures such as nanowires,13,14 microspheres,15 nanoflowers,16 and other composites Co-based materials,17,18 for example, by constructing flexible free-standing films of needle-like CoO nanocrystals on CC to form flexible CoO/CC electrodes for supercapacitors.
To further improve the electrochemical properties of CoO/CC, development of nanostructures combining two types of pseudocapacitive materials is a viable strategy.19,20 Different dimensional architectures including 0D nanoparticles/nanosphere, 1D nanoneedles/nanowires, 2D nanosheets/nanoplates and multi-level architectures such as core–shells have been shown to enhance the specific surface area, expose more active sites, establish accessible pore channels, and facilitate electron and ion transfer.21–23 For instance, the ZnCo2O4@MnO2 core–shell structure was prepared hydrothermally by Ma et al. reported a high specific capacitance (1981 F g−1 at 5 A g−1). The main reason leads to a high stability is synergistic effects between MnO2 and ZnCo2O4.24 In addition, the better HER or OER performance indicate the better water splitting ability.25–27 Multiple material structures are been explored as: carbon-based structure;28 heterostructure29 and other advance structure.30,31 Fabrication of needle like CoO on CC can increase the area of surface and incorporation of NiO into the core–shell structure32 improves the ion diffusion rates and electrochemical characteristics. For example, chemical deposition is carried out in a bath to deposit uniform NiO on CoO with high conductivity and uniformity33–35 for supercapacitors and water splitting electrodes.36,37
In this work, 3D nanostructured NiO@CoO is produced on carbon cloth to form the NiO@CoO/CC as the flexible electrode with enhanced energy density and power density for supercapacitors as well as water splitting electrodes. CoO is prepared on CC hydrothermally and the needle-like CoO provides a larger surface area for the electrolyte. As a result, the capacity is much higher than those of CoO nanosheets/CC and nanowire-assembled CoO microspheres.38 The specific capacitances of NiO@CoO/CC are from 1024.05 to 688.10 F g−1 at different current densities (1 to 10 A g−1). The power density is maintained at 750 W kg−1 at 40.3 W h kg−1. The water splitting characteristics are also investigated. By conducting linear sweep voltammetry, the electrode is shown to be a suitable anode for water electrolysis. The bifunctional electrode which can withstand mechanical folding and twisting has large potential in flexible energy storage as well as energy generation devices.
2. Experimental methods
The Fig. 1 shows the process of synthesize NiO@CoO on CC: firstly, the clean carbon cloth is selected as substrate. The CoO skeleton is built through simple hydrothermal reaction, and then NiO is grown on this CoO nanostructure through chemical bath deposition. Finally, the NiO@CoO/CC sample is formed and ready for test evaluation.2.1 Synthesis of CoO/CC
CoO nanostructures with different morphologies are prepared on CC by a hydrothermal process. In brief, 19.21 mg of NH4F, 75.07 mg of urea and 7.76 mg of Co(NO3)2·6H2O are added in 50 mL of DI water. The solution transferred to 100 mL Teflon stainless autoclave and then a CC (1 cm2) is placed vertically in there. The sample is reacting in an electric furnace with a temperature of 120 °C and heated for 5 hours. The product is washed by ethanol and DI water each 3 times, then dried overnight at 80 °C, finally annealed in nitrogen for 2 h at 450 °C to produce CoO/CC.2.2 Synthesis of NiO@CoO/CC
To improve the electrochemical properties, NiO is deposited on the CoO skeleton nanostructure by a simple chemical bath deposition. In brief, 2 mL (25%) of aqueous ammonia are dissolved into 1 M nickel sulfate (5 mL) and then mixed with 0.25 M potassium persulfate (8 mL), into which the CoO/CC is dipped vertically for 10 minutes. The product is rinsed 3 times by DI water, dried 12 h at 80 °C and annealed at 450 °C under nitrogen for 2 h to form the flexible hierarchical three-dimensional nanostructured NiO@CoO/CC electrode.2.3 Characterization
The morphology and microstructure of CoO/CC, NiO/CC and NiO@CoO/CC are examined by scanning electron microscopy (SEM, JEOLJSM-7001F, Japan). The TEM images, SAED patterns, lattice images, and EDS maps are obtained by high-resolution transmission electron microscopy (TEM, Jeol JEM-2100F). The crystal structure is studied by X-ray diffraction (XRD, Rigaku, RINT2000, Japan) and the elemental composition is determined by X-ray photoelectron spectroscopy (XPS, Kratos AXIS Ultra DLD).2.4 Electrochemical measurements
An electrochemical working station is employed in the electrochemical measurement. The cyclic voltammetry (CV), and chronopotentiometry, durability test, with electrochemical impedance spectroscopy (EIS) are conducted. The specific capacitance (Cs) and areal capacitance specific capacitance are calculated from the CV curves. The energy (E) and the power (P) density are determined according as follows:
 | (1) |
 | (2) |
 | (3) |
 | (4) |
The water splitting ability is evaluated in 1.0 M KOH electrolyte at room temperature according to the hydrogen evolution with oxygen evolution reaction (HER and OER). The working electrode is the composite material, and the saturated calomel and glassy carbon electrode are the reference and counter electrodes, respectively. The potentials are determined by the equation as follows:39
| ERHE = ESCE + 0.0592 × pH + E0SCE (E0SCE = 0.2415). | (5) |
Linear sweep voltammetry (LSV) conducted at scan rate of 5 mV s−1 yielded polarization curves which eliminate the effects of the solution resistance by IR corrected. The overpotential (η) is calculated from the following equation: ηHER = −ERHE.
3. Results and discussion
3.1 Materials characterization
The morphology of NiO@CoO/CC is examined by SEM. The SEM image of CC is shown in Fig. S1.† CoO nanowires with a diameter of 50–100 nm are produced on the CC substrate (Fig. 2(a)) which provides a stable environment for the NiO nanosheets. Fig. 2(b) and (c) illustrates the NiO/CC structures: dense and uniform meshes increase the contact area between the active material and the electrolyte, thus enhancing the electrochemistry. As shown in Fig. 2(d)–(f), NiO is deposited uniformly on CoO which serves as the skeleton and the 3D porous heterostructure provides a mass of active sites for surface redox reactions to promote transfer of electrons and improve the electrochemical performance.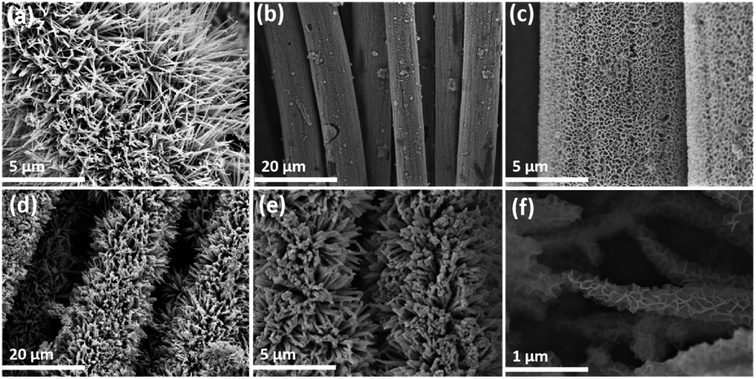 | ||
| Fig. 2 SEM images of CoO/CC, NiO/CC and NiO@CoO/CC: (a) CoO/CC; (b and c) NiO/CC; (d–f) NiO@CoO/CC at different magnifications. | ||
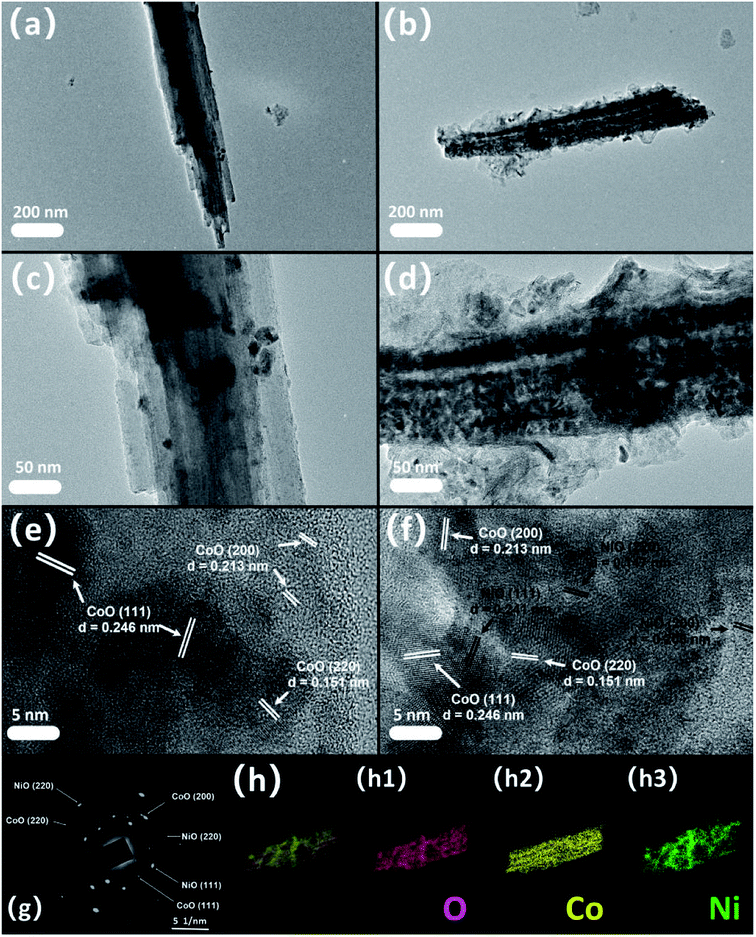
Fig. 3(a), (c) and (e) depict the TEM pictures of CoO and Fig. 3(b), (d) and (f) are the NiO@CoO images. Comparing Fig. 3(a) with Fig. 3(b), NiO thin layer is visible on the smooth surface of CoO and both NiO and CoO can be observed from Fig. 3(f). The SAED pattern (Fig. 3(g)) reveals both single crystals and polycrystals in NiO@CoO. A single crystal has a grain and complete crystal shape with periodic arrangement inside the grain. In comparison, a polycrystal has multiple grains and the lattice of each grain is arranged periodically. Owing to the arbitrary orientation of the grains, the diffraction image shows rings connected by multiple points. As shown in Fig. 3(b), NiO is fabricate on crystalline CoO which has the characteristics of a single crystal, whereas NiO has the characteristics of a polycrystal. Therefore, the location of diffraction spot usually corresponds to CoO, for example, the large spots at d = 0.246 nm, d = 0.223 nm and d = 0.151 nm corresponding to CoO (111), (200) and (220). The diffraction pattern of NiO shows rings next to CoO with d = 0.241 nm, d = 2.08 nm and d = 0.147 nm matching NiO (111), (200) and (220), indicating that the cubic crystal structures of NiO and CoO are similar. The elemental maps of NiO@CoO in Fig. 3(h) and the EDS spectrum in Fig. 4(f) reveal the presence of 3 elements. Co (18.6%) accounts for a larger proportion than Ni (10.8%) indicating that CoO is the main constituent.
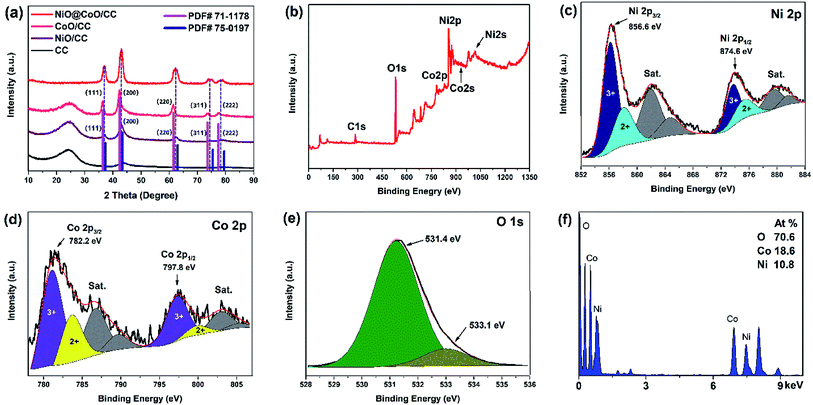 | ||
| Fig. 4 (a) XRD spectra of bare CC, CoO/CC, NiO/CC, and NiO/CoO/CC; (b)XPS survey spectrum of NiO@CoO/CC; XPS spectra of (c) Ni 2p; (d) Co 2p; (e) O 1s; (f) EDS spectrum. | ||
Fig. 4(a) displays an XRD pattern of the sample. The intensity of the peak at 24° decrease gradually owing to the NiO@CoO materials covered the CC substrate completely (as consistent with SEM image Fig. 2(e)) and that cause the C peak disappeared. The XRD patterns of CoO/CC and NiO/CC match the CoO (PDF# 71-1178) and NiO (PDF# 75-0197) database. The diffraction peaks correspond to the crystallographic plane of CoO and those NiO peaks are perfectly matched. The 2θ at peaks of NiO@CoO are at 36.8°, 42.9°, 62.4°, 74.5°, and 78.8°, which are between the corresponding peaks of CoO and NiO and each peak is formed by two peaks. One possible reason is that the crystal structure of CoO and NiO is similar as corroborated by TEM test.
The high-resolution spectrum in Fig. 4(c) shows the NiO with satellite peaks where Ni 2p3/2 peak at 856.6 eV and Ni 2p1/2 peak is 874.6 eV.40–42 The Co 2p high-resolution XPS spectrum is shown in Fig. 4(d). It reveals two main peaks at 782.2 and 797.8 eV with their satellite peaks (786.8 and 803.8 eV).43–45 As shown in Fig. 4(e), one main peak at 531.4 eV and a shoulder at 533.1 eV are consist to the O 1s spectrum.34 The main peak corresponds to O2− indicating the formation of CoO and NiO. The other peak can be attributed to physical adsorption of water molecules.21
3.2 Electrochemical characterization
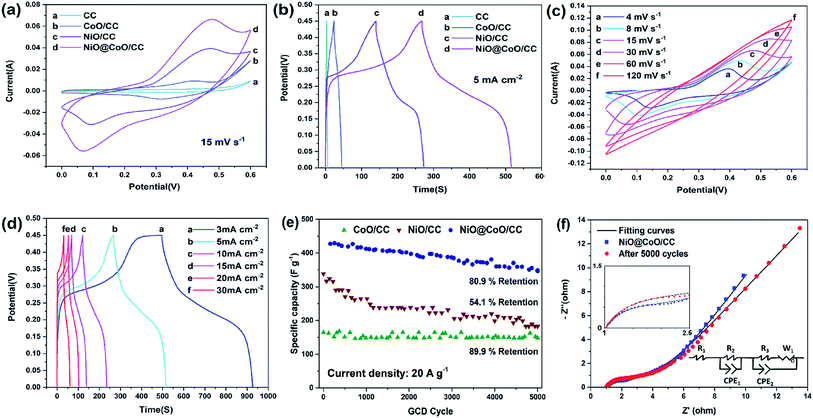
Fig. 5(c) displays the CV curves at various scan rates from NiO@CoO/CC. The peak current is increasing gradually when the scan rate rising (4 up to 120 mV s−1). While the rate is below 15 mV s−1, the redox peaks are apparent and in same shapes. In the meantime, the potential difference between the peaks keeps increasing and moves towards the anode and cathode, respectively. With the rising scan rates, the peak currents are proportional to the square root of the scanning rates, this means that the electrodes have well electrochemical properties. However, when the scan rate exceeds 30 mV s−1, and the CV area decreased bit by bit. The redox peaks disappear gradually because the scanning rates are too high for the materials to respond to the quick voltage change. The faradaic redox reactions of CoO and NiO charge storage can ascribe below:46
| 4CoO + 4OH− ↔ 2H2O + Co2O3 + 4e− | (6) |
| NiO + OH− ↔ NiOOH + e−. | (7) |
To investigate the NiO@CoO/CC electrode, the sample is calculated under different current densities (3 to 30 mA cm−2). According to eqn (1) and (2) above with Fig. 5(d), the area capacitances are 2.87 to 1.93 F cm−2 when the discharge current density is 3 to 30 mA cm−2, (the corresponding specific capacitances are 1024.05 to 688.10 F g−1), respectively. Even under large current, the specific capacitance of NiO@CoO/CC (428.6 F g−1 at 20 A g−1) is still larger than those of CoO/CC (164.7 F g−1 at 20 A g−1) or NiO/CC (338.3 F g−1 at 20 A g−1). The results show that NiO@CoO improves the electrochemical properties. Furthermore, the galvanostatic charging–discharging (GCD) curves in Fig. 5(d) show that the charging curves are almost symmetrical with the discharging counterparts and the discharge current is inversely proportional to the discharge time. The specific capacitances of NiO@CoO/CC are larger than those from the Co3O4@Ni(OH)2 NAs (912 F g−1 at the current density of 1 A g−1),47 and CoO/C electrode (187 F g−1 at a current density of 1 A g−1).10 The CV and GCD plots of other electrodes are shown in Fig. S2–S4† which demonstrate the excellent properties of our electrode.
Long-term test is to evaluate the stability of the electrodes as shown in Fig. 5(e). NiO/CC exhibits significant and prolonged irreversible capacity loss (54.1% capacitance drop) which can be explained by the NiO reaction.22 When the initial loop occurs, NiO begins to transform into metallic nickel with smaller dimensions. The transition improves the electrochemical activity and as grains divide, electrolyte decomposition is enhanced leading to the solid electrolyte interphase formation. The capacitances of CoO/CC and NiO@CoO/CC are stable showing retention of 89.9% and 80.9% after 5000 cycles where current density at 50 mA cm−2, respectively. NiO@CoO/CC shows 80.9% capacitance retention after the long-term test in which some transformation and reconstruction may reduce the capacity. Compared to NiO/CC, the heterogeneous structure of NiO@CoO inhibits decomposition of NiO and loss of active substances during long-time cycling as shown in Fig. S5:† there are some NiO@CoO structure reduce after cycling in the SEM picture Fig. S5(a);† and the Fig. S5(b) and (c)† is different with the origin SEM picture (Fig. 2(d)–(f)). It proves some transformation and reconstruction happened and some heterogeneous remodeling and deposition might cause the capacity decrease after cycling.
EIS is performed to elucidate the mechanism. The Nyquist plots of NiO@CoO/CC before and after 5000 GCD cycles and the and fitting parameters corresponding equivalent circuits are presented in Fig. 5(f). The impedance spectra include one sloping line at low frequencies and a semicircle at high frequencies. The spectra at low frequencies are dominated by connections and electron conduction between the substrate and active materials as well as ion conduction through the electrolyte. In this model circuit, the pure resistive behavior simulated by resistor R1, and the constant phase-angle element (CPE1) in parallel with resistor R2 system are used to simulate the solid electrolyte interface (SEI) layer associate to the semicircle at high frequencies. The charge transfer and the diffusion of OH− lead to impedance. The charge transfer behavior is simulated by CPE2 in parallel with resistor R3, with the Warburg impedance (W1) is employed to simulate the diffusion of OH− behavior. The solution resistance is 1 ohm which can be read at the intercept of the real axis, and the scale of semicircle is proportional to the resistance, meaning that the diffusive resistance after cycling is larger than that of the original electrode. The parameters of the equivalent circuits are listed in Table S1.† The contact resistance R1 after 5000 cycles is 1.030 ohm which is basically the same as that of the initial sample (1.025 ohm). Moreover, R2 value which associated with the SEI layer is 31.35 ohm, while after cycling that number is up to 148.9 ohm. The R3 value in after test sample (1.738 ohm) is larger than the initial ones (0.671 ohm). This can be ascribed to the gradually destruction of NiO@CoO/CC nickel coating and structure, and lead to more difficulty of OH− diffusion or recombination of the nanostructure with adsorbed/desorbed ions. Some active materials decrease after 5000 cycles making the specific capacitance decline gradually.
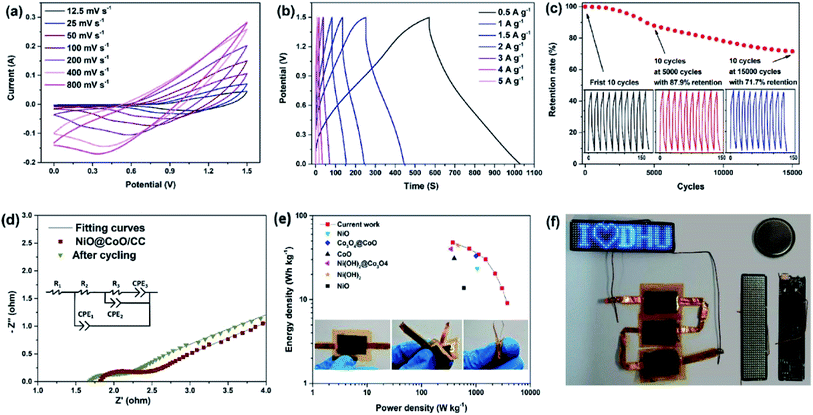
The energy density is proportional to the square of voltage and so a larger operating voltage can enhance the energy density of supercapacitors. An asymmetric hybrid supercapacitor is constructed with the positive electrode and negative electrode being NiO@CoO/CC and activated carbon, respectively and the voltage is raised to 1.5 V. According to Fig. 6(a), scanning rates are varied from 12.5 to 800 mV s−1 to investigate the process. In the low voltage range (0–0.6 V), as the scan rates go up, the CV curve shows a larger peak and CV area, but in the high voltage range (0.9–1.5 V), the CV area reaches a peak at a scanning rate of 200 mV s−1 and then decreases gradually with increasing scanning rates probably due to the incomplete active substance reaction as a result of the large scanning rates and voltages. The long-term GCD performance shown in Fig. 6(c) shows 87.9% specific capacitance retention after 5000 cycles and 71.7% retention after 15![[thin space (1/6-em)]](https://www.rsc.org/images/entities/char_2009.gif) 000 cycles. EIS is carried out to dig out the reason of significant capacity change in the cycling test. The Nyquist curves of the origin device and after long-term cycles, together with the equivalent circuit are displayed in Fig. 6(d) and the fitting parameter values are given in Table S2.† According to the fitting parameters, the sample after cycling has an R2 value of 0.227 ohm that is bigger than the initial one of 0.193 ohm. This may be caused by the active substances participate more in the redox reactions before cycling, that reduce the contact resistance. The R3 values are 0.01 ohm and 0.29 ohm before and after long-term cycling, respectively, with lower parameters of CPE2 than that after cycling. The change in electrochemical performance may be due to more contact with the electrolyte as the substrate maintains more active materials in the initial case.
000 cycles. EIS is carried out to dig out the reason of significant capacity change in the cycling test. The Nyquist curves of the origin device and after long-term cycles, together with the equivalent circuit are displayed in Fig. 6(d) and the fitting parameter values are given in Table S2.† According to the fitting parameters, the sample after cycling has an R2 value of 0.227 ohm that is bigger than the initial one of 0.193 ohm. This may be caused by the active substances participate more in the redox reactions before cycling, that reduce the contact resistance. The R3 values are 0.01 ohm and 0.29 ohm before and after long-term cycling, respectively, with lower parameters of CPE2 than that after cycling. The change in electrochemical performance may be due to more contact with the electrolyte as the substrate maintains more active materials in the initial case.
According to eqn (4) and (5), the energy and power densities of the NiO@CoO/CC are calculated and shown in Fig. 6(e). Furthermore, several archival samples of Co-based and Ni-based materials are shown in Fig. 6(e) and Table S2† for comparison. The sample delivers a maximum energy density is 47.9 W h kg−1 with the power density of 375 W kg−1, and even at 3000 W kg−1 the device still shows an energy density of 13.7 W h kg−1. Our electrode is better than most previously reported ones such as CoMoO4@NiMoO4/Ni foam (267 W kg−1 at 28.7 W h kg−1),48 and Co3O4@NiMoO4 (482 W kg−1 at 25.3 W h kg−1),49 and other samples shown in Fig. 6(e),23,50–54 but cannot comparable to CoMoO4@Co3O4/carbon nanotubes (6400 W kg−1 at 37.0 W h kg−1),55 CoMoO4@Co3O4/OMEP (1647.5 W kg−1 at 45.98 W h kg−1)56 and CoMoO4@NiMoO4/Fe2O3 (12![[thin space (1/6-em)]](https://www.rsc.org/images/entities/char_2009.gif) 000 W kg−1 at 26.7 W h kg−1).57 More information about the performance of the supercapacitors are provided in Table S3.† This excellent assembly performance of ASC can be ascribed to uniform the surface nanostructure on the CC matrix on the side wall thereby avoiding the aggregation of active materials, improving the transport efficiency between ionic electrolytes and nanomaterials, increasing the retention of after cycling, and providing great energy and power density. Three photos in the bottom of Fig. 6(e) express the ASC can tolerate the large deformation and stable enough for daily applications.
000 W kg−1 at 26.7 W h kg−1).57 More information about the performance of the supercapacitors are provided in Table S3.† This excellent assembly performance of ASC can be ascribed to uniform the surface nanostructure on the CC matrix on the side wall thereby avoiding the aggregation of active materials, improving the transport efficiency between ionic electrolytes and nanomaterials, increasing the retention of after cycling, and providing great energy and power density. Three photos in the bottom of Fig. 6(e) express the ASC can tolerate the large deformation and stable enough for daily applications.
Fig. 6(f) gives the parallel arrangement three assembled flexible ASCs, which after charging a high current for 10 s, can support one programmable LED arrays lighting efficiently. The LED device whose front and back are made up of 11 × 44 small LEDs, a programmable chip designed by a computer with a functional circuit. All the tests in Fig. 6(a)–(e) are carried out with the encapsulated button cell as shown in the upper right corner of Fig. 6(f). The results illustrate that ASCs device has wide commercial potential in future energy storage systems due to its high-performance supercapacitive characteristics.
| Material | Electrolyte | HER slope (mV dec−1) | Overpotential at 10 mA cm−2 (mV) | OER Tafel slope (mV dec−1) | Ref. |
|---|---|---|---|---|---|
| CoO/CC | 1.0 M KOH | 214.47 | 262.6 | 151.11 | This work |
| NiO/CC | 1.0 M KOH | 153.10 | 321.9 | 146.88 | This work |
| NiO@CoO/CC | 1.0 M KOH | 173.44 | 149.0 | 88.04 | This work |
| CoNi2S4/Ni | 1.0 M KOH | 129.0 | 54 | 124.6 | 26 |
| NiCo2S4/Ni | 1.0 M KOH | 141 | 260 | 89 | 26 |
| NiFeS/Ni | 1.0 M KOH | 53 | 180 | 55 | 26 |
| CuCo2S4 | 1.0 M KOH | 42 | 65 | 49 | 26 |
| CoMoS4 | 1.0 M KOH | 105 | 143 | — | 26 |
| PE-z-Co3O4 | 1.0 M KOH | — | — | 61.4 | 27 |
| NiO | 1.0 M KOH | 105 | 424 | 156 | 36 |
| NiCo2O4 | 1.0 M KOH | 49.7 | 110 | 53 | 37 |
| NiO@Ni/WS2/CC | 1.0 M KOH | 83.1 | 40 | 108.9 | 61 |
| WS2/CC | 1.0 M KOH | 234.9 | 183 | — | 61 |
| NiO@Ni/CC | 1.0 M KOH | 136.4 | 167 | 225.2 | 61 |
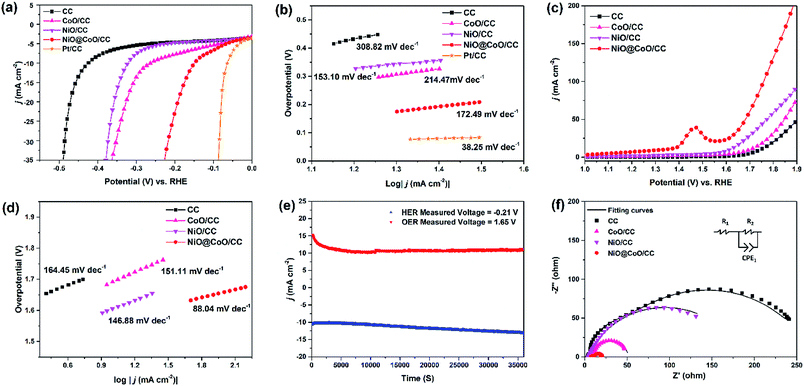
To figure out the stability of NiO@CoO/CC in an alkaline electrolyte, a test under 10 mA cm−2 environment is performed for 36![[thin space (1/6-em)]](https://www.rsc.org/images/entities/char_2009.gif) 000 s when the water splitting voltage is observed to be stable. In 1 M KOH, the steady-state Tafel measurements of HER and OER are performed in Fig. 7(e). As shown in Fig. 7(f), NiO@CoO/CC exhibits the smallest Nyquist semicircle diameter compare to NiO/CC or CoO/CC. Consequently, the charge transport efficiency and H2O adsorption are promoted. The important parameters of the electrodes are listed in Table S4.†
000 s when the water splitting voltage is observed to be stable. In 1 M KOH, the steady-state Tafel measurements of HER and OER are performed in Fig. 7(e). As shown in Fig. 7(f), NiO@CoO/CC exhibits the smallest Nyquist semicircle diameter compare to NiO/CC or CoO/CC. Consequently, the charge transport efficiency and H2O adsorption are promoted. The important parameters of the electrodes are listed in Table S4.†
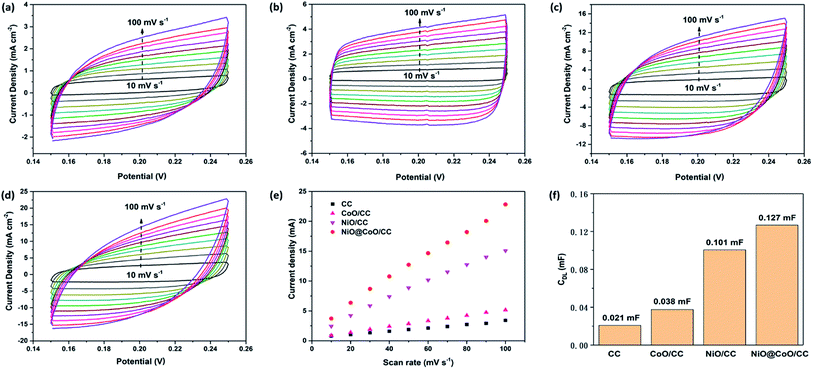
The electrochemically active surface area (ECSA) is an important indicator of water splitting activity. For each system, ECSA is estimated from the catalytic surface non-faradaic capacitive which is commonly measured associate with double-layer from the scan rates dependence of CV plots. The charging currents (i) are then calculated from CV curves in Fig. 8(a)–(d). The charging current (i), is equal to the product of scan rate (v) and the electrochemical double-layer capacitance (CDL), as given by eqn (8).62
| i = v(CDL) | (8) |
Thus, the electrochemical double-layer capacitances of four samples are calculated according to the slopes of curves in Fig. 8(e), and the results are shown in Fig. 8(f): 0.021 mF (CC); 0.038 mF (CoO/CC); 0.101 mF (NiO/CC) and 0.127 mF (NiO@CoO/CC). Under identical electrolyte conditions, the ECSAs of multiple materials are calculated by eqn (9). And the CS represents the capacitance of an atomically smooth planar surface of the material per unit area under identical electrolyte conditions:
| ECSA = CDL/CS | (9) |
CS was assumed to be 40 μF cm−2 for metal oxides as proposed in literature. After comparison, the ESCA of NiO@CoO (3.175 cm2) is much larger than that of CoO sample (0.95 cm2), and 20% larger than the area of NiO sample (2.53 cm2).
4. Conclusion
A two-step synthesis is designed to prepare 3D nanostructured core–shell NiO@CoO composite on carbon cloth flexible as supercapacitor electrodes. The NiO@CoO/CC electrode has a high specific capacitance of 1024.05 F g−1 when current is 1 A g−1 and manages to overcome the NiO retention problem (retention increase from 54.1% to 80.9%). Consequently, this supercapacitor shows a good energy output about 40.3 W h kg−1 with 750 W kg−1 and good stability after 5000 GCD cycles with 87.9% retention, which can meet demand for practical energy storage. Furthermore, the ability of the composite electrode is water splitting is evaluated by LSV. NiO@CoO/CC has a better ability in the water splitting with an OER Tafel slope of 88.04 mV dec−1. The materials can be used as an anode and this bifunctional electrode has large potential in high-performance and large-scale storage of energy and water splitting applications.Conflicts of interest
There are no conflicts to declare.Acknowledgements
This research was financially supported by the Fundamental Research Funds for the Central Universities (2232019D3-41, 2232018D3-24), Shanghai Innovation and Entrepreneurship Project (109-03-0178169), National Natural Science Foundation of China (11704065, 21703031), Shanghai Natural Science Foundation (20ZR1401700) and City University of Hong Kong Strategic Research Grant (SRG) No. 7005105.References
- H. Li and J. Liang, Adv. Mater., 2020, 32, 1805864 CrossRef CAS.
- Y. Ouyang, R. Huang, X. Xia, H. Ye, X. Jiao, L. Wang, W. Lei and Q. Hao, Chem. Eng. J., 2019, 355, 416–427 CrossRef CAS.
- E. Frackowiak, Phys. Chem. Chem. Phys., 2007, 9, 1774–1785 RSC.
- W. Du, X. Wang, J. Zhan, X. Sun, L. Kang, F. Jiang, X. Zhang, Q. Shao, M. Dong and H. Liu, Electrochim. Acta, 2019, 296, 907–915 CrossRef CAS.
- C. S. Choi, D. S. Ashby, D. M. Butts, R. H. Deblock, Q. Wei, J. Lau and B. S. Dunn, Nat. Rev. Mater., 2020, 5, 5–19 CrossRef.
- C. Jing, X. Guo, L. Xia, Y. Chen, X. Wang, X. Liu, B. Dong, F. Dong, S. Li and Y. Zhang, Chem. Eng. J., 2020, 9, 122305 CrossRef.
- L. Li, J. Gao, V. Cecen, J. Fan, P. Shi, Q. Xu and Y. Min, ACS Omega, 2020, 5, 4657–4667 CrossRef CAS.
- L. Wan, D. Chen, J. Liu, Y. Zhang, J. Chen, M. Xie and C. Du, J. Power Sources, 2020, 465, 228293 CrossRef CAS.
- Q. Gong, Y. Li, X. Liu, Z. Xia and Y. Yang, Carbohydr. Polym., 2020, 245, 116611 CrossRef CAS.
- M. Liu, F. Cui, Q. Ma, L. Xu, J. Zhang, Z. Chai, Y. Chen, R. Zhang and T. Cui, Mater. Lett., 2020, 267, 127524 CrossRef CAS.
- X. Zhou, Y. Zhong, M. Yang, Q. Zhang, J. Wei and Z. Zhou, ACS Appl. Mater. Interfaces, 2015, 7, 12022–12029 CrossRef CAS.
- D. Li, L. Ding, S. Wang, D. Cai and H. Wang, J. Mater. Chem. A, 2014, 2, 5625–5630 RSC.
- K. Cao, L. Jiao, Y. Liu, H. Liu, Y. Wang and H. Yuan, Adv. Funct. Mater., 2015, 25, 1082–1089 CrossRef CAS.
- P. G. Schiavi, L. Farina, P. Altimari, M. A. Navarra, R. Zanoni, S. Panero and F. Pagnanelli, Electrochim. Acta, 2018, 290, 347–355 CrossRef CAS.
- W. Zhang, S. Mao, J. Xu, Q. Xu, M. Zhang, J. Zhou, L. Song, R. Guan and L. Yue, Electrochim. Acta, 2018, 291, 206–215 CrossRef CAS.
- L. Chang, K. Wang, L. Huang, Z. He, S. Zhu, M. Chen, H. Shao and J. Wang, J. Mater. Chem. A, 2017, 5, 20892–20902 RSC.
- F. Wu, S. Zhang, B. Xi, Z. Feng, D. Sun, X. Ma, J. Zhang, J. Feng and S. Xiong, Adv. Energy Mater., 2018, 8, 1703241–1703242 CrossRef.
- S. Huang, L. Yang, M. Gao, Q. Zhang, G. Xu, X. Liu, J. Cao and X. Wei, J. Power Sources, 2019, 437, 226934 CrossRef CAS.
- H. Xuan, Y. Guan, X. Han, X. Liang, Z. Xie, P. Han and Y. Wu, Electrochim. Acta, 2020, 335, 135691 CrossRef CAS.
- X. Peng, Y. Yan, X. Jin, C. Huang, W. Jin, B. Gao and P. K. Chu, Nano Energy, 2020, 78, 105234 CrossRef CAS.
- M. Pang, G. Long, S. Jiang, Y. Ji, W. Han, B. Wang, X. Liu, Y. Xi, D. Wang and F. Xu, Chem. Eng. J., 2015, 280, 377–384 CrossRef CAS.
- S. A. Needham, G. Wang and H. Liu, J. Power Sources, 2006, 159, 254–257 CrossRef CAS.
- C. Guan, Y. Wang, Y. Hu, J. Liu, K. H. Ho, W. Zhao, Z. Fan, Z. Shen, H. Zhang and J. Wang, J. Mater. Chem. A, 2015, 3, 23283–23288 RSC.
- W. Ma, H. Nan, Z. Gu, B. Geng and X. Zhang, J. Mater. Chem. A, 2015, 3, 5442–5448 RSC.
- P. Prabhu, V. Jose and J.-M. Lee, Matter, 2020, 2, 526–553 CrossRef.
- G. Fu and J.-M. Lee, J. Mater. Chem. A, 2019, 7, 9386–9405 RSC.
- S.-H. Hsu, S.-F. Hung, H.-Y. Wang, F.-X. Xiao, L. Zhang, H. Yang, H. M. Chen, J.-M. Lee and B. Liu, Small Methods, 2018, 2, 1800001 CrossRef.
- G. Fu, Y. Tang and J.-M. Lee, ChemElectroChem, 2018, 5, 1424–1434 CrossRef CAS.
- H. Wang and J.-M. Lee, J. Mater. Chem. A, 2020, 8, 10604–10624 RSC.
- P. Prabhu, V. Jose and J.-M. Lee, Adv. Funct. Mater., 2020, 30, 1910768 CrossRef CAS.
- G. Fu, Y. Wang, Y. Tang, K. Zhou, J. B. Goodenough and J.-M. Lee, ACS Mater. Lett., 2019, 1, 123–131 CrossRef CAS.
- N. Tang, W. Wang, H. You, Z. Zhai, J. Hilario, L. Zeng and L. Zhang, Catal. Today, 2019, 330, 240–245 CrossRef CAS.
- H. Wang, C. Qing, J. Guo, A. A. Aref, D. Sun, B. Wang and Y. Tang, J. Mater. Chem. A, 2014, 2, 11776–11783 RSC.
- Y. Wang, T. Zhu, Y. Zhang, X. Kong, S. Liang, G. Cao and A. Pan, J. Mater. Chem. A, 2017, 5, 18448–18456 RSC.
- H. Yan, D. Zhang, J. Xu, Y. Lu, Y. Liu, K. Qiu, Y. Zhang and Y. Luo, Nanoscale Res. Lett., 2014, 9, 424 CrossRef.
- A. Mondal, A. Paul, D. N. Srivastava and A. B. Panda, Int. J. Hydrogen Energy, 2018, 43, 21665–21674 CrossRef CAS.
- X. Gao, H. Zhang, Q. Li, X. Yu, Z. Hong, X. Zhang, C. Liang and Z. Lin, Angew. Chem., Int. Ed., 2016, 55, 6290–6294 CrossRef CAS.
- D. L. Ji, J. Li, L. Chen, D. Zhang, T. Liu, N. Zhang, R. Ma, G. Qiu and X. Liu, RSC Adv., 2015, 5, 41627–41630 RSC.
- X. Peng, A. M. Qasim, W. Jin, L. Wang, L. Hu, Y. Miao, W. Li, Y. Li, Z. Liu and K. Huo, Nano Energy, 2018, 53, 66–73 CrossRef CAS.
- M. Li, S. Li, J. Wang, C. Wang, W. Li and P. K. Chu, Nanotechnology, 2019, 30, 485402 CrossRef CAS.
- M. A. Peck and M. A. Langell, Chem. Mater., 2012, 24, 4483–4490 CrossRef CAS.
- B. Varghese, M. V. Reddy, Z. Yanwu, C. S. Lit, T. C. Hoong, G. V. S. Rao, B. V. R. Chowdari, A. T. S. Wee, C. T. Lim and C. H. Sow, Chem. Mater., 2008, 20, 3360–3367 CrossRef CAS.
- D. Yuan, Y. Dou, L. Xu, L. Yu, N. Cheng, Q. Xia, L. Hencz, J. Ma, S. X. Dou and S. Zhang, J. Mater. Chem. A, 2020, 8, 13443–13451 RSC.
- S. C. Petitto, E. M. Marsh, G. A. Carson and M. A. Langell, J. Mol. Catal. A-Chem., 2008, 281, 49–58 CrossRef CAS.
- H. Liu, G. Wei, Z. Xu, P. Liu and Y. Li, Appl. Surf. Sci., 2016, 389, 438–446 CrossRef CAS.
- J. Lang, L. Kong, W. Wu, Y. Luo and L. Kang, Chem. Commun., 2008, 35, 4213–4215 RSC.
- X. Zhang, J. Xiao, X. Zhang, Y. Meng and D. Xiao, Electrochim. Acta, 2016, 191, 758–766 CrossRef CAS.
- Z. Zhang, H. Zhang, X. Zhang, D. Yu, Y. Ji, Q. Sun, Y. Wang and X. Liu, J. Mater. Chem. A, 2016, 4, 18578–18584 RSC.
- W. Hong, J. Wang, P. Gong, J. Sun, L. Niu, Z. Yang, Z. Wang and S. Yang, J. Power Sources, 2014, 270, 516–525 CrossRef CAS.
- S. Dai, Y. Yuan, J. Yu, J. Tang, J. Zhou and W. Tang, Nanoscale, 2018, 10, 15454–15461 RSC.
- N. Zhang, X. Yan, J. Li, J. Ma and D. H. L. Ng, Electrochim. Acta, 2017, 226, 132–139 CrossRef CAS.
- X. Bai, Q. Liu, J. Liu, H. Zhang, Z. Li, X. Jing, P. Liu, J. Wang and R. Li, Chem. Eng. J., 2017, 315, 35–45 CrossRef CAS.
- C. Zhang, Q. Chen and H. Zhan, ACS Appl. Mater. Interfaces, 2016, 8, 22977–22987 CrossRef CAS.
- K. K. Purushothaman, I. M. Babu, B. Sethuraman and G. Muralidharan, ACS Appl. Mater. Interfaces, 2013, 5, 10767–10773 CrossRef CAS.
- J. Wang, X. Zhang, Q. Wei, H. Lv, Y. Tian, Z. Tong, X. Liu, J. Hao, H. Qu, J. Zhao, Y. Li and L. Mai, Nano Energy, 2016, 19, 222–233 CrossRef CAS.
- M. Li, Y. Wang, H. Yang and P. K. Chu, J. Mater. Chem. A, 2017, 5, 17312–17324 RSC.
- J. Wang, L. Zhang, X. Liu, X. Zhang, Y. Tian, X. Liu, J. Zhao and Y. Li, Sci. Rep., 2017, 7, 41088 CrossRef CAS.
- Y. Zhao, X. Jia, G. Chen, L. Shang, G. I. N. Waterhouse, L. Wu, C. Tung, D. Ohare and T. Zhang, J. Am. Chem. Soc., 2016, 138, 6517–6524 CrossRef CAS.
- F. Yu, H. Zhou, Y. Huang, J. Sun, F. Qin, J. Bao, W. A. Goddard, S. Chen and Z. Ren, Nat. Commun., 2018, 9, 2551 CrossRef.
- X. Liu, M. Park, M. G. Kim, S. Gupta, G. Wu and J. Cho, Angew. Chem., 2015, 54, 9654–9658 CrossRef CAS.
- D. Wang, Q. Li, C. Han, Z. Xing and X. Yang, ACS Cent. Sci., 2018, 4, 112–119 CrossRef CAS.
- C. C. L. Mccrory, S. Jung, J. C. Peters and T. F. Jaramillo, J. Am. Chem. Soc., 2013, 135, 16977–16987 CrossRef CAS.
Footnotes |
| † Electronic supplementary information (ESI) available. See DOI: 10.1039/d0ra07307e |
| ‡ These authors contributed equally to this work. |
| This journal is © The Royal Society of Chemistry 2020 |


