 Open Access Article
MRI contrast enhancement of liver pre-neoplasia using iron–tannic nanoparticles†
Thipjutha Phatruengdeta,
Jannarong Intakhada,
Monreudee Tapunyaa,
Arpamas Chariyakornkulbc,
Chi Be Hlaingb,
Rawiwan Wongpoomchaibc and
Chalermchai Pilapong *ad
*ad
aCenter of Excellence for Molecular Imaging (CEMI), Department of Radiologic Technology, Faculty of Associated Medical Sciences, Chiang Mai University, Chiang Mai 50200, Thailand. E-mail: chalermchai.pilapong@cmu.ac.th
bDepartment of Biochemistry, Faculty of Medicine, Chiang Mai University, Chiang Mai, 50200, Thailand
cFunctional Food Research Unit, Science and Technology Research Institute, Chiang Mai University, Chiang Mai, 50200, Thailand
dMaterials Science Research Center, Faculty of Science, Chiang Mai University, Chiang Mai, 50200, Thailand
First published on 24th September 2020
Abstract
The most challenging part of liver cancer detection is finding it in the very early stages. It has been argued that liver preneoplasia is found at the very earliest stages of liver cancer. The presence of a lesion is closely related to the development of HCC. We report herein a new class of iron-based T1 MRI contrast agents which are nanoparticles of iron–tannic complexes (so-called Fe–TA NPs) that can be used for detecting liver preneoplasia. Preliminary assessment of their toxicity in healthy rats provides suitable imaging dose ranges with acceptable toxicity. In diethylnitrosamine (DEN) induced rats, it is shown that Fe–TA NPs are capable of enhancing MRI signals in rat livers having pre-neoplastic lesions within 60 minutes post-injection. The enhancement efficacy is strongly dependent on the characteristics of pre-neoplastic foci (GST-P+ foci). The highest enhancement was in good correlation with the size of GST-P+ foci and amount of Fe–TA NPs accumulated in the liver, and might be caused by the dysfunction of liver sinusoids along with cellular uptake capability of pre-neoplastic hepatocytes. Our results show that Fe–TA NPs are of great interest to develop as an efficient MRI imaging agent for risk assessment of liver cancer.
Introduction
Liver cancer is one of the most important challenges of global health, especially in developing countries such as in Asia where most of the burden of this disease is borne.1 Due to the fact that early stage liver cancer does not show any signs and symptoms, the majority of cases of liver cancer are diagnosed at advanced stages of the disease, making it too late for treatment.2,3 It is well known that early detection is the key to successful treatment of liver cancer and improves survival rates,3 therefore it is critically important to develop a diagnostic platform for detecting liver cancer as early as possible. Imaging diagnosis with magnetic resonance imaging (MRI), one of the current means of liver cancer diagnosis, provides high spatial resolution of soft tissue images in three-dimensions without using ionizing radiation.4 Although the current guidelines for diagnosing liver cancer are very advanced, the mortality rate of patients is still high.5 Currently, very early diagnosis of liver cancer with MRI cannot be easily performed due to the limitations of the measurement. Even though various imaging agents have been developed for imaging implication in different stages of liver cancer, there has been no clinically available MRI agent for very early stage liver cancer.6,7 It is accepted that the presence of preneoplastic lesions at early stage of hepatocarcinogenesis is closely related to the development of HCC later on.8 There should be great interest in improving imaging techniques to detect liver preneoplasia. Moreover, because there is a long period before the development of liver cancer, imaging liver preneoplasia provides increased opportunities for interventions that prevent the progression of the disease. Therefore, development of MRI agent for hepatic preneoplasia is a promising approach for early detection of liver cancer.At present, Gadolinium (Gd3+) based contrast agents are mainly used in MRI scans performed in clinics.9 However, free Gd3+ ions are very toxic to both patient and the environment.10,11 Iron (Fe3+) complex can be also used as a contrast agent instead of Gd3+ because Fe3+ is also a paramagnetic material having less toxicity.12–14 The iron–tannic nanoparticles (Fe–TA NPs), which have been produced by the interaction of Fe3+ and tannic acid (TA), have shown beneficial properties. Examples of their beneficial properties are that they have small size, high MRI relaxivity, high stability, good water solubility, and demonstrate high uptake efficiency in tumor cells with capability of being responsive to abnormal microenvironments.15,16 Because of their good physico-chemical properties along with their ease of scale-up reproducibility, Fe–TA NPs could offer great feasibility as a low-cost clinical MRI contrast agent with many advantageous characteristics for use in liver cancer diagnosis. In this research, we aimed to investigate the feasibility of using iron–tannic nanoparticles to enhance MRI contrast of rat liver with preneoplastic lesions. Hopefully, our findings provide approaches for non-invasive and early screening of liver cancer along with the development of a clinically or commercially translatable MRI agent in the near future.
Methods
Fe–TA NPs synthesis
Fe–TA NPs were synthesized according to our previous work with some modifications.16 In brief, 10 mmol of tannic acid and 30 of mmol of FeCl3·6H2O were added to 300 ml of phosphate-buffered saline (PBS). The Fe–TA NPs were suddenly obtained, appeared as red-wine color. The obtained Fe–TA NPs were heated at 90 °C in order to concentrate the Fe–TA NPs and further purified by dialysis method. Then, the Fe–TA NPs were filtered through cellulose acetate membrane filters (pore size = 0.22 μm) for sterilization. The Fe–TA NPs were subjected to quantification and characterization and stored at 4 °C for further experiments. Calculation of the concentration of the Fe–TA NPs is shown in ESI.†Animal preparation
Male Wistar rats were purchased from Nomura Siam International Co., Ltd. Bangkok, Thailand. All rats were kept in stainless steel cages of the Animal House, Faculty of Medicine, Chiang Mai University, Chiang Mai, Thailand. They were housed and acclimated under a 12 hour light/dark cycle at 21–25 °C and relative humidity set at 50–60% throughout the study. All animals were free access to food and water. The animal used protocols were approved by the Animal Ethics Committee of Faculty of Medicine, Chiang Mai University, Thailand (Protocol Number: 09/2562).Acute toxicity of Fe–TA NPs
To determine possible toxicity and optimal imaging dose of Fe–TA NPs in rats, 8 week-old female rats were intravenously injected with 17.5 mg kg−1 b.w. (n = 3), 27.5 mg kg−1 b.w. (n = 3), and 55 mg kg−1 b.w. of Fe–TA NPs (n = 5). After injection, all rats were regularly monitored for 14 days in order to observe any symptoms and death for LD50 estimation. In addition, their weights were recorded before and after injection of Fe–TA NPs. At the end of the study period, the rats were sacrificed, the blood was collected for complete blood count analysis, and vital organs including lung, heart, thymus, liver, pancreas, kidneys, spleen, adrenal glands, ovary, and brain were collected to find any organ abnormality.DEN induced liver pre-neoplasia model and MRI examination
Six-week-old rats were divided into 2 groups. In the DEN-induced group (n = 3), DEN (Sigma) at 100 mg kg−1 b.w. was intraperitoneally injected once a week for 3 weeks. In the control group (n = 2), 5 ml kg−1 b.w. of 0.9% NaCl was injected with instead of DEN. After 2 weeks of the last injection (week 5), rats were subjected to partial hepatectomy for removal of median and left lateral lobes of the liver. At week 16 of the experiment, all rats were anaesthetized using a 40 mg kg−1 b.w. of thiopental via intraperitoneal injection and were whole body scanned by an MRI scan (Philips Ingenia 1.5 T MRI scanner) which was performed in both axial (ax) and coronal (cor) plane before and after intravenous injection of 11 mg kg−1 b.w. Fe–TA NPs using T1-weighted imaging. The MRI parameters were used as followed: repetition time, 400 ms; echo time, 8 ms; scan time, 14 minutes; field of view, 200 mm; and slice thickness and gap, 1.5/0.2 mm. At the end of the experiment, all rats were sacrificed by overdose of thiopental injection and their livers were cut and fixed in 10% formalin for further immunohistochemical examinations.For MRI image analysis, signal intensity (SI) was measured by drawing a region of interest (ROI) on 80% area of liver in each slide of the image using Philips DICOM Viewer R3.0 software, these were then compared to those drawn on muscle of each plane. Percentage of MRI signal enhancement (% enhancement) was calculated by the following equation listed below:
After MRI examination, all rats were sacrificed, the liver was collected, weighed, and was subjected to further analysis such as accumulation of Fe–TA NPs and histology analysis.
Fe–TA NPs content analysis in liver
For quantitative accumulation of Fe–TA NPs analysis, quantity of liver was homogenized in a mixture of pure nitric (≥69%) (RCI Labscan) and hydrochloric acid (≥37%) (RCI Labscan) for 24 hours at room temperature. The homogenate was centrifuged at 10000g for 10 minutes. The supernatant was collected and was further diluted in 2% mixed acid solution. The solution was subjected to ICP-OES analysis for iron content determination according to standard protocol.Liver histology analysis
Formalin-fixed and paraffin-embedded (FFPE) tissues were used for our tissue analysis. Various experiments were carried out and described as follows:Results and discussion
The Fe–TA NPs were easily obtained by simple mixing of PBS solution of tannic acid and ferric chloride. In such conditions, iron-mediated self-assembly of iron–tannic complexes occurs. It is important to note that pH of mixing solution is critical for the self-assembly process and the coordination state of the complexes. Reaction proceeded in solution without controlling pH, and different physico-chemical properties were then obtained. PBS buffer (pH 7.4) was chosen as the reaction medium because this condition is suitable to form nanosized Fe–TA complexes with predominantly Tris-coordinated structure that are more stable structures.16 Schematic illustration for Fe–TA NPs preparation and typical characteristics of Fe–TA NPs are shown in Fig. S1.† The obtained Fe–TA NPs exhibited very good physico-chemical properties such as small size with narrow size distribution, and good colloid stability. Indeed, they were highly stable for transchelation and transmetalization.16 Our method for preparing the Fe–TA NPs was simple and reproducible without having to use expensive equipment and reagents, which allows us to apply this method for an industrial application.As far as toxicity is concerned, toxicology of Fe–TA NPs was carried out according to OECD guidelines with some modifications.18 Initially, rats were intravenously injected with 17.5 mg kg−1 b.w. (n = 3) and 27.5 mg kg−1 b.w. (n = 3) Fe–TA NPs. It was found that no clinical signs of mortality and morbidity were observed for 14 days. After that 55 mg kg−1 b.w. Fe–TA NPs was injected into 5 rats. We found that a rat had died after a 24 hour of injection while the others had no any clinical signs for 14 days. Changes in body weights and organ weights were summarized in Table S1.† No change in body weights were observed in all treatment groups as compared to control animals. Treatment group with 17.5 mg kg−1 b.w. Fe–TA NPs showed significantly greater kidney weight and relative liver and kidney weight than negative control, but those in treatment groups of 27.5 and 55 mg kg−1 b.w. showed no significant difference in the relative liver, spleen, and kidney weight. In addition, blood tests showed that 27.5 and 55 mg kg−1 b.w. Fe–TA NPs did not affect white blood cells (WBC), red blood cell (RBC) and platelet (PLT). According to data above mentioned, it can be inferred that Fe–TA NPs has low toxicity with LD50 > 55 mg kg−1 b.w. Before being subjecting to in vivo MRI, a serial dilution of Fe–TA NPs was imaged to confirm their capability of enhancing MRI signals. Fig. S2† shows signal intensity with the corresponding MRI image of solutions of Fe–TA NPs. Clearly, increasing signal intensity in a concentration-dependent manner, demonstrating their potential application as MRI agents.
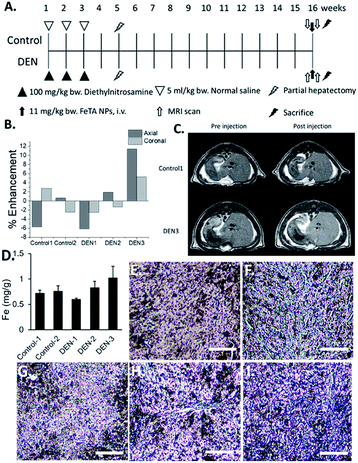
In order to investigate capability of Fe–TA NPs in MRI contrast enhancement of liver pre-neoplasia, 5 rats were divided into control rats (n = 2) and DEN-induced rates (n = 3). It should be noted that our DEN treatment protocol was considered as midterm treatment, which allows the promotion of pre-neoplasia lesions in liver.19,20 According to the experiment plan (as summarized in Fig. 1A), all rats were imaged before and after intravenous administration of Fe–TA NPs (11 mg kg−1 b.w.), and enhancement of signal intensity was analyzed. Fig. 1B demonstrates percentage of the mean contrast enhancement of liver in coronal and axial planes after intravenous injection. Obviously, the greatest contrast enhancement is clearly found in DEN-3, while those observed in DEN-1 and DEN-2 are not significant, as compared to control rats. Fig. 1C shows typical T1-weighted MR images of liver rats in the Control-1 and DEN3 before and after injection of Fe–TA NPs, which clearly demonstrates the enhancement occurring in DEN-3. Next, we attempted to determine iron accumulation in the livers of each rat. The quantitative analysis was determined by ICP-OES and was found to be 0.718 ± 0.59, 0.76 ± 0.95, 0.56 ± 0.22, 0.83 ± 0.12, and 1.02 ± 0.23 mg g−1 for rat in Control-1, Control-2, DEN-1, DEN-2, and DEN-3, respectively. In addition to ICP-OES analysis, qualitative accumulation in liver sections was also investigated using Prussian blue staining. As expected, similar trends were observed, whereby the great accumulation was observed in DEN induced group, especially in DEN-3 (Fig. 1D–I).
Although the above results demonstrate the potential application of Fe–TA NPs as molecular MRI agents for hepatic preneoplasia, it is still unclear why only DEN-3 shows the great enhancement. We hypothesized that contrast enhancement might be associated with particular pathological lesions found in the liver. To determine this, pathological analysis of DEN induced rats was carried out. It is reported that glutathione S-transferase placental type (GST-P) is hardly detectable in normal rat livers, but it is found to be expressed in preneoplastic liver foci. GSTP is a member of the glutathione S-transferase supergene family that plays a role in detoxification of xenobiotics including DEN. It is markedly elevated during hepatocarcinogenesis and thus, GST-P positive foci is considered as an end-point marker for liver preneoplasia.8,20 Herein, we determined GST-P positive foci in liver sections in DEN-induced rats using immunohistochemistry (summarized as cartoon in Fig. 2A).
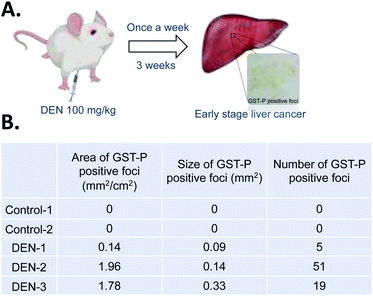 | ||
| Fig. 2 (A) Our procedure for DEN induction and immunohistochemistry stanning of GST-P. (B) Characteristics of GST-P positive foci in liver sections of different rats. | ||
Fig. 2B shows different characteristics of GST-P positive foci including size of foci, area of foci/total area, and number of foci of DEN induced rats. Of course, no GST-P positive foci were observed in Control-1 and Control-2. In DEN-1, GST-P foci/total area was determined to be 0.14 mm2 cm−2, while the number of foci was 5 and the average area was 0.09 mm2. In DEN-2, GST-P foci/total area was 1.96 mm2 cm−2, while the number of foci was 51 and average area was 0.14 mm2. In DEN-3, GST-P foci/total area was 1.78 mm2 cm−2, while the number of foci was 19 and average area was 0.33 mm2. Not surprisingly, there are different characteristics of GST-P positive foci in different DEN-induced rats, indicating that induction of hepatic pre-neoplasia in each rat by DEN is different. It is important to note that not only size of foci but all areas of foci/total area and number of foci are critical to take into account because DEN might act in different ways in different rodent models, leading to variation on lesions.21 This encouraged us to further analyze the correlation between different characters of GST-P positive foci and MRI signal as well as iron accumulation. The correlation analysis is shown in Table 1. It can be seen that GST-P foci/total area has strong positive correlation with iron content in liver and percentage of signal enhancement in axial plane. However, it is weakly correlated to the % enhancement in coronal plane. For the size of GST-P foci, there are strong positive correlations to all parameters. When considering number of foci, it has only weak positive correlation to iron content in livers while there is no correlation with % enhancement in both coronal and axial plane. From the above results, it can be pointed out that lesion size does matter for accumulation of Fe–TA NPs as well as MRI contrast enhancement.
| Parameters | Area of GST-P positive foci (mm2 cm−2) | Size of GST-P positive foci (mm2) | Number of GST-P positive foci |
|---|---|---|---|
| Iron content | Strong positive correlation (R2 = 0.85) | Strong positive correlation (R2 = 0.91) | Weak positive correlation (R2 = 0.36) |
| % enhancement (axial) | Strong positive correlation (R2 = 0.79) | Strong positive correlation (R2 = 0.95) | Weak positive correlation (R2 = 0.25) |
| % enhancement (coronal) | Weak positive correlation (R2 = 0.54) | Strong positive correlation (R2 = 0.99) | No correlation (R2 = −0.08) |
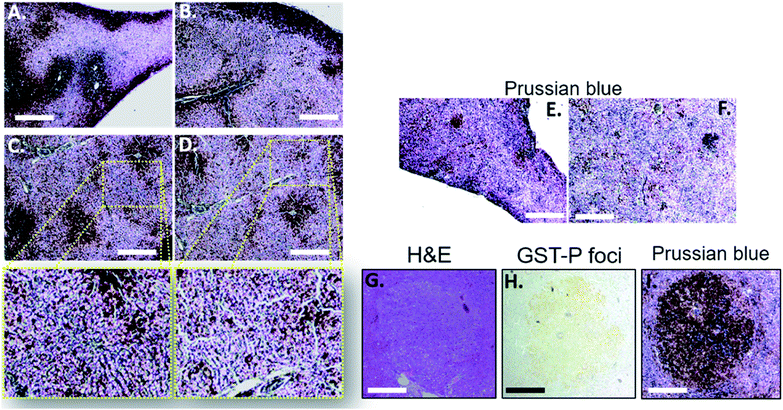
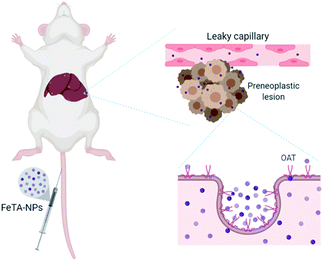
Next, we tried to figure out why the Fe–TA NPs preferentially accumulate in hepatic pre-neoplasia. At first, we carefully analyzed characteristic of iron accumulation in liver sections stained by Prussian blue assay. Fig. 3A–D shows Prussian blue staining images of different areas of liver tissue taken from Control-2. It can be seen that Prussian blue is present within hepatic sinusoids, rather than in liver parenchyma, implying that the Fe–TA NPs cannot easily penetrate into liver parenchyma or hepatocytes. However, those in DEN-3, the Fe–TA NPs are found to distribute throughout the section with a higher level of accumulation (Fig. 3E and F) when compared to the Control-2, indicating that distribution of Fe–TA NPs occurs more efficiency. Similarly, Fe–TA NPs accumulation is also found in preneoplastic lesions (GST-P+), as shown in Fig. 3G–I. From these results, we hypothesized that enhanced accumulation of Fe–TA NPs might be due to leaky vascularization induced by DEN. To determine if this is the case, we analyzed liver sinusoidal architecture in Control-2 and DEN-3. It is generally recognized that hepatic sinusoids play a crucial role in hepatic microcirculation and that abnormalities of hepatic sinusoidal morphology and architecture can occur under pathological conditions including carcinogen induction.22 As the results show in Fig. 4, H&E staining and SEM imaging demonstrate sinusoidal morphology alterations in DEN-3 (red arrow head), compared to control (green arrow head). The alterations include sinusoidal dilation and congestion, sinusoidal swelling, and sinusoidal capillarization (unorganized sinusoids). Similarly, CD34 staining, endothelial cell markers clearly show the CD34-positive capillaries and sinusoids of liver tissue in the control rats, but not for DEN induced rats, implying that there are abnormalities of liver sinusoidal endothelial cells (LSECs).23 Because hepatic sinusoid acts as a selective barrier between the blood and liver parenchyma, alteration of sinusoidal functions and morphologies might lead to leakage of hepatic capillaries and sinusoids, thereby causing Fe–TA NPs to penetrate liver parenchyma. In addition to abnormalities of hepatic sinusoids, capable of taking up of Fe–TA NPs by hepatocytes is also critical implications for their accumulation and MRI enhancement efficiency. In our recent work, we investigated cellular uptake mechanisms of Fe–TA NPs using bioinformatic analysis and we found that molecular functions and biological processes are related to organic anion transporter (OAT) activities that were upregulated in Fe–TA NPs treated liver cell line. Moreover, an inhibitory study on Fe–TA NPs uptake using organic anion transporter (OAT) inhibitors also confirmed the bioinformatic results.15 This implies that organic anion transporter (OAT) family plays a crucial role in taking up the Fe–TA NPs. As far as expression of OAT is concerned, it has been reported that OAT expression on hepatocyte membranes is upregulated during the early stages of carcinogenesis including the pre-neoplastic stage and early dysplastic stage.7 Therefore, it was expected that the OAT expression on the membrane of preneoplastic hepatocytes is high. To confirm above hypothesis, we performed immunohistochemical staining of different liver sections of healthy rat and DEN induced rat using OAT antibody. As the results shown in Fig. 5, it is clearly found that OAT is elevated in DEN induced rats. This can be implied that a high expression of OAT might play a role in cellular internalization and accumulation of Fe–TA NPs in liver preneoplasia. Fig. 6 shows schematic illustration of Fe–TA NPs accumulation within liver preneoplasia, which might be due to the dysfunction of liver sinusoids along with cellular uptake capability of pre-neoplastic hepatocytes mediated by OAT. However, the exact mechanism for Fe–TA NPs accumulation is still not clear, especially in vivo.
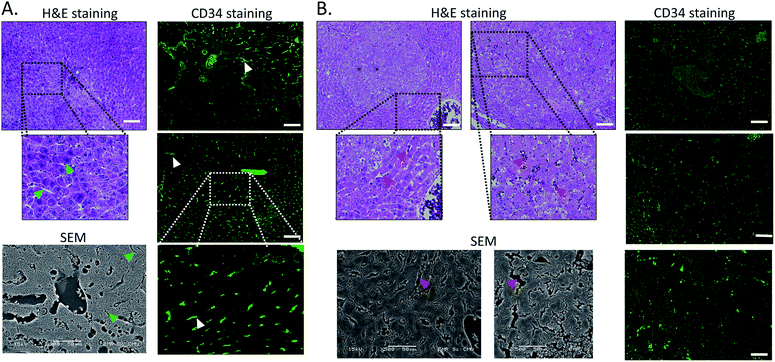 | ||
| Fig. 4 H&E staining, SEM imaging and immunofluorescence of CD34 of liver sections of (A) Control-2. (B) DEN-3. Arrow heads indicate hepatic sinusoids. (Scale bar 100 μm). | ||
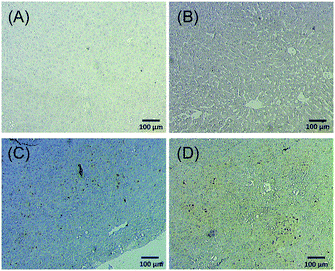 | ||
| Fig. 5 OAT immunohistochemistry of different liver sections of (A and B) healthy rat and (C and D) DEN induced rat. | ||
Conclusion
There is no doubt that MRI is an efficient tool for the detection of different stages of liver cancer. Much effort has been done to improve sensitivity and specificity of measurement with less invasion, including the development a new class of MRI agents to achieve desired results. In this research, nanoparticles of iron–tannic complexes (Fe–TA NPs) are capable of enhancing MRI signals in liver preneoplasia, depending on the characteristics of pre-neoplastic lesion. Although there are some limitations inherent in this study, our report reveals that Fe–TA NPs are potential candidates to be developed as an efficient MRI agent for risk assessment of early stage liver cancer. This is particularly true for people requiring a first-line diagnosis approach for early detection of liver cancer. However, additional work on different aspects need to be carried out in order to confirm the clinical feasibility of our agent. Indeed, we are currently investigating these concerns in our research group.Conflicts of interest
The authors declare no conflicts of interest.Acknowledgements
This work was financially supported by the National Research Council of Thailand (NRCT). In addition, we wish to thank Center of Excellence in Materials Science and Technology, Chiang Mai University, for financial support under the administration of Materials Science Research Center, Faculty of Science, Chiang Mai University, Thailand.References
- I. Joo and J. M. Lee, Liver Cancer, 2016, 5, 67–87 CrossRef CAS
.
- K. Zhang, R. Chen, X. Gong and Y. Gao, J. Formosan Med. Assoc., 2019, 118, 790–796 CrossRef
.
- P. Golabi, S. Fazel, M. Otgonsuren, M. Sayiner, C. T. Locklear and Z. M. Younossi, Medicine, 2017, 96, e5904 CrossRef
.
- J. Zhou, H.-C. Sun, Z. Wang, W.-M. Cong, J.-H. Wang, M.-S. Zeng, J.-M. Yang, P. Bie, L.-X. Liu, T.-F. Wen, G.-H. Han, M.-Q. Wang, R.-B. Liu, L.-G. Lu, Z.-G. Ren, M.-S. Chen, Z.-C. Zeng, P. Liang, C.-H. Liang, M. Chen, F.-H. Yan, W.-P. Wang, Y. Ji, W.-W. Cheng, C.-L. Dai, W.-D. Jia, Y.-M. Li, Y.-X. Li, J. Liang, T.-S. Liu, G.-Y. Lv, Y.-L. Mao, W.-X. Ren, H.-C. Shi, W.-T. Wang, X.-Y. Wang, B.-C. Xing, J.-M. Xu, J.-Y. Yang, Y.-F. Yang, S.-L. Ye, Z.-Y. Yin, B.-H. Zhang, S.-J. Zhang, W.-P. Zhou, J.-Y. Zhu, R. Liu, Y.-H. Shi, Y.-S. Xiao, Z. Dai, G.-J. Teng, J.-Q. Cai, W.-L. Wang, J.-H. Dong, Q. Li, F. Shen, S.-K. Qin and J. Fan, Liver Cancer, 2018, 7, 235–260 CrossRef
.
- T. Couri and A. Pillai, Hepatol. Int., 2019, 13, 125–137 CrossRef
.
- M. Borzio, F. Paladino and G. Francica, Hepatoma Res., 2019, 5, 15–31 CAS
.
- H. J. Park, B. I. Choi, E. S. Lee, S. B. Park and J. B. Lee, Liver Cancer, 2017, 6, 189–203 CrossRef CAS
.
- K. Ogawa, Pathol. Int., 2009, 59, 605–622 CrossRef CAS
.
- V. Vilgrain, B. E. Van Beers and C. M. Pastor, J. Hepatol., 2016, 64, 708–716 CrossRef
.
- J. Rogowska, E. Olkowska, W. Ratajczyk and L. Wolska, Environ. Toxicol. Chem., 2018, 37, 1523–1534 CrossRef CAS
.
- D. V. Bower, J. K. Richter, H. von Tengg-Kobligk, J. T. Heverhagen and V. M. Runge, Invest. Radiol., 2019, 54, 453–463 CrossRef CAS
.
- E. M. Snyder, D. Asik, S. M. Abozeid, A. Burgio, G. Bateman, S. G. Turowski, J. A. Spernyak and J. R. Morrow, Angew. Chem., Int. Ed. Engl., 2020, 59, 2414–2419 CrossRef CAS
.
- P. Boehm-Sturm, A. Haeckel, R. Hauptmann, S. Mueller, C. K. Kuhl and E. A. Schellenberger, Radiology, 2018, 286, 537–546 CrossRef
.
- H. Wang, V. C. Jordan, I. A. Ramsay, M. Sojoodi, B. C. Fuchs, K. K. Tanabe, P. Caravan and E. M. Gale, J. Am. Chem. Soc., 2019, 141, 5916–5925 CrossRef CAS
.
- C. Pilapong, T. Phatruengdet and S. Krungchanuchat, Nanoscale, 2020, 12, 6556–6561 RSC
.
- K. Saowalak, T. Titipun, T. Somchai and C. Pilapong, Sci. Rep., 2018, 8, 6647–6660 CrossRef
.
- C. Punvittayagul, P. Sankam, S. Taya and R. Wongpoomchai, Nutr. Cancer, 2016, 68, 646–653 CrossRef
.
- OECD, Test No. 407: Repeated Dose 28-day Oral Toxicity Study in Rodents, 1995 Search PubMed
.
- N. Ito, M. Tatematsu, R. Hasegawa and H. Tsuda, Toxicol. Pathol., 1989, 17, 630–641 CrossRef CAS
.
- N. Ito, S. Tamano and T. Shirai, Cancer Sci., 2003, 94, 3–8 CrossRef CAS
.
- Q. Wang, P. Zhang, Z. Li, X. Feng, C. Lv, H. Zhang, H. Xiao, J. Ding and X. Chen, Theranostics, 2019, 9, 1426–1452 CrossRef CAS
.
- Y. J. Yoon, S. Chang, O. Y. Kim, B.-K. Kang, J. Park, J.-H. Lim, J. Yun Huang, Y.-K. Kim, J. H. Byun and Y. S. Gho, PLoS One, 2013, 8, e68600 CrossRef CAS
.
- A. Baiocchini, F. Nonno, C. Taibi, U. Visco Comandini, G. D'Offizi, M. Piacentini and L. Falasca, Sci. Rep., 2019, 9, 8760 CrossRef
.
Footnote |
| † Electronic supplementary information (ESI) available. See DOI: 10.1039/d0ra07308c |
| This journal is © The Royal Society of Chemistry 2020 |


