 Open Access Article
Electrocatalytic performance of Pt–Ni nanoparticles supported on an activated graphite electrode for ethanol and 2-propanol oxidation†
M. L. Chelaghmia *a,
M. Nacefa,
H. Fislib,
A. M. Affounea,
M. Pontiéc,
A. Makhloufd,
T. Derablaa,
O. Khelifia and
F. Aissate
aLaboratoire d'Analyses Industrielles et Génie des Matériaux, Département de Génie des Procédés, Université 8 Mai 1945 Guelma, BP 401, Guelma 24000, Algeria. E-mail: chelaghmia.mohamedlyamine@univ-guelma.dz; amine_chelaghmia@yahoo.fr
bLaboratoire de Chimie Appliquée, Département des Sciences de la Matière, Université 8 Mai 1945 Guelma, BP 401, Guelma 24000, Algeria
cUniversité d'Angers, Faculté des Sciences, Groupe Analyses et Procédés (GAP), 2 Bd. Lavoisier, 49045 Angers 01, France
dLaboratoire des Silicates, Polyméres et Nanocomposites, Université du 8 Mai 1945, Algeria
eCentre de Recherche Scientifique et Technique en Analyses Physico-chimiques (CRAPC), Algeria
First published on 7th October 2020
Abstract
Platinum (Pt) and platinum–nickel (Pt–Ni) electrocatalysts were prepared on activated graphite electrodes by an electrochemical deposition process. The electrocatalysts were analyzed by scanning electron microscopy (SEM), energy-dispersive X-ray spectroscopy (EDX) and X-ray diffraction (XRD). The electrocatalytic activity of the prepared electrocatalysts, their stability, and the effect of temperature toward ethanol and 2-propanol oxidation were evaluated by cyclic voltammetry (CV), chronoamperometry and electrochemical impedance spectroscopy (EIS). The results showed that the Pt–Ni/C exhibited higher catalytic activity, better stability and better tolerance to poisoning by ethanol and 2-propanol oxidation intermediate species compared to Pt/C, which was interpreted as synergistic and electronic effects between Pt and Ni. A study of the temperature dependence of ethanol and 2-propanol oxidation in the temperature range of 298–318 K, shows that the apparent activation energy for ethanol and 2-propanol oxidation on Pt–Ni/C was lower than on Pt/C. The results also revealed that the electro-oxidation of ethanol and 2-propanol on Pt/C were improved by raising the temperature and Ni modification.
1. Introduction
Direct alcohol fuel cells (DAFCs) have been recognized as one of the most promising power sources for portable devices and transportation applications.1–3 Most of the research in the fuel cell field is focused on direct methanol fuel cells (DMFCs) on account of their merits of large energy conversion efficiency and moderate operating temperature.4–7However, some drawbacks of methanol such as toxicity and its easier crossover through ionomeric membranes are the key reasons to select other liquid fuels rather than methanol.8 For two decades, ethanol has emerged as the first choice, mostly thanks to its high energy density (7.44 kW h kg−1 compared to 6 kW h kg −1 for methanol). Furthermore, it's considered as a safe and green fuel, and it can be obtained from materials containing sugar.8–11
Another alcohol, 2-propanol is reported to have a promising future for DAFCs due to no CO formation, lower crossover effect and also less toxicity comparing to methanol.12–16
Carbon supported Pt electrocatalysts are well-known to be active for the electrochemical oxidation of ethanol and 2-propanol in acid media. However, Pt is easily poisoned by strongly adsorbed residues of alcohol electro-oxidation.12 To overcome this drawback, various metals have been studied in several combinations with Pt, resulting on binary or ternary metallic electrocatalysts, such as Pt–Ru,17 Pt–Sn,18 Pt–Rh![[thin space (1/6-em)]](https://www.rsc.org/images/entities/char_2009.gif) 19 and Pt–Sn–Mo.20 The promoting effect of second or third elements has been attributed to the synergistic and electronic effects. In the synergistic mechanism, secondary element could adsorb hydroxyl species at lower potentials than Pt and supplies oxygen to oxidize the blocking intermediate, and consequently liberate Pt active sites.
19 and Pt–Sn–Mo.20 The promoting effect of second or third elements has been attributed to the synergistic and electronic effects. In the synergistic mechanism, secondary element could adsorb hydroxyl species at lower potentials than Pt and supplies oxygen to oxidize the blocking intermediate, and consequently liberate Pt active sites.
Among, different techniques of synthesizing used to prepare platinum and its alloys onto substrates base carbon, the simple electrodeposition has been proven as a powerful tool for the fabrication of efficient electrocatalysts.21
Many authors have reported that the catalytic activity of Pt–Ni for the electrooxidation of methanol is higher to that of Pt alone.15,22–26 However, few studies, have demonstrated that Ni tends to improve the catalytic activity of the Pt electrode for ethanol and 2-propanol electrooxidation.27–30 Furthermore, one of the most important factors is the temperature at which the cell is operated. Until now, only few researches discussed the effect of temperature on the performance of Pt based ethanol and 2-propanol oxidation catalysts.31–33
To the best of authors' knowledge there are no reports on the temperature effect on the anodic oxidation of ethanol and 2-propanol in acidic medium on activated graphite supported Pt–Ni. In the study reported herein, the electrocatalytic activity and the effect of temperature on the electrooxidation of ethanol and 2-propanol on activated graphite supported Pt and Pt–Ni electrodes is studied and the resulting activation energy is derived from experimental data. Furthermore a durability investigation of these electrocatalysts was done.
2. Experimental
2.1 Chemicals and materials
Chloroplatinic acid (H2PtCl6·6H2O) and nickel sulfate (NiSO4·6H2O) were procured from Sigma-Aldrich. Sulfuric acid (H2SO4), ethanol (C2H6O) and 2-propanol (C3H8O) were purchased from Merck. Commercial graphite bare was obtained from Union Carbide. All chemicals were of analytical grade and used as received. All solutions were prepared by bidistillated water.2.2 Preparation of the Pt/C and Pt–Ni/C electrocatalysts
Prior to deposition, the graphite carbon substrates were mechanically polished using metallurgical papers of different grades. After successive sonication in acetone, 2.0 M H2SO4 solution and bidistilled water, the graphite carbon substrates were then activated employing an electrochemical method according to the previous work.27The Pt and Pt–Ni microparticles were electrodeposited from electrolytes consisting of 16 mM H2PtCl6, and 16 mM H2PtCl6 + 128 mM NiSO4 solutions, respectively, in 1.0 M H2SO4 by using amperometric i–t at −0.6 potential for just 600 s. Finally the prepared electrodes were cleaned thoroughly with deionized water and dried at room temperature.
2.3 Physical and electrochemical characterization
All electrochemical measurements were carried out using a potentiostat (AMETEK, USA). A conventional three electrode cell was used with, a smooth Pt, activated graphite, Pt/C and Pt–Ni/C as the working electrode, a SCE (saturated KCl) electrode as the reference electrode, and platinum foil as the counter electrode.The morphological features were examined using Field Emission Scanning Electron Microscope (FESEM) (JEOL, 6301F, Japan.). The temperature of the working aqueous solution was thermostated within the range of 298–353 K using a hot plate and monitored by a thermocouple inside the solution.
Electrochemical reactivity of the Pt/C and Pt–Ni/C electrodes were investigated in 0.1 M H2SO4 + 1.0 M ethanol or 1.0 M 2-propanol aqueous solutions by CV and chronoamperometry. All current densities were normalized to the electrochemical surface area (ECSA) obtained by hydrogen desorption integrals according to the following equation: ECSA = QH/(210 × m), where QH is the coulombic charge according to the integrated area of hydrogen adsorption and desorption in CV curve, m represents the loading of Pt on graphite electrode.27
3. Results and discussion
3.1 Physical and electrochemical characteristics of Pt/C and Pt–Ni/C electrocatalysts
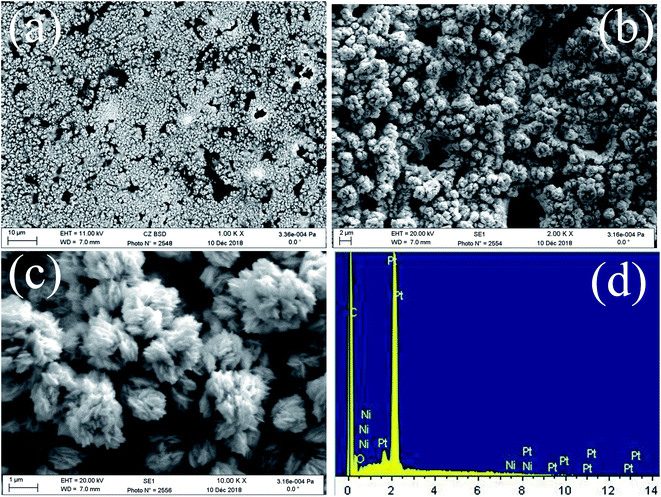
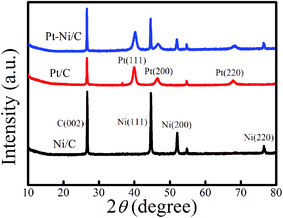
FE-SEM images of the obtained deposits Pt/C and Pt–Ni/C electrocatalysts surfaces are shown in Fig. 1. As can be seen, the surface morphology of activated graphite was affected by the incorporation of homogeneous distribution Pt and Ni microparticles (Fig. 1a–c). Pt microparticles were deposited as small particles in the range from 80 to 200 nanometers, while the Ni was in the form of clusters. The elemental compositions of the catalysts were identified from the EDX spectrum as shown in Fig. 1d. The peaks corresponding to Pt, Ni, and C were clearly observed confirming the presence of Pt microparticles and Ni onto the activated graphite electrodes surface.XRD patterns of Pt–Ni/C electrocatalysts in comparison with that of Pt/C and Ni/C were displayed in Fig. 2.
C (002) plane of crystalline graphite structure was observed in all studied electrocatalysts at 26°. The XRD spectra of Pt/C and Ni/C agreed well with the standard patterns of the Pt (JCPDS no. 01-087-0646) and Ni (JCPDS no. 89-2838).
For Pt/C three characteristic peaks were observed at 2θ = 39.91°, 46.31°, and 67.68°, and indexed well to the (111), (200), and (220) crystal planes of face-centered cubic of pure Pt respectively. In the same figure, for Ni/C another three characteristic diffraction peaks located at 2θ = 44.8°, 52.1°, and 76.6°, are associated with the (111), (200), and (220), crystal planes respectively indicate the formation of pure Ni. The XRD pattern of Pt–Ni/C show the corresponding diffraction peaks of Pt/C and Ni/C indicating that the Pt and Ni are separated phases in their metallic state.
The electrochemical behavior of the obtained deposits was studied in 0.1 M H2SO4 solution at a scan rate of 50 mV s−1 (Fig. 3). As can be seen in Fig. 3, the voltammetric features of the Pt/C and Pt–Ni/C are similar to that observed on the smooth Pt electrode: typical hydrogen and oxygen adsorption/desorption regions with the presence of a strong double layer region were observed in all electrocatalysts. However, it seems that the adsorption of the oxygen species on Pt–Ni/C electrocatalyst during the anodic scan after 0.6 V is more pronounced than that on Pt/C alone. Consequently the peak current density of Pt oxide reduction is enhanced on Pt–Ni/C.
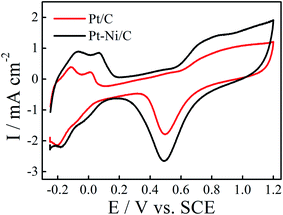 | ||
| Fig. 3 CVs of Pt–Ni/C and Pt/C electrocatalysts in 0.1 M H2SO4 solution at a scan rate of 50 mV s−1 and 298 K. The inset is the CV of smooth Pt electrode in 1.0 M H2SO4 solution. | ||
3.2 Ethanol and 2-propanol electrooxidation on Pt/C and Pt–Ni/C in acidic medium
The electrocatalytic activity of the Pt/C and Pt–Ni/C electrocatalysts towards ethanol and 2-propanol oxidation was studied using CV. The observed cyclic voltammograms are shown in Fig. 4. It shows that both ethanol and 2-propanol transformation are characterized by three oxidation peaks; two peaks appear during the positive going potential scan (PGPS), peaks (I) and (II), while the third one (R) is recorded on the negative going potential scan (NGPS). The change in the current values indicates that the Ni contribution increases the anodic oxidation kinetic during the whole potential range.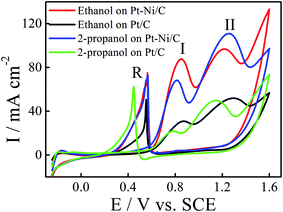 | ||
| Fig. 4 CVs of ethanol electrooxidation on Pt/C (black) and Pt–Ni/C (red) and 2-propanol electrooxidation on Pt/C (green) and Pt–Ni/C (blue) in 0.1 M H2SO4 at a scan rate of 50 mV s−1 and 298 K. | ||
These features have been already observed on different electrocatalysts; such as Pt/C, Pt–Rh, Pt–Ni/C and Pt–Sn/C.13–20 The first oxidation peak (peak I) corresponds mainly to the formation of CO2 for ethanol and to the formation of CO2 and acetone for 2-propanol whereas the second oxidation peak (peak II) is caused by other products as acetic acid and acetaldehyde for ethanol and to the oxidation of acetone for 2-propanol. The mechanism of ethanol electrooxidation in acid solution has been summarized as the following scheme of parallel reactions:
| CH3CH2OHsol → [CH3CH2OH]ads → C1ads; C2ads → CO2 (total oxidation) | (1) |
| CH3CH2OHsol → [CH3CH2OH]ads → CH3CHO → CH3COOH (partial oxidation) | (2) |
[CH3CH(O–H)CH3]sol → [CH3CH(O–H)CH3]ads → CH3(C![[double bond, length as m-dash]](https://www.rsc.org/images/entities/char_e001.gif) O)CH3 + 2H+ + 2e− O)CH3 + 2H+ + 2e−
| (3) |
| [CH3CH(O–H)CH3]sol + 5OHads → 13H+ + 13e− + 3CO2 | (4) |
During the NGPS, the Pt oxides are reduced at 0.6 V and subsequently, the catalyst surface is re-activated and hence the oxidation of both alcohols and/or the oxidation of intermediate molecules take place again (peak R).
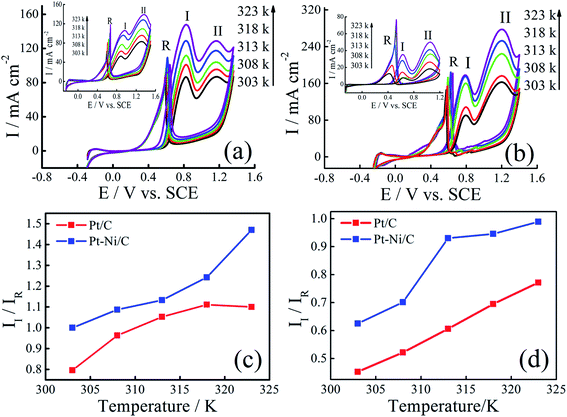
According to Fig. 4, the current densities of the two oxidation peaks of both alcohols recorded on Pt–Ni/C are higher than that on the Pt/C (1.5 and 1.7 times higher in the case of ethanol and 2-propanol, respectively). The ratio of the current densities between the first anodic peak (II) and the reverse anodic peak (IR) is used to evaluate the conversion extent from alcohol to CO2.15
A large ratio represents more effective removal of the poisoning substances produced among ethanol and 2-propanol electro-oxidation. Thus the II/IR equal to 1.08 and 0.71 for Pt–Ni/C and Pt/C electrocatalysts in the case of ethanol electrooxidation and 1.0 and 0.6 in the case of 2-propanol electro-oxidation. The higher peak ratio for the Pt–Ni/C electrocatalyst suggests that the introduction of Ni can improve catalyst performance through increasing the poisoning tolerance to the intermediate carbonaceous species formed during ethanol or 2-propanol electrooxidation.
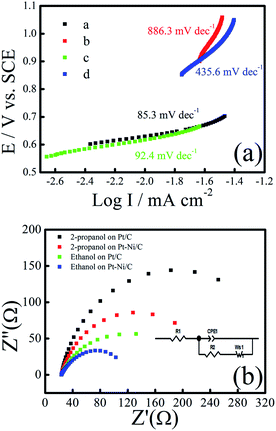
Tafel plots of ethanol and 2-propanol electro-oxidation on the Pt–Ni/C catalysts, derived from the CV grams in 0.1 M H2SO4 with 1.0 M ethanol or 2-propanol at a scanning rate of 10 mV s−1, are shown in Fig. 5a. The value of Tafel slope represents the two reaction mechanism for ethanol and 2-propanol electrooxidation in the two region of CV grams. The Tafel slope is in the range of 85.3 (for ethanol) and 92.4 mV dec−1 (for 2-propanol) at low potentials (below 0.7 V), which means that the ethanol and 2-propanol electro-oxidation dehydrogenation as the rate determining step (r.d.s). When the over-potential is above 0.7 V, the generated intermediates and their adsorption at the Pt–Ni sites become dominant and the second Tafel slope is in the range of 435 and 886 mV dec−1. As a result, the r.d.s may change to the intermediates oxidation during of ethanol and 2-propanol electro-oxidation at higher electrode potentials.
To understand the electron transfer rate of the elaborated electrocatalyst on ethanol and 2-propanol electro-oxidation kinetics, electrochemical impedance spectroscopy (EIS) was performed at an overpotential of 0.7 V in 0.1 M H2SO4 and 0.5 M ethanol/2-propanol in the frequency ranging from 10 kHz to 0.01 Hz (Fig. 5b). The equivalent circuit model (inset of Fig. 5b) contains resistance of solution (Rs), the charge transfer resistance (Rct), the Warburg element (W), and constant phase element (CPE). Rct is related to the electrocatalytic kinetics at the electrocatalyst/electrolyte interface and a small value corresponds to a fast electron transfer capacity. The fitted values of charge transfer resistance Rct for the, Pt–Ni/C and Pt/C were 285.98 Ω and 312.33 Ω during ethanol electro-oxidation and 142.93 Ω and 207.03 Ω during 2-propanol electro-oxidation respectively. The low Rct value obtained for Pt–Ni/C suggests that the charge-transfer process is faster when compared with the Pt/C during ethanol and 2-propanol electro-oxidation. These findings confirm the beneficial effect of Ni addition to Pt in ethanol and 2-propanol electrooxidation catalysis.
3.3 Effects of forward potential scan limits on the electrooxidation process
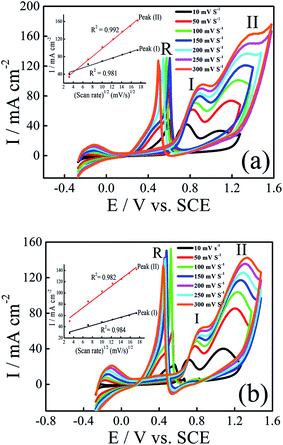
To get more information about catalytic oxidation process of the modified electrodes, we examined the effect of the forward potential scan limits on the voltammetric curves. The CVs for ethanol and 2-propanol oxidation on Pt–Ni/C electrocatalyst with different forward potential scan limits are shown in Fig. 6.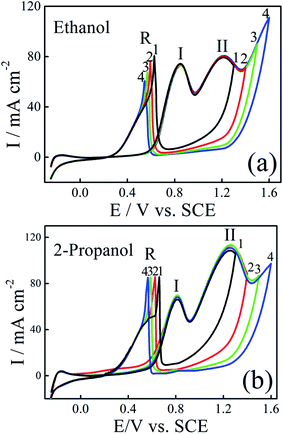 | ||
| Fig. 6 CVs of Pt–Ni/C electrocatalyst in 0.1 M H2SO4 and 1.0 M ethanol (a) or 1.0 M 2-propanol (b) recorded with different positive potential limits at a scan rate of 50 mV s−1 and 298 K. | ||
As given in Fig. 6a, by increasing the final anodic limit in the forward scan, the forward scan peak current density of ethanol remains unchanged, but oxidation current density in the negative scan (R) was decreased. This indicated that the decrease in the adsorbed CO, as previously observed on Pt–Ru.17 The presence of Ni facilitates the oxidation of freshly chemisorbed species and serves as anti-poison sites by catalyzing oxidation of CO at lower potentials. However, in the case of 2-propanol, Fig. 6b, the oxidation current density peak in the reverse scan remains at the same value when the forward potential scan limits are changed. This is, probably due to the absence of CO as reaction intermediate as observed previously by Gojković on Pt.14 Comparison between some ethanol and 2-propanol electrocatalysts are presented in Table 1S.† It can be seen that the proposed Pt–Ni/C electrode had a high electrocatalytic activity for ethanol and 2-propanol electroxidation.34–36
3.4 The scan rate effect
The influence of the scan rate on the electrocatalytic oxidation of ethanol and 2-propanol at Pt–Ni/C were investigated using CV. Fig. 7a and b show the CVs of the Pt–Ni/C recorded in 0.1 M H2SO4 solution in the presence of 1.0 M ethanol/1.0 M 2-propanol at different scan rates respectively. The current densities peaks in PGPS, peak (I) and peak (II) are linearly proportional to the square root of scan rate (v1/2), as shown in the insets of Fig. 7a and b, suggesting that the electrocatalytic oxidation of ethanol and 2-propanol on Pt–Ni/C electrocatalyst and their intermediates were controlled by diffusion process.Additionally, the peaks (I) and (II) shift positively with the increasing of scan rates while peak (R) shifts negatively. This phenomenon indicates an irreversible charge transfer on the electrode surface during alcohol electrooxidation process. Furthermore, it can be seen that voltammograms are superimposed during the beginning of the potential scan rate which indicates a controlled charge transfer kinetic.
In addition the small negative current due to the reduction of the surface Pt oxides which is formed at higher potentials in the PGPS, was observed in the range of potential 0.45 V.
3.5 The temperature effect
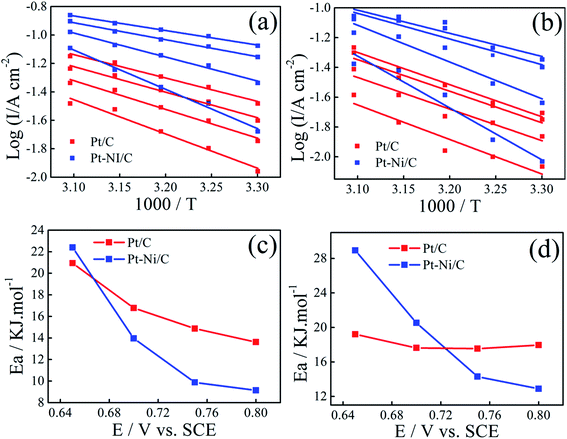
The effect of temperature on the electrocatalytic activities of Pt/C and Pt–Ni/C is shown in Fig. 8. Electrodes activities for both alcohols oxidation are markedly enhanced as it can be expected due to the temperature contribution. On the Pt/C electrocatalyst, the way of increasing current densities of two peaks, (I) and (II), is almost the same for both alcohols (inset of Fig. 8a and b). However, a significant difference between the voltammograms recorded on Pt–Ni/C electrocatalyst can be noted (Fig. 8a and b). For ethanol, the increase in the current densities of peak (I) is much greater than that in peak (II), which could be attributed to better conversion of ethanol to CO2 reducing the amount of CO to be oxidized subsequently. In the case of 2-propanol, the oxidation does not lead to the formation of CO. However the amount of intermediates generated during its oxidation increases resulting on a rise in the current densities of peak (I). In addition as shown in Fig. 6c and d the II/IR ratio of Pt–Ni/C is higher than that of Pt/C, which shows that the temperature has better catalytic efficiency on Pt–Ni/C than on Pt/C.Arrhenius plots were drawn for different potentials at different temperatures (Fig. 9a and b). Linear relationships between log![[thin space (1/6-em)]](https://www.rsc.org/images/entities/char_2009.gif) I and 1/T is noted in all cases, indicating that the reaction mechanism at each potential is not changed with temperature.
I and 1/T is noted in all cases, indicating that the reaction mechanism at each potential is not changed with temperature.
The activation energy (Ea) values were calculated for different potential values (Fig. 9c and d).
The lower apparent activation energy on Pt–Ni/C than that on Pt/C indicates that temperature rise is the most beneficial for ethanol and 2-propanol oxidation on Pt–Ni/C electrocatalyst than that on Pt/C. All the above results of CV, Arrhenius plots and apparent activation energy values indicate that Pt–Ni/C exhibits higher catalytic activity for both alcohols oxidation than Pt/C.
3.6 Study of electrocatalysts' stability
In practice, long-term stability of an electrode is crucial. Thus chronoamperograms were plotted at 0.6 V during 600 s (Fig. 10). In this process, after the initial current decay, Pt–Ni maintains higher current densities than the Pt, revealing their long-term stability for the oxidation of ethanol and 2-propanol.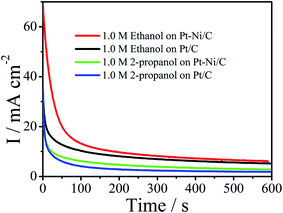 | ||
| Fig. 10 Chronoamperograms of Pt/C and Pt–Ni/C electrocatalysts in 0.1 M H2SO4 and 1.0 M ethanol or 1.0 M 2-propanol. | ||
In addition, CV cycling tests were further conducted. From this prospect, 100 cycles of cyclic voltamogrammes were applied on Pt–Ni/C in 1.0 M ethanol or 1.0 M 2-propanol + 0.1 M H2SO4 and compared to that on Pt/C (Fig. 1S†). It can be observed that in the case of ethanol the peak current density decreases by 21.8% on Pt–Ni/C, and 44% on Pt/C if compared to that of the first cycles. For 2-propanol the peak current density decreases by 24% on Pt–Ni/C, and 36% on Pt/C if compared to that of the first cycles. These results are consistent with the chronoamperometric curves in Fig. 10.
Moreover, the long-term stability of the electrocatalyst was also evaluated by measuring its CV response every week for up to 21 days (Fig. 2S†). The Pt–Ni/C electrocatalyst was stored at room temperature when it was not in use. The peak current density of both ethanol and 2-propanol retained their response integrity up to 85% after three weeks, reflecting the good stability of the electrocatalyst.
The high stability of Pt–Ni electrode can be attributed to the less poisoning on the electrode surface. This can be related to the facilitation of alcohol oxidation via oxygen-containing species (OHads) adsorbed on Ni atoms at lower potentials in comparison with Pt.
4. Conclusion
The effect of temperature on Pt and Pt–Ni electrocatalysts supported on activated graphite electrodes by a simple electrochemical deposition process was explored for ethanol and 2-propanol electrooxidation in acidic medium. The investigation was conducted by cyclic voltammetry and chronamperometry.The Pt–Ni/C electrocatalyst exhibited higher catalytic activity, better stability and tolerance to poisoning by ethanol and 2-propanol oxidation intermediate species compared to Pt/C electrocatalyst which was interpreted by synergistic and electronic effect between Pt and Ni, porous structure and high surface area. From the Arrhenius analysis, the apparent activation energies of ethanol and 2-propanol electrooxidation on Pt–Ni/C electrocatalyst are lower than those on Pt/C electrocatalyst under the same conditions. These results suggested that Pt–Ni/C can be a promising anode electrocatalyst for direct alcohol fuel cells in acidic medium.
Conflicts of interest
There are no conflicts to declare.Acknowledgements
The authors wish to thank Dr Romain Mallet and SCIAM Angers University, France, for the experiments conducted with FESEM and EDX instruments.References
- C. Lamy, A. Lima, V. Le Rhun, C. C. Delime and J. M. Leger, J. Power Sources, 2002, 105, 283 CrossRef CAS
.
- D. M. Fadzillah, S. K. Kamarudin, M. A. Zainoodin and M. S. Masdar, Int. J. Hydrogen Energy, 2019, 44, 3031 CrossRef CAS
.
- S. S. Siwal, S. Thakur, Q. B. Zhang and V. K. Thakur, Mater. Today Chem., 2019, 14, 100182 CrossRef CAS
.
- W. Li, Z. Pan, Z. Huang, Q. Zhou, Y. Xu, S. Wu, C. Chen, Y. Lin and G. Hu, Int. J. Hydrogen Energy, 2018, 43, 9777 CrossRef CAS
.
- J. N. Tiwari, R. N. Tiwari, G. Singh and K. S. Kim, Nano Energy, 2013, 2, 553 CrossRef CAS
.
- L. Gong, Z. Yang, K. Li, W. Xing, C. Liu and J. Ge, J. Energy Chem., 2018, 27, 1618 CrossRef
.
- M. Mansor, S. N. Timmiati, K. L. Lim, W. Y. Wong, S. K. Kamarudin and N. H. N. Kamarudin, Int. J. Hydrogen Energy, 2019, 44, 14744 CrossRef CAS
.
- S. P. S. Badwal, S. Giddey, A. Kulkarni, J. Goel and S. Basu, Appl Energy, 2015, 145, 80 CrossRef CAS
.
- M. Z. F Kamarudin, S. K. Kamarudin, M. S. Masdar and W. R. W. Daud, Int. J. Hydrogen Energy, 2013, 38, 9438 CrossRef
.
- L. C. Ordóñez, B. Escobar, R. Barbosa and Y. Verde-Gómez, J. Appl. Electrochem., 2015, 45, 1205 CrossRef
.
- M. A. F. Akhairi and S. K. Kamarudin, Int. J. Hydrogen Energy, 2016, 41, 4214 CrossRef CAS
.
- H. Ishitobi, Y. Ino and N. Nakagawa, Int. J. Hydrogen Energy, 2017, 42, 26897 CrossRef CAS
.
- I. A. Rodrigues and F. C. Nart, J. Electroanal. Chem., 2006, 590, 145 CrossRef CAS
.
- S. L. J. Gojković, A. V. Tripković and R. M. Stevanović, J. Serb. Chem. Soc., 2007, 72(12), 1419 CrossRef
.
- B. Habibi and E. Dadashpour, Int. J. Hydrogen Energy, 2013, 38, 5425 CrossRef CAS
.
- I. Chino, K. Hendrix, A. Keramati, O. Muneeb and J. L. Haan, Appl. Energy, 2019, 251, 113323 CrossRef CAS
.
- J. Torrero, M. A. Pena, M. Retuerto, L. Pascual and S. Rojas, Electrochim. Acta, 2019, 319, 312 CrossRef CAS
.
- M. K. L. Mendoza, B. J. V. Tongol, S. Shanmugam and H. Kim, Int. J. Hydrogen Energy, 2018, 43, 19930 CrossRef CAS
.
- F. Alcaide, G. Álvarez, P. L. Cabot, R. V. Genova-Koleva, H.-J. Grande, M. V. Martínez-Huerta and O. Miguel, J. Electroanal. Chem., 2020, 861, 113960 CrossRef CAS
.
- R. M. C. Silva, G. A. Camara and M. J. Giz, Electrochim. Acta, 2019, 308, 167 CrossRef CAS
.
- M. Sedighi, A. A. Rostami and E. Alizadeh, Int. J. Hydrogen Energy, 2017, 42(8), 4998 CrossRef CAS
.
- Y. Zhao, E. Yifeng, L. Fan, Y. Qiu and S. Yang, Electrochim. Acta, 2007, 52, 5873 CrossRef CAS
.
- Z. C. Wang, Z. M. Ma and H. L. Li, Appl. Surf. Sci., 2008, 254, 6521 CrossRef CAS
.
- M. A. Abdel Rahim, H. B. Hassan and R. M. Abdel Hameed, Fuel Cells, 2007, 7, 298 CrossRef CAS
.
- Q. Jiang, L. Jiang, S. Wang, J. Qi and G. Sun, Catal. Commun., 2010, 12, 67 CrossRef CAS
.
- S. Ali, I. Khan, S. A. Khan, M. Sohail, R. Ahmed, A. Ur Rehman, M. S. Ansari and M. A. Morsy, J. Electroanal. Chem., 2017, 795, 17 CrossRef CAS
.
- M. L. Chelaghmia, M. Nacef and A. M. Affoune, J. Appl. Electrochem., 2012, 42, 819 CrossRef CAS
.
- B. Habibi and E. Dadashpour, Electrochim. Acta, 2013, 88, 157 CrossRef CAS
.
- K. Ding, Y. Zhao, L. Liu, Y. Cao, Q. Wang, H. Gu, X. Yan and Z. Guo, Int. J. Hydrogen Energy, 2014, 39, 17622 CrossRef CAS
.
- A. E. Fetohi, R. S. Amin, R. M. Abdel Hameed and K. M. El-Khatib, Electrochim. Acta, 2017, 242, 187 CrossRef CAS
.
- P. Katikawong, T. Ratana and W. Veerasai, J. Chem. Sci., 2009, 121, 329 CrossRef CAS
.
- S. Sen Gupta, S. Singh and J. Datta, Mater. Chem. Phys., 2010, 120, 682 CrossRef CAS
.
- P. Kanninen, M. Borghei, J. Hakanpää, E. I. Kauppinen, V. Ruiz and T. Kalli, J. Electroanal. Chem., 2017, 793, 48 CrossRef CAS
.
- P. D.-S. Correa, E. L. da Silva, R. F. da Silva, C. Radtke, B. Moreno, E. Chinarro and C. d.-F. Malfatti, Int. J. Hydrogen Energy, 2012, 37, 9314 CrossRef CAS
.
- Z.-B. Wang, G.-P. Yin, J. Zhang, Y.-C. Sun and P.-F. Shi, J. Power Sources, 2006, 160, 37–43 CrossRef CAS
.
- L. Dong, Y. Wang, X. Tong and T. Lei, Diamond Relat. Mater., 2020, 104, 107739 CrossRef CAS
.
Footnote |
| † Electronic supplementary information (ESI) available. See DOI: 10.1039/d0ra07331h |
| This journal is © The Royal Society of Chemistry 2020 |

