 Open Access Article
Synthesis of Ni2+ ion doped ZnO–MWCNTs nanocomposites using an in situ sol–gel method: an ultra sensitive non-enzymatic uric acid sensing electrode material†
Sajid B. Mullania,
Anita K. Tawadec,
Shivaji N. Tayade a,
Kiran Kumar K. Sharmac,
Shamkumar P. Deshmukhab,
Navaj B. Mullanid,
Sawanta S. Malie,
Chang Kook Honge,
B. E. Kumara Swamyf and
Sagar D. Delekar
 *a
*a
aDepartment of Chemistry, Shivaji University, Kolhapur 416004, MS, India. E-mail: sddelekar7@rediffmail.com; Fax: +91 231 2692333; Tel: +91 231 2609311
bDepartment of Chemistry, D. B. F. Dayanand College of Arts and Science, Solapur 413002, MS, India
cSchool of Nanoscience and Biotechnology, Shivaji University, Kolhapur 416004, MS, India
dDepartment of Advanced Materials and Chemical Engineering, Hanyang University, ERICA, Ansan, 15588 South Korea
eDepartment of Advanced Chemical Engineering, Chonnam National University, Gwangju, 61186 South Korea
fDepartment of P.G. Studies and Research in Industrial Chemistry, Kuvempu University, Jnana Sahyadri, Shankaraghatta, Shimoga, Karnataka 577451, India
First published on 7th October 2020
Abstract
Nickel (Ni2+) ion doped zinc oxide-multi-wall carbon nanotubes (NZC) with different composition ratios of MWCNTs (from 0.01 to 0.1 wt%) are synthesized through an in situ sol–gel method. The synthesized NZC nanocomposites (NCs) are used as electrode materials with glassy carbon electrodes (GCEs) for electrochemical detection of uric acid (UA). The cyclic voltammogram of the representative NZC 0.1 modified GCE (NZC 0.1/GCE) revealed the highest electrochemical sensing activity towards the oxidation of UA at 0.37 V in 0.2 M phosphate buffer solution (PBS) having pH 7.4 ± 0.02. The limit of detection (LOD) and limit of quantification (LOQ) for the NZC 0.1/GCE are determined to be 5.72 nM and 19.00 nM (S/N = 3) respectively, which is the lowest compared to the literature values reported for enzymatic and non-enzymatic detection techniques. The synergistic effect of NZC 0.1 NCs is proposed as one of the factors for the enhanced electrochemical oxidation of UA complemented by the phase, lattice parameters, functional groups, morphology, elemental compositions, types of bonding and specific surface area with pore size ascertained using various techniques. The synthesized NZC 0.1 NCs are further proposed as selective electrode materials for the electrochemical detection of UA as authenticated further by performing interference tests with other metabolites such as ascorbic acid (AA), dopamine (DA) and D-glucose. The optimized electrochemical studies are further adopted for sensing of UA from human excretion samples using NZC 0.1 NCs.
1. Introduction
Recently, semiconducting ternary nanocomposites (NCs) have played a vital role in various fields viz. energy harvesting, sensing, supercapacitors, catalysis, electronics, biomedical, etc.1–4 Among these potential applications biosensing is a primary choice due the present need for precise identification, detection and quantification of metabolites in the complex biochemical processes of the human body and it provides a platform for easier, faster and accurate diagnosis of diseases.5 In comparison to other metal oxides, nanocrystalline zinc oxide (ZnO) has been widely used in biosensing applications due to its biocompatibility, reasonable cost, low toxicity, high electron mobility, easy synthesis, large exciton binding energy (60 meV) at room temperature, higher chemical stability, etc.6–8 To overcome these constraints, as well as to tune the properties of bare ZnO, investigators are continuously searching for different approaches such as, using binary NCs with other metal oxides9 and with carbon nanostructures,10–12 doping with metals13,14 or non metals,15,16 multicomponent hybrid systems17–19 and supporting with metals.20 Among these strategies, the focus on the doped as well as their binary/ternary ZnO-based NCs is gaining the importance due to their extraordinary properties compared to bare materials. Further, in connection to the enhancement in electrochemical properties, the NCs are to be prepared using highly conducting MWCNTs. Because the addition of MWCNTs, the charge transport properties as well as the stability of the host materials are enhanced which further, explored for sensors, supercapacitors, absorbent, photocatalytic, photovoltaic applications.21,22 Particularly the use of MWCNTs in relation to electrochemical detection of biological samples and gases using sensors or biosensors23 is multi-dimensions in terms of the sensitivity, selectivity, faster response and recovery.24 Due to the well studied properties of binary ZnO–MWCNTs NCs, therefore there is still scope for further developments with the introduction of a suitable dopant in nanocrystalline ZnO host lattice. Hence, the synergetic of doping as well as the composites formations results ternary hybrid NCs; which offers the new insights into the host ZnO semiconductor for elevated biosensing performance of biological samples.The research investigations are continuously going on the biosensing activity of ternary NCs. R. Saravanan et al. investigated the synthesis of ZnO and ZnO/Ag/Mn2O3 nanocomposite using vapor to solid mechanism using a facile thermal decomposition method and the overall synthesis protocol is tedious as well as costlier for sensing studies of uric acid (UA) and ascorbic acid (AA) sensing.17 K. Ghanbari et al. designed the electrochemical deposition of ZnO flower-like/polyaniline nanofiber/reduced graphene oxide ternary nanocomposite on GCE. In this investigation, rGO was electrochemically reduced from the graphene oxide (GO) by applying a constant cathodic potential and after that in situ electrochemical synthesis of aniline monomer performed for preparing PANI/RGO nanocomposite. Thereafter, a modified electrode was prepared by electrochemical deposition of ZnO–metal nanoparticles (NPs) in over-oxidized polyaniline film modified GCE, but the electrode deposition by the nanocomposite and its are the main hurdles in the further development.18 K. Ghanbari et al. investigated the ZnO–CuxO/polypyrrole nanocomposite modified electrode for simultaneous determination of AA, dopamine (DA) and UA. Initially, polypyrrole was electrochemically deposited on the GCE at ambient temperature and then it was further deposited with CuxO electrochemically. Thereafter, ZnO nanosheets cathodically deposited on the CuxO-PPy/GCE using aqueous solution of Zn (NO3)2 and KNO3 electrolyte bath kept at 62 °C. In the present investigation, chemical stability of Cu2O is one of the major issues and hence the present NCs would not be feasible for industrial scale applications. However, the limit of detection (LOD) value is higher than our present investigation and hence having limitation for sensing lower concentrations of an analytes.19 Xuezhong Du et al. fabricated the sensitive electrochemical sensor using RGO supported Au@Pd (Au@Pd-RGO) NCs. In this present investigation, the synergetic of higher conductivity of RGO and surface area of the Au@Pd NPs resulting the higher sensitivity as well as selectivity of NCs for simultaneous determination of AA, DA and UA. However in the present investigation, high LOD and lower linear range of UA as well as very expensive metals are the major laggings in the NCs synthesis.25 Hence, tedious protocol expensive material and sophisticated experimental approaches are the real constrains in the designing of ternary NCs. In addition, deposition of electrodes on the desired substrate and interconnectivity between the various components of the NCs are also further issues for getting the lower performance of sensing studies. Hence, to overcome these constraints, we deployed the simple, single step, wet chemical designing for the preparation of ternary NCs. During the present research endeavour, the proper connectivity between the different components as well as uniform, well adherent thin film deposition have been also focused very well. Therefore, the deposited NCs on GCE are showing the rapid and selective sensing activity of UA.
In connection to the doping studies; the introduction of appropriate metal ions in ZnO host lattice could bring significant changes in their sensing properties. Among the various dopants, Ni2+ is suitable dopant for ZnO related sensing applications because these ions have nearly same ionic radii (Ni2+ = 0.72 Å and Zn2+ = 0.74 Å) with same valence without changing in the overall structure properties, but resulting the enhanced the charge transport process useful for the electrochemical application.26 Ni2+ ions doped ZnO materials have been reported for wide range of applications, but as per our best knowledge no one has been reported for biosensing applications.27–30 Therefore, in present strategy, a combination of Ni2+ ions doped ZnO and MWCNTs will provide the required properties of an electrode material for biosensing studies.
In connection to biosensing measurement studies, various approaches are available to measure the content of UA levels; which also becomes the pre-requisite for proper diagnosis and prescription for the treatment of the various diseases related to UA. The various conventional clinical methods such as spectrophotometry, fluorometry, high-performance liquid chromatography (HPLC), capillary electrophoresis, liquid chromatography-mass spectrometry (LC-MS) etc. are used for the detection of UA.31–37 But these techniques require sophisticated, expensive instruments, skilled manpower, time consuming accompanied by low specificity, large amount of sample. Hence, there is a need for new techniques which provides simple solutions to these shortcomings. Therefore, electrochemical based sensing is a promising portable method for a rapid and precise determination of electro-active metabolites like UA at μM concentration38–40 due to their simple design, cost effectiveness, dynamic response, good selectivity, sensitivity etc.41 The property of the electro-oxidizable UA is explored for the direct quantification through two methods viz. non-enzymatic and enzymatic methods. Among them, the non-enzymatic electrochemical sensing studies have the overriding advantages such as good sensitivity, free from enzyme activity, favorable stability, simple fabrication and spacious efforts.42,43
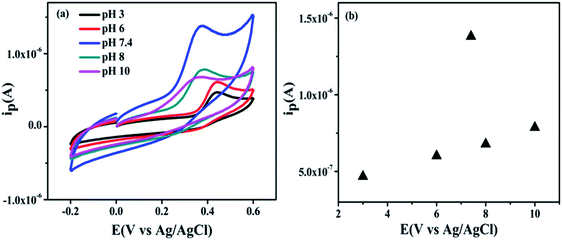
Therefore, in the present investigation, the NCs of Ni2+ ions doped ZnO NPs with MWCNTs have been chosen for non-enzymatic electrochemical sensing of UA. Further, the electrochemical sensing studies of NCs electrodes have been tested using the various parameters such as pH of buffer solution, concentration of UA, scan rate and interference from other metabolites and thereafter the optimized protocol has been used for sensing of UA from the real samples.
2. Experimental section
2.1 Synthesis of ZnO nanoparticles
The undoped ZnO NPs were prepared by using simple sol gel method. The desired amount of zinc acetate was dissolved in double distilled water (DDW). Aqueous solution of polyethylene glycol (PEG) as a capping agent was dissolved in DDW separately added into the precursor solution with constant stirring. The pH of the solution was sustained up to 10.00 ± 0.02 using aqueous NaOH solution for the formation of gel. Afterwards, the solution was stirred for 3 h at room temperature. The obtained precipitate was filtered, washed with ethanol and dried in oven at 80 °C. The dried product calcinated in air at 400 °C for 2 h to form white crystalline powder of ZnO NPs.2.2 Synthesis of nickel ions doped ZnO–MWCNTs nanocomposites
Nickel (Ni2+) ions doped ZnO–MWCNTs NCs with varying content of MWCNTs (from 0.01 to 0.1 wt%) were prepared by simple in situ sol gel method. The acid-treated MWCNTs were dispersed separately in 10 mL of DDW by ultrasonication for 15 min. The desired amount of zinc acetate was dissolved in DDW and PEG used as a capping agent dissolved separately in DDW and then added into it with constant stirring. Afterwards 5 mol% of precursor of Ni added into above solution. Finally, dispersed solution of MWCNTs added into the running synthetic route of Ni2+ ions doped ZnO NPs after the gel formation. The pH of the resulting solution was adjusted to 10 ± 0.02 using NaOH solution. The solution is stirred for 5–6 h and allowed to cool to room temperature. The black precipitate was filtered, washed with ethanol and then dried in oven at 80 °C and calcinated in air at 400 °C for 2 h. The similar protocol followed for the synthesis of Ni+2 ions doped ZnO without addition of MWCNTs.The prepared samples were labeled as ZnO NPs for ZnO; 5 NZ for 5 mol% Ni2+ ions doped ZnO and for Ni2+ ions doped ZnO NPs with MWCNTs as NZC 0.01, NZC 0.05, and NZC 0.1 with respect to the MWCNTs content of 0.01, 0.05 and 0.1 wt%, respectively.
2.3 Modification of glassy carbon electrode
Freshly prepared dispersions (1% w/v) of undoped ZnO NPs, 5 NZ or its NCs with MWCNTs (0.01 to 0.1 wt %) were prepared in ethanol. The dispersion was applied by drop casting on the GCE. The modified glassy carbon electrode was allowed to dry overnight in the vacuum desiccator.3. Result and discussion
3.1 X-ray diffraction analysis
The crystal structure and the phase purity of the synthesized undoped, doped ZnO NPs, 5 NZ and NZC (0.01 to 0.1 wt %) NCs were investigated using powder X-ray diffraction (XRD). The XRD pattern of MWCNTs Fig. 1(a) shows a sharp peak at ∼25.97° corresponding to a (002) reflection and its confirming the presence of elemental carbon (JCPDS no. 41-1487).44,45 Fig. 1(b) includes the XRD patterns of the undoped ZnO NPs, 5 NZ and NZC (0.01, 0.05, 0.1) NCs. In undoped ZnO NPs, the XRD reflections (100), (002), (101), (102), (110), (103), (200), (112), (201) corresponds to 2θ values 31.78°, 34.44°, 36.27°, 47.54°, 56.60°, 62.87°, 66.49°,67.96°, 69.10° respectively revealing the presence of hexagonal wurtzite ZnO phase (JCPDS card 36-1451).46,47 Absence of additional reflections confirm the absence of impurities Zn (OH)2 or NiO like, which indicates the single-phase nature of the synthesized products and possible substitution of Ni2+ ions into the ZnO NPs host lattice.48 The presence of sharp and intense peaks of the samples reveals the good crystalline nature having size range between 26 to 44 nm. Furthermore the most intense reflections of the 5 NZ and NZC NCs are slightly shifting to the lower angle to that of undoped ZnO NPs. Therefore, the observed result attributes the successful substitution of Ni2+ ions in host lattice of ZnO NPs.49 While, in case of NZC NCs the characteristics XRD reflections of the ZnO NPs are retained in NCs at their respective 2θ values; without characteristics reflections corresponds to MWCNTs due to their less content or lower concentration of MWCNTs in the NCs and which could not be traced out by the XRD.44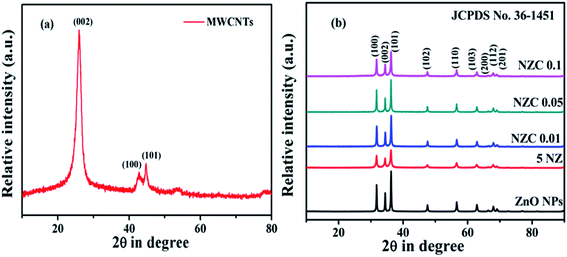 | ||
| Fig. 1 XRD diffractograms of (a) MWCNTs (b) undoped ZnO NPs, 5 NZ and NZC NCs with varying content of MWCNTs (0.01 to 0.1 wt%). | ||
In addition the close assessment of XRD patterns indicates that the intensity of XRD reflections are decreases significantly after forming NCs with MWCNTs upto NZC 0.1 NCs to that of undoped ZnO NPs. In case of 5 NZ the intensity of XRD reflections drastically reduced which is reported earlier49,50 and if consider NZC NCs only, intensity of XRD pattern reflections is enhanced significantly from NZC 0.01 to NZC 0.05 NCs and marginally decreases for NZC 0.1 NCs and this observation may highlight the limit of composition. The crystalline size can be estimated by Scherrer's formula,
 | (1) |
The existence of MWCNTs in prepared material was further confirmed by the spectroscopic characterization tools viz., FTIR, EDS and XPS analysis. The structural cell parameters of XRD patterns of the synthesized materials are reported in Table 1.
| Sample | Std. d. values (Å) | Obs. d. values (Å) | (hkl) plane | Cell parameters | ||
|---|---|---|---|---|---|---|
| a (Å) | c (Å) | V (A3) | ||||
| ZnO NPs | 2.6033 | 2.6023 | (002) | 3.2488 | 5.2046 | 54.9329 |
| 2.4759 | 2.4744 | (101) | ||||
| 1.6247 | 1.6244 | (110) | ||||
| 5 NZ | 2.6033 | 2.6050 | (002) | 3.2480 | 5.210 | 54.9629 |
| 2.4759 | 2.4760 | (101) | ||||
| 1.6247 | 1.6254 | (110) | ||||
| NZC 0.01 | 2.6033 | 2.6006 | (002) | 3.2480 | 5.2012 | 54.8700 |
| 2.4759 | 2.4728 | (101) | ||||
| 1.6247 | 1.6240 | (110) | ||||
| NZC 0.05 | 2.6033 | 2.6023 | (002) | 3.2502 | 5.2046 | 54.9803 |
| 2.4759 | 2.4768 | (101) | ||||
| 1.6247 | 1.6251 | (110) | ||||
| NZC 0.1 | 2.6033 | 2.6023 | (002) | 3.2402 | 5.2046 | 54.6425 |
| 2.4759 | 2.4752 | (101) | ||||
| 1.6247 | 1.6251 | (110) | ||||
3.2 FTIR analysis
Fig. 2 displays the FTIR spectra of the undoped ZnO NPs, 5 NZ and NZC (0.01 to 0.1 wt %) NCs. FTIR spectrum of undoped ZnO NPs consists of characteristics transmission vibrational bands viz. 600–700 cm−1 due to Zn–O stretching mode.51 The frequency region at 3000–3500 cm−1 corresponds due to the –OH functional moieties present in 5 NZ and NZC NCs.44,52 In 5 NZ , sharp stretching bands observed at 830 cm−1,51 1066 cm−1 and 1378 cm−1 corresponding to the Zn–O–Ni bonding, Ni2+ ions occupies Zn2+ sites of host lattice of ZnO NPs and presence of NO3.53,54 The shift of stretching vibration frequencies of 5 NZ and NZC NCs as compare to undoped ZnO NPs with supporting of respective sharp stretching bands indicates the substitution of Ni2+ ions in Zn2+ sites of host lattice of ZnO NPs.53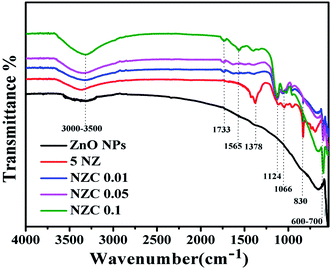 | ||
| Fig. 2 FTIR spectra of undoped ZnO NPs, 5 NZ and NZC NCs with varying content of MWCNTs (0.01 to 0.1 wt%). | ||
In FTIR patterns of the NZC NCs, along with the characteristics bands of ZnO and Ni, the additional bands are observed at bands observed at 1124 cm−1 corresponds to C–O (ester) stretching vibrations and 1565 cm−1, 1733 cm−1 stretching vibrations corresponds to C![[double bond, length as m-dash]](https://www.rsc.org/images/entities/char_e001.gif) C (carbon–carbon bonding) of sidewall framework of MWCNTs, C
C (carbon–carbon bonding) of sidewall framework of MWCNTs, C![[double bond, length as m-dash]](https://www.rsc.org/images/entities/char_e001.gif) O (carboxylic acid) groups.55 These peaks are very weak may be because of very low concentration variation of MWCNTs. Characteristics IR bands are slightly shifted in NZC NCs to that of undoped ZnO NPs. However, NZC NCs revealing the interconnectivity between the surface hydroxyl (–OH) functional group of ZnO NPs with acidic (–COOH) group of MWCNTs.
O (carboxylic acid) groups.55 These peaks are very weak may be because of very low concentration variation of MWCNTs. Characteristics IR bands are slightly shifted in NZC NCs to that of undoped ZnO NPs. However, NZC NCs revealing the interconnectivity between the surface hydroxyl (–OH) functional group of ZnO NPs with acidic (–COOH) group of MWCNTs.
3.3. FESEM analysis
Fig. 3(a–e) shows the FESEM images of the undoped ZnO NPs, 5 NZ and its NCs with varying the content of MWCNTs (0.01 to 0.1 wt%). Surface morphological analysis of the prepared materials analyzed by FESEM. The FESEM images clearly show the variation in the morphology of the ZnO NPs due to Ni2+ doping without change its original crystal structure, indicating that the incorporation of Ni2+ influences the morphology of the ZnO NPs through its involvement during nucleation and grain growth. Observed results suggests that Ni2+ ions is replacing by Zn2+ in ZnO NPs and varying its morphology.56 The varying content of MWCNTs in the Ni2+ ions doped ZnO NPs shown in Fig. 3(c–e) and it is demonstrates that Ni2+ ions doped ZnO NPs are densely covered the MWCNTs due to its very low concentration.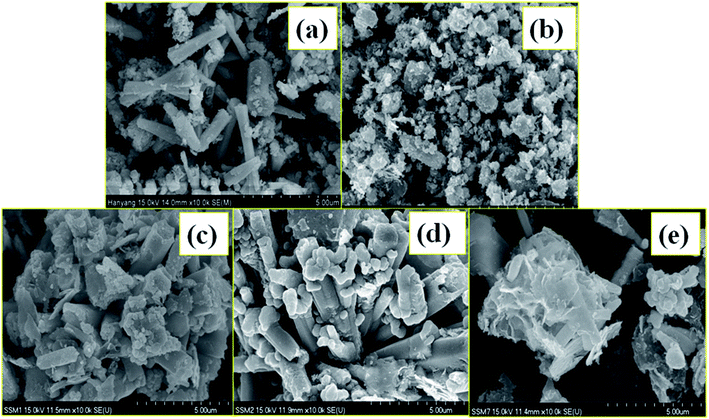 | ||
| Fig. 3 FESEM images of the (a) undoped ZnO NPs (b) 5 NZ and (c–e) NZC NCs with varying content of MWCNTs (0.01 to 0.1 wt%). | ||
3.4 EDS analysis
The elemental composition analysis of the undoped ZnO NPs, 5 NZ and its NCs with varying the content of MWCNTs (0.01 to 0.1 wt%) using EDS analysis and it is shown in Fig. 4(a–e) respectively. Fig. 4(a) shows the characteristics peaks of the elemental Zn and O and absent of the other peaks in the all patterns indicating no other impurities present in the undoped ZnO NPs. Also Fig. 4(b) confirms the existence of Ni with elemental Zn and O. Fig. 4(c–e) shows the existence of all the characteristics peaks corresponds to the elemental Zn, elemental O, elemental Ni as well as elemental C revealing the existence of all elements in the NZC NCs.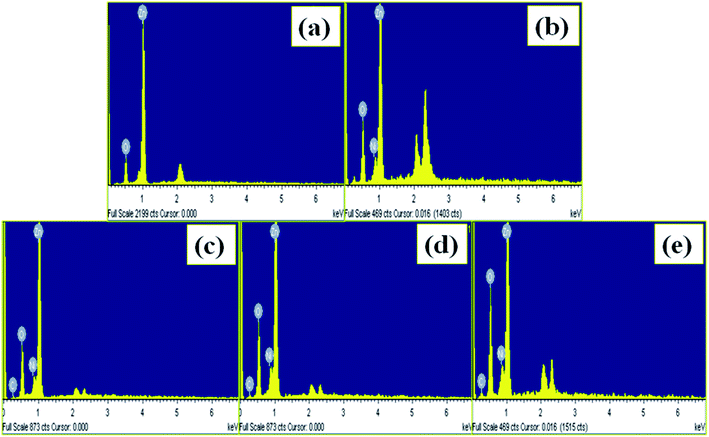 | ||
| Fig. 4 EDS spectrums of the (a) undoped ZnO NPs (b) 5 NZ and (c–e) NZC NCs with varying content of MWCNTs (0.01 to 0.1 wt%). | ||
3.5 TEM and HR-TEM with SAED analysis
Fig. 5 consists of TEM, HR-TEM and SAED images of synthesized samples. Fig. 5(a) TEM image displayed acid-modified MWCNTs without any NPs deposition reveals that the length of the MWCNTs are reduced after acid modification, since the mixed acid corroded and the functionalization decreases the weight of the MWCNTs and some defects along the side walls of the nanotubes. MWCNTs curled circular and entangled also occurred and some of them aggregated in bundles which were dispersed well in the matrix. HR-TEM i.e. Fig. 5(b) microphotographs of the acid-modified MWCNTs; demonstrate that the MWCNTs are straight. Acid-modified MWCNTs are straight and some of them aggregated in bundles and the outer diameter is 0.34 nm in size. The selected area electron diffraction (SAED) pattern [Fig. 5(c)] demonstrates the indexing of MWCNTs values are clearly matches with XRD value. Fig. 5(d–f) shows the TEM, HR-TEM image and SAED pattern of undoped ZnO NPs respectively. The TEM image clearly shows the particle sizes are in nanometer, from HR-TEM the lattice fringes width is 0.230 nm and it dominance of the (101) plane and this value closely matches with calculated d spacing values of XRD. The SAED pattern reveals distinct, clear and dotted pattern and it confirms the formation of ZnO NPs has single crystalline material in nature and indexing of SAED pattern of undoped ZnO NPs well matches with XRD data. Fig. 5(g–i) exhibits the TEM, HR-TEM and SAED pattern of NZC 0.1 NCs. The TEM and HR-TEM images, shows the Ni2+ ions doped ZnO anchored on the MWCNTs. In addition to this, in SAED pattern Fig. 5(i) demonstrate the formation of bright ring with clear dotted pattern confirms the deposited sample is polycrystalline in nature.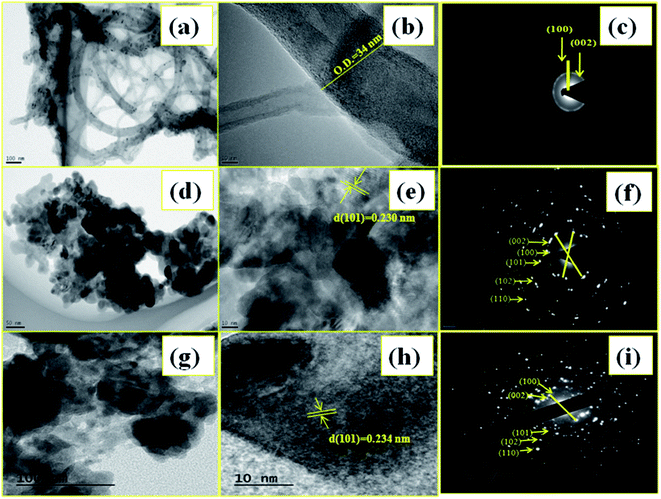 | ||
| Fig. 5 TEM (a, d and g), HR-TEM (b, e and h) with SAED (c, f and i) patterns of MWCNTs, undoped ZnO NPs and representative NZC 0.1 NCs. | ||
3.6 XPS analysis
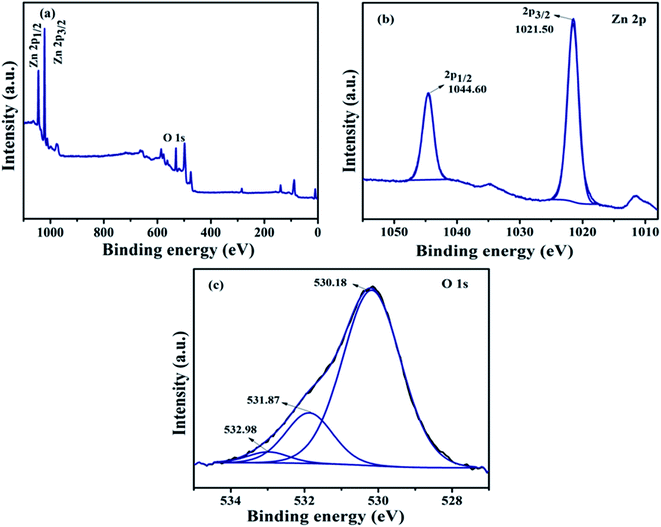
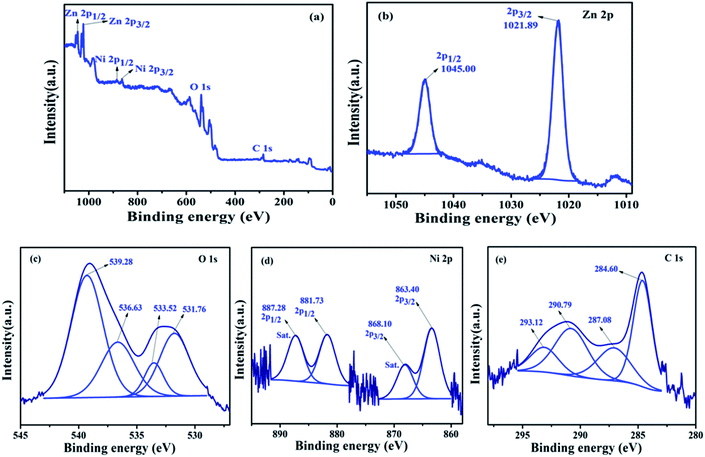
![[double bond, length as m-dash]](https://www.rsc.org/images/entities/char_e001.gif) O and O
O and O![[double bond, length as m-dash]](https://www.rsc.org/images/entities/char_e001.gif) C–O respectively.62–64
C–O respectively.62–64
3.7 Brunauer–Emmett–Teller (BET) surface area analysis
To investigate the specific areas and the porous nature of the undoped ZnO NPs and representative NZC 0.1 NCs, Brunauer–Emmett–Teller (BET) measurements were performed. Fig. 8 depicts N2 adsorption–desorption isotherms of the undoped ZnO NPs and representative NZC 0.1 NCs.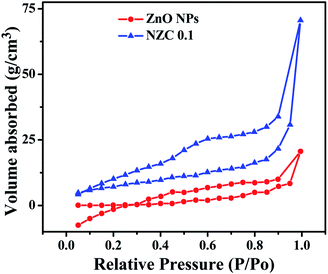 | ||
| Fig. 8 N2 adsorption–desorption isotherms of the undoped ZnO NPs and its representative NZC 0.1 NCs. | ||
Also, the total pore volume and average pore diameter of the samples were investigated by using the Barrett–Joyner–Halenda (BJH) method. Both the samples display the type IV curve accompanied by a type H3 hysteresis loop and according to the IUPAC classification, predominance of mesoporous (pores 2–50 nm diameter).65 BET surface areas of undoped ZnO NPs and representative NZC 0.1 NCs was examined to be 14.448 and 33.192 m2 g−1 respectively (Table 2). These BET analysis indicated that NZC 0.1 NCs attributes higher surface area with better mesoporous structure, which is appropriate for improved sensing performance.
| Sample | Specific surface area (m2 g−1) | Pore volume (cm3 g−1) | Pore size (nm) |
|---|---|---|---|
| ZnO NPs | 14.448 | 0.035 | 3.420 |
| NZC 0.1 | 33.192 | 0.101 | 3.828 |
3.8 EIS analysis
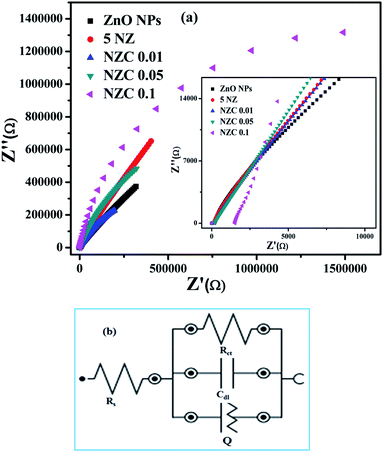
The redox electrochemical impedance spectroscopy (EIS) study has been carried out to monitor the electron transfer resistance between the modified GCE and electrolyte (ferrocene redox couple). The impedance spectra (Nyquist plots) obtained for the electrodes are presented in Fig. 9(a). While Fig. 9(b) shows the equivalent circuit used to fit impedance data.The measured EIS data fitted using NOVA 2.1.4 software to obtain the charge transfer resistance (Rct) of the modified GCE. The respective Rct values are represented in the Table 3. According to the EIS results, NZC 0.1/GCE electrode exhibit a nearly straight line with significantly lower charge transfer resistance (Rct) value interface with ferrocene (1.07 MΩ).
| Electrode | Rct (MΩ) | Error |
|---|---|---|
| GCE/ZnO NPs | 8.89 | ±0.55 |
| GCE/5 NZ | 1.10 | ±2.81 |
| GCE/NZC 0.01 | 1.68 | ±0.45 |
| GCE/NZC 0.05 | 2.46 | ±0.93 |
| GCE/NZC 0.1 | 1.07 | ±1.68 |
Observed results suggests that synthesized NZC 0.1 NCs enhanced electrochemical process of the electrode and electrolyte interface in contrast to a relatively slow electrochemical performance of undoped ZnO NPs, 5 NZ and NZC (0.01, 0.05) NCs. Therefore, from the EIS data, NZC 0.1/GCE shows lowest Rct value for efficient charge transfer at the electrode. The low Rct indicates the NZC 0.1 NCs possess high electrical conductivity and helps to enhance the electrochemical sensing activity at the surface of the NZC 0.1/GCE modified electrode.
3.9 Electrochemical study of uric acid using cyclic voltammetry technique
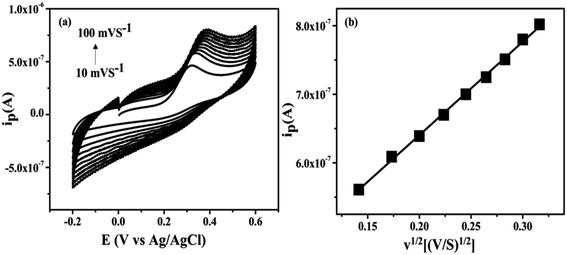
The GCE are modified with 1 mg mL−1 of the synthesized undoped ZnO NPs, 5 NZ, ZC 0.1 and NZC (0.01 to 0.1 wt%) NCs. The electrochemical sensing activity measurements were carried out in 0.2 M PBS (pH 7.4) with potential window −0.2 to 0.6 V. The UA oxidation at undoped ZnO NPs, 5 NZ, ZC 0.1 and NZC (0.01, 0.05, 0.1) NCs modified electrodes by CV measurements were conducted. Fig. 10 displays the comparative overlay CV results of UA at modified GCE. The electrochemical performance of modified electrodes in 0.2 M PBS (pH 7.4) (scan rate 50 mV s−1 and 25 × 10−4 M UA) with potential window −0.2 to 0.6 V for the NZC 0.1/GCE modified electrode exhibited a significant hike in the anodic peak as compared to other modified GCE. However NZC 0.1/GCE shows oxidation peak potential at 0.37 V with highest current response. This is attributed to the larger surface area of NZC 0.1/GCE and enhanced electron transfer rate. The results suggest, NZC 0.1/GCE NCs exhibits efficient electrochemical activity for UA. This is consistent with the higher charge transfer as observed in EIS studies [Fig. 9(a)] and high surface area of NZC 0.1 NCs.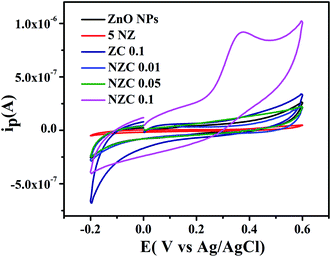 | ||
| Fig. 10 Cyclic voltammograms of undoped ZnO NPs, 5 NZ, ZC 0.1 and NZC NCs with 25 × 10−4 M UA in 0.2 M PBS (pH 7.4) at 50 mV S−1. | ||
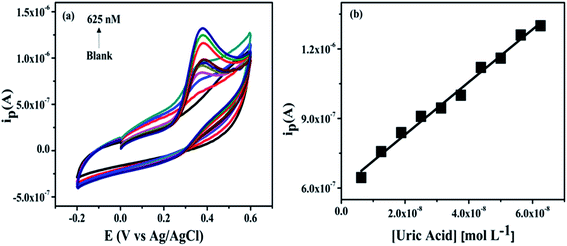 | ||
| Fig. 11 Cyclic voltammograms of various concentration of UA in 0.2 M PBS (6.25 to 625 nM) at pH 7.4 (a) and the calibration curve of oxidation peak current vs. concentration (b). | ||
The linear equation is Ipa = (1.3616 × 10⁻⁶ C + 3.6819 × 10⁻⁷) (R2 = 0.98) and LOD, LOQ in 0.2 M PBS (pH 7.4) are calculated from the following equations,
| LOD = 3SD/b | (2) |
| LOQ = 10SD/b | (3) |
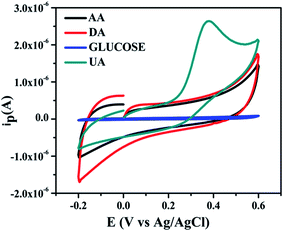 | ||
| Fig. 12 Interference test of NZC 0.1/GCE in 0.2 M 7.4 phosphate buffer 50 mV s−1 with 25 × 10−4 M UA in the presence of 0.05 mM of AA, DA and D-glucose respectively. | ||
From the experimentally obtained cyclic voltammograms, it shows no responsive signals for the AA, DA and D-glucose thus, no interference response on the redox behavior of UA at the NZC 0.1/GCE. Therefore, we conclude that NZC 0.1/GCE highly selective towards the detection of UA only. The employed NZC 0.1/GCE sensor exhibit high sensitivity and selectivity for UA. Further, this indicates that presence of minimum oxidation energy barrier to oxidation of UA without interfering species.
3.10 Determination of uric acid in human urine sample
The recovery study for UA oxidation was carried out at the NZC 0.1/GCE modified electrode in 0.2 M PBS (pH 7.4). Urine samples were collected from three volunteers. The recovery results are shown in Table 4. The analysis was carried out by differential pulse voltammetry (DPV), with the addition of UA in each sample respectively as depicted in Table 4.| Sample | Added (μM) | Found (μM) | Recovery | RSD (%) |
|---|---|---|---|---|
| 1 | 1.00 × 10⁻⁴ | 1.00 × 10⁻⁴ | 100 | 26.6 |
| 2 | 1.40 × 10⁻⁴ | 1.41 × 10⁻⁴ | 100.7 | 18.9 |
| 3 | 1.50 × 10⁻⁴ | 1.50 × 10⁻⁴ | 100 | 17.7 |
| Standard deviation 2.67 × 10⁻⁷ | ||||
The RSD values were calculated by taking three measurements of each sample and average of calculated using the following relationship. The found values were reported Table 4. The % RSD values were calculated using following relationship.
Thus, proposed sensor showed great potential for the determination of UA from human urine samples.
4. Conclusion
In present work demonstrates a successful synthesis of Ni2+ ion doped ZnO–MWCNTs nanocomposites. The electrochemical sensing activity of NZC 0.1/GCE for the oxidation of UA at 0.37 V at pH 7.4. The fabricated electrode NZC 0.1/GCE showed ultra-sensitivity for UA corresponding to LOD of 5.72 nM and LOQ of 19.00 nM. The selectivity of NZC 0.1/GCE to UA in presence of other biological metabolite species such viz. D-glucose, DA and AA is very significant. The fabricated electrode showed exceptionally high sensitivity compared with the existing enzyme immobilized UA sensors. The recovery test using human urine is encouraging. Overall, the fabricated NZC 0.1/GCE electrode is ultra-sensitive, stable, efficient recovery and reproducibility for UA detection owing to incorporation of Ni2+ ions. This fabricated electrode has potential for an ultra-sensitive UA sensor.Conflicts of interest
There are no conflicts of interest to declare.Acknowledgements
Author SBM, gratefully acknowledge to University Grants Commission, New Delhi for financial support under Basic Scientific Research scheme (UGC No. F.25-1/2014-15(BSR)/7-183/2009(BSR)-5 Nov. 2015).References
- X. Liu, J. Iocozzia, Y. Wang, X. Cui, Y. Chen, S. Zhao, Z. Li and Z. Lin, Energy Environ. Sci., 2017, 10, 402–434 RSC.
- H. Huo, C. Guo, G. Li, X. Han and C. Xu, RSC Adv., 2014, 4, 20459–20465 RSC.
- W. Wu, L. Yang, S. Chen, Y. Shao, L. Jing, G. Zhao and H. Wei, RSC Adv., 2015, 5, 91645–91653 RSC.
- Y. Liu, J. Huang and H. Li, J. Mater. Chem. B, 2013, 1, 1826–1834 RSC.
- P. Chandra, Y. N. Tan and S. P. Singh, Next generation point-of-care biomedical sensors technologies for cancer diagnosis, Springer, 2017 Search PubMed.
- A. B. Djurišić, X. Chen, Y. H. Leung and A. M. C. Ng, J. Mater. Chem., 2012, 22, 6526–6535 RSC.
- F. De Angelis and L. Armelao, Phys. Chem. Chem. Phys., 2011, 13, 467–475 RSC.
- A. K. Panigrahi, V. Singh and S. G. Singh, Analyst, 2017, 142, 2128–2135 RSC.
- C. Zhou, L. Xu, J. Song, R. Xing, S. Xu, D. Liu and H. Song, Sci. Rep., 2014, 4, 7382 CrossRef CAS.
- M. Tak, V. Gupta and M. Tomar, J. Mater. Chem. B, 2013, 1, 6392–6401 RSC.
- K. Zhao, X. Yan, Y. Gu, Z. Kang, Z. Bai, S. Cao, Y. Liu, X. Zhang and Y. Zhang, Small, 2016, 12, 245–251 CrossRef CAS.
- P. Nayak, B. Anbarasan and S. Ramaprabhu, J. Phys. Chem. C, 2013, 117, 13202–13209 CrossRef CAS.
- S. Das, S. Mukhopadhyay, S. Chatterjee, P. S. Devi and G. Suresh Kumar, ACS Omega, 2018, 3, 7494–7507 CrossRef CAS.
- C. Yang, C. Xu and X. Wang, Langmuir, 2012, 28, 4580–4585 CrossRef CAS.
- N. Muthuchamy, R. Atchudan, T. N. J. I. Edison, S. Perumal and Y. R. Lee, J. Electroanal. Chem., 2018, 816, 195–204 CrossRef CAS.
- K. Jindal, M. Tomar and V. Gupta, Analyst, 2013, 138, 4353–4362 RSC.
- R. Saravanan, M. M. Khan, V. K. Gupta, E. Mosquera, F. Gracia, V. Narayanan and A. Stephen, RSC Adv., 2015, 5, 34645–34651 RSC.
- K. Ghanbari and M. Moloudi, Anal. Biochem., 2016, 512, 91–102 CrossRef CAS.
- K. Ghanbari and N. Hajheidari, Anal. Biochem., 2015, 473, 53–62 CrossRef CAS.
- D. Pradhan, F. Niroui and K. Leung, ACS Appl. Mater. Interfaces, 2010, 2, 2409–2412 CrossRef CAS.
- R. Alshehri, A. M. Ilyas, A. Hasan, A. Arnaout, F. Ahmed and A. Memic, J. Med. Chem., 2016, 59, 8149–8167 CrossRef CAS.
- S. Mallakpour and E. Khadem, Chem. Eng. J., 2016, 302, 344–367 CrossRef CAS.
- N. G. Mphuthi, A. S. Adekunle and E. E. Ebenso, Sci. Rep., 2016, 6, 26938 CrossRef CAS.
- I. Zaporotskova, N. Boroznina, Y. Parkhomenko and L. Kozhitov, Mod. Electron. Mater., 2016, 2(4), 95–105 CrossRef.
- J. Jiang and X. Du, Nanoscale, 2014, 6, 11303–11309 RSC.
- M. Tak, V. Gupta and M. Tomar, J. Electroanal. Chem., 2017, 792, 8–14 CrossRef CAS.
- J. H. He, C. S. Lao, L. J. Chen, D. Davidovic and Z. L. Wang, J. Am. Chem. Soc., 2005, 127, 16376–16377 CrossRef.
- R. Saravanan, K. Santhi, N. Sivakumar, V. Narayanan and A. Stephen, Mater. Charact., 2012, 67, 10–16 CrossRef CAS.
- N. V. Kaneva, D. T. Dimitrov and C. D. Dushkin, Appl. Surf. Sci., 2011, 257, 8113–8120 CrossRef CAS.
- H. Colder, E. Guilmeau, C. Harnois, S. Marinel, R. Retoux and E. Savary, J. Eur. Ceram. Soc., 2011, 31, 2957–2963 CrossRef CAS.
- D. L. Rocha and F. R. Rocha, Microchem. J., 2010, 94, 53–59 CrossRef CAS.
- N. E. Azmi, N. I. Ramli, J. Abdullah, M. A. A. Hamid, H. Sidek, S. A. Rahman, N. Ariffin and N. A. Yusof, Biosens. Bioelectron., 2015, 67, 129–133 CrossRef CAS.
- D. Swinson, J. Snaith, J. Buckberry and M. Brickley, Int. J. Osteoarchaeol., 2010, 20, 135–143 CrossRef.
- W. Pormsila, S. Krähenbühl and P. C. Hauser, Anal. Chim. Acta, 2009, 636, 224–228 CrossRef CAS.
- X. Dai, X. Fang, C. Zhang, R. Xu and B. Xu, J. Chromatogr. B: Anal. Technol. Biomed. Life Sci., 2007, 857, 287–295 CrossRef CAS.
- W. Kwon, J. Y. Kim, S. Suh and M. K. In, Forensic Sci. Int., 2012, 221, 57–64 CrossRef CAS.
- S. N. Tayade, A. K. Tawade, P. Talele, S. S. Chavan and K. K. Sharma, Methods Appl. Fluoresc., 2019, 7, 045002 CrossRef CAS.
- K. Mahato, P. K. Maurya and P. Chandra, 3 Biotech, 2018, 8, 149 CrossRef.
- P. E. Erden and E. Kılıç, Talanta, 2013, 107, 312–323 CrossRef CAS.
- S. Verma, J. Choudhary, K. P. Singh, P. Chandra and S. P. Singh, Int. J. Biol. Macromol., 2019, 130, 333–341 CrossRef CAS.
- A. G. Theakstone, E. H. Doeven, X. A. Conlan, L. Dennany and P. S. Francis, Chem. Commun., 2019, 55, 7081–7084 RSC.
- X. Niu, X. Li, J. Pan, Y. He, F. Qiu and Y. Yan, RSC Adv., 2016, 6, 84893–84905 RSC.
- Z. Xu, M.-q. Zhang, H.-q. Zou, J.-s. Liu, D.-z. Wang, J. Wang and L.-d. Wang, J. Electroanal. Chem., 2019, 841, 129–134 CrossRef CAS.
- S. D. Delekar, A. G. Dhodamani, K. V. More, T. D. Dongale, R. K. Kamat, S. F. Acquah, N. S. Dalal and D. K. Panda, ACS Omega, 2018, 3, 2743–2756 CrossRef CAS.
- M.-M. Lu, W.-Q. Cao, H.-L. Shi, X.-Y. Fang, J. Yang, Z.-L. Hou, H.-B. Jin, W.-Z. Wang, J. Yuan and M.-S. Cao, J. Mater. Chem. A, 2014, 2, 10540–10547 RSC.
- I. Balti, A. Mezni, A. Dakhlaoui-Omrani, P. Leone, B. Viana, O. Brinza, L.-S. Smiri and N. Jouini, J. Phys. Chem. C, 2011, 115, 15758–15766 CrossRef CAS.
- J. Cui, J. Jiang, L. Shi, F. Zhao, D. Wang, Y. Lin and T. Xie, RSC Adv., 2016, 6, 78257–78263 RSC.
- R. S. Kumar, S. Dananjaya, M. De Zoysa and M. Yang, RSC Adv., 2016, 6, 108468–108476 RSC.
- K. Barick, M. Aslam, V. P. Dravid and D. Bahadur, J. Phys. Chem. C, 2008, 112, 15163–15170 CrossRef CAS.
- Q. Yin, W. Wu, R. Qiao, X. Ke, Y. Hu and Z. Li, RSC Adv., 2016, 6, 38653–38661 RSC.
- N. Goswami and A. Sahai, Mater. Res. Bull., 2013, 48, 346–351 CrossRef CAS.
- D. Verma, V. Sharma, G. Okram and S. Jain, Green Chem., 2017, 19, 5885–5899 RSC.
- I. B. Elkamel, N. Hamdaoui, A. Mezni, R. Ajjel and L. Beji, RSC Adv., 2018, 8, 32333–32343 RSC.
- M. Y. Ghotbi, Particuology, 2012, 10, 492–496 CrossRef CAS.
- M. J. Yee, N. Mubarak, M. Khalid, E. Abdullah and P. Jagadish, Sci. Rep., 2018, 8, 1–16 CrossRef CAS.
- A. K. Rana, Y. Kumar, P. Rajput, S. N. Jha, D. Bhattacharyya and P. M. Shirage, ACS Appl. Mater. Interfaces, 2017, 9, 7691–7700 CrossRef CAS.
- I. A. Hassan, S. Sathasivam, S. P. Nair and C. J. Carmalt, ACS Omega, 2017, 2, 4556–4562 CrossRef CAS.
- J. Wang, Y. Li, Y. Kong, J. Zhou, J. Wu, X. Wu, W. Qin, Z. Jiao and L. Jiang, RSC Adv., 2015, 5, 81024–81029 RSC.
- X. Cai, Y. Cai, Y. Liu, H. Li, F. Zhang and Y. Wang, J. Phys. Chem. Solids, 2013, 74, 1196–1203 CrossRef CAS.
- J. Hao, X. Wang, F. Liu, S. Han, J. Lian and Q. Jiang, Sci. Rep., 2017, 7, 3021 CrossRef.
- X. Huang, G. Li, B. Cao, M. Wang and C. Hao, J. Phys. Chem. C, 2009, 113, 4381–4385 CrossRef CAS.
- S. R. Ede, S. Anantharaj, K. Kumaran, S. Mishra and S. Kundu, RSC Adv., 2017, 7, 5898–5911 RSC.
- A. E. Vilian, V. Veeramani, S.-M. Chen, R. Madhu, C. H. Kwak, Y. S. Huh and Y.-K. Han, Sci. Rep., 2015, 5, 18390 CrossRef CAS.
- G. An, P. Yu, M. Xiao, Z. Liu, Z. Miao, K. Ding and L. Mao, Nanotechnology, 2008, 19, 275709 CrossRef.
- X. Xiao, B. Han, G. Chen, L. Wang and Y. Wang, Sci. Rep., 2017, 7, 40167 CrossRef CAS.
- S. Shahrokhian, M. Ghalkhani and M. K. Amini, Sens. Actuators, B, 2009, 137, 669–675 CrossRef CAS.
- B. B. Kamble, M. Naikwade, K. Garadkar, R. B. Mane, K. K. K. Sharma, B. D. Ajalkar and S. N. Tayade, J. Mater. Sci.: Mater. Electron., 2019, 30, 13984–13993 CrossRef CAS.
Footnote |
| † Electronic supplementary information (ESI) available. See DOI: 10.1039/d0ra06290a |
| This journal is © The Royal Society of Chemistry 2020 |

