 Open Access Article
Effect of CaCO3 on catalytic activity of Fe–Ce/Ti catalysts for NH3-SCR reaction
Xiaobo Wang *ab,
Qiuyue Fanga,
Jia Wang*c,
Keting Guid and
Hywel Rhys Thomasb
aSchool of Environmental Science, Nanjing Xiaozhuang University, Nanjing 211171, Jiangsu, China. E-mail: xb_wang88@126.com
bGeoenvironmental Research Centre, School of Engineering, Cardiff University, Cardiff, CF24 3AA, UK
cCollege of Chemical Engineering, Nanjing Forestry University, Nanjing 210037, Jiangsu, China. E-mail: wangjia_njfu@163.com
dSchool of Energy and Environment, Southeast University, Nanjing 210096, Jiangsu, China
First published on 20th December 2020
Abstract
In the present work, fresh and Ca poisoned Fe–Ce/Ti catalysts were prepared and used for the NH3-SCR reaction to investigate the effect of Ca doping on the catalytic activity of catalysts. And these catalysts were characterized by BET, XRD, Raman, UV-vis DRS, XPS, H2-TPR, and NH3-TPD techniques. The obtained results demonstrate that Ca doping could lead to an obvious decrease in the catalytic activity of catalysts. The reasons for this may be due to the smaller specific surface area and pore volume, the decreased ratio of Fe3+/Fe2+ and Ce3+/Ce4+, as well as the reduced redox ability and surface acidity.
Introduction
The emission of NOx from stationary sources including coal-fired power plants and industrial boilers has caused several environmental problems such as photo-chemical smog and acid rain.1,2 It has been proved that the effective technology for purifying NO emission is the selective catalytic reduction of NOx with NH3.3 At present, the widely used commercial catalysts for this process are V2O5/TiO2 and V2O5–WO3/TiO2, which can yield superior catalytic activity in the range of 300–400 °C.4 However, these catalysts also possess some disadvantages such as the toxicity of VOx to the ecosystem and the conversion of SO2 to SO3 at high temperature.5,6 Therefore, it is of great demand to develop the catalysts without the drawbacks mentioned above.For this purpose, many catalysts containing metal oxides have been found to possess high catalytic activity for SCR reaction including Fe, Ce, Mn, and Cu based catalysts.7–21 Based on our previous study, we found the Fe–Ce/Ti catalysts could exhibit high catalytic activity for the NH3-SCR reaction. However, there are several components in the real flue gases including K, Ca, CO2, and SO2, which will lead to the physical or chemical deactivation of catalysts and thus restrict the industrial application of catalysts. For the Ca poisoning on the SCR catalysts, it is reported that the catalytic activity of catalysts will display an obvious decrease when the amount of CaO reached to 2 wt% on the catalyst surface.22,23 To reveal Ca poisoning on the catalysts, much research has focused on this topic and achieved different views on it. For example, Zhu et al. found the introduction of Ca could lead to a great loss of catalytic activity over the Cu-SSZ-39 catalyst due to the decrease of acid sites and conversion of isolated Cu2+ ions to CuAlOx and CuOx species.24 Odenbrand attributed the deactivation of the V2O5–WO3/TiO2 catalyst caused by the CaSO4 to a chemical phenomenon, not the changes of the BET surface area or the pore structure of the catalyst.25 Chang et al. reported that the overoxidation of NH3 was regarded as one significant reason for the decrease of catalytic activity over the CaBr2 poisoned commercial V2O5–WO3/TiO2 catalyst.26 While Liu et al. revealed that, besides the inhibition of NH3 adsorption, the deactivation of Ca(NO3)2 poisoned Ce/TiO2 catalyst was due to the NO oxidation and suppressed NH3 activation.27 Based on the results above, it can be seen that the addition of Ca undoubtedly leads to the deactivation of catalysts. Nevertheless, the reason and behavior for the deactivation over different catalysts are different. Especially for the Fe–Ce/TiO2 catalyst, the deactivation behavior of catalysts resulted from the addition of CaCO3 is still undetermined and whether such deactivation is attributed to the physical or chemical phenomenon or both is still unclear. Furthermore, the relationship between the activity loss and the changes of textures, redox/acid properties, and surface characteristics of the CaCO3 poisoned catalysts remains lacking of report.
Therefore, in this work, the fresh Fe–Ce/Ti catalyst and the catalyst with different loading of CaCO3 were prepared and used for SCR of NO with NH3. The effect of CaCO3 on the catalytic activity of Fe–Ce/Ti catalyst was investigated and the deactivation effect caused by CaCO3 was explored by many characterization methods including BET, XRD, Raman, UV-vis DRS, XPS, H2-TPR and NH3-TPD techniques from the aspects of physicochemical properties of the catalyst.
Experimental
Catalyst preparation
Catalyst characterization
The specific surface area, pore volume and pore diameter of catalysts were obtained by N2 adsorption–desorption isotherms on an ASAP 2460 instrument at −196 °C (Micrometrics, USA).The crystal structure of catalysts was observed on a SmartLab 9 X-ray diffractometer (Cu Kα radiation, λ = 0.15418 nm) in the angle of 10–90°.
The Raman measurements were carried out on a Thermo Scientific DXR 2xi Raman spectrometer using an excitation source of laser radiation at 532 nm.
The UV-vis diffuse reflectance spectroscopy (DRS) was performed on a Shimadzu UV-3600 PC spectrophotometer with an integrating sphere at room temperature and the spectra were recorded from 200–800 nm.
The surface oxidation states of catalysts were explored by the X-ray photoelectron spectroscopy (XPS) on Thermo Fisher Scientific EXCALAB 250Xi instrument and the binding energy was calculated by a C 1s peak (284.8 eV).
The redox properties and surface acidity of catalysts were gained by H2-temperature programmed reduction experiments and NH3-temperature programmed desorption (NH3-TPD) experiments on an AutoChem II 2920 (Micromeritics, USA) chemical adsorption instrument, respectively. For each H2-TPR experiment, about 50 mg sample was used and pretreated in N2 at 300 °C for 2 h. After cooled to room temperature and stabilization, the H2-TPR data was recorded from 50–500 °C with a heating rate of 10 °C min−1. For the NH3-TPD experiments, after pretreatment of 50 mg sample in N2 at 300 °C for 2 h, the sample was cooled to 50 °C and treated with 10% NH3/He for 1 h, and followed by the He-purge for 1 h. At last, the data was collected from 50 to 500 °C at 10 °C min−1 under the He atmosphere.
Catalyst activity evaluation
The SCR catalytic activity of catalysts was evaluated using a fixed bed reactor with 5 mL catalyst in the temperature range of 120–360 °C. The simulated steam with a total flow rate of 1.5 L min−1 consisted of 500 ppm NO, 500 ppm NH3, 3% O2, and N2 as the balance. The concentrations of the outlet gases were monitored by a flue gas analyzer (RBR ECOM-J2KN) online.NO conversion was calculated according to the following equation:
 | (1) |
Results and discussions
Catalytic activity of catalysts
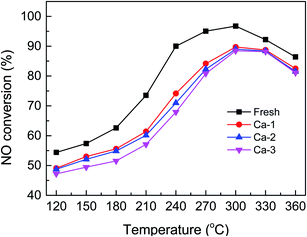
The catalytic activity of the fresh and Ca-poisoned Fe–Ce/Ti catalysts are displayed in Fig. 1. It can be seen that the fresh catalyst exhibits the best catalytic activity in the whole temperature range and more than 90% NO conversion could be obtained from 240 to 330 °C. When Ca was introduced into the Fe–Ce/Ti catalyst, the catalytic activity shows a significant decrease, indicating the deactivation occurs after Ca doping. For the Ca-1 catalyst, the highest catalytic activity is no more than 90% in the whole temperature range tested. And loading with 2% and 3% Ca lead to a more serious decrease in catalytic activity and the Ca-3 catalyst yields the lowest NO conversion, which demonstrates that the deactivation of the catalysts becomes more and more serious as the loading of Ca increases.Results of BET analysis
The N2 adsorption–desorption isotherms and pore size distributions of the fresh and Ca-poisoned catalysts are displayed in Fig. 2. All the isotherms present a typical IV curve with a hysteresis loop of H3-type, suggesting the presence of the mesopore structure of catalysts.28–30 As shown in Fig. 2(b), the pore diameters of the fresh and Ca-poisoned catalysts are all in the mesopores range of 2–30 nm and the pore diameters of catalysts are not greatly changed after the doping of different amounts of Ca. The specific surface area, pore volume and pore diameter of the fresh and different Ca-poisoned catalysts are listed in Table 1. For the fresh catalyst, the specific surface area and pore volume are 35.79 m2 g−1 and 0.14 mm3 g−1, respectively. After the doping of Ca, the specific surface area and pore volume of the Ca-poisoned catalysts both are decreased. A catalyst with a smaller specific surface area and pore volume would not provide enough and suitable active sites on the catalyst surface, which is not conducive to promote the adsorption of reactant molecules and thus can reduce the catalytic activity of the catalyst.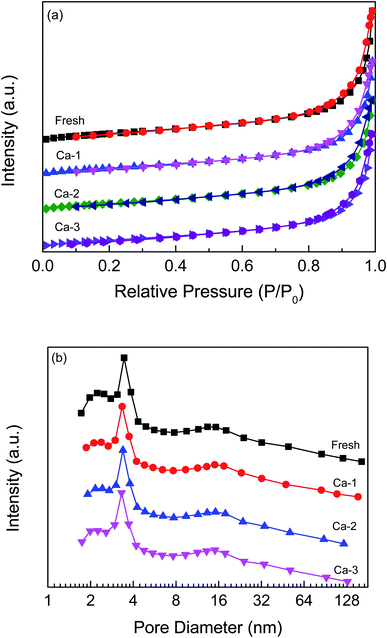 | ||
| Fig. 2 N2 adsorption–desorption isotherms (a) and pore size distributions (b) of the fresh and different Ca-poisoned catalysts. | ||
| Catalysts | SBET (m2 g−1) | Pore volume (mm3 g−1) | Pore diameter (nm) |
|---|---|---|---|
| Fresh | 35.79 | 0.14 | 14.88 |
| Ca-1 | 30.35 | 0.12 | 15.05 |
| Ca-2 | 31.33 | 0.12 | 14.51 |
| Ca-3 | 29.48 | 0.12 | 14.80 |
Results of XRD analysis
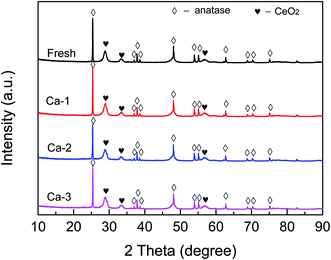
The phases structure of catalysts was detected and the results are depicted in Fig. 3. It can be seen that several strong diffraction peaks attributed to TiO2 (anatase) and CeO2 can be observed for all the catalysts. Meanwhile, no characteristic peaks of Fe species can be detected for the studied catalysts, indicating that the iron species are in an amorphous structure or dispersed well. Moreover, as listed in Table 2, the positions of (1 0 1) plane of anatase TiO2 over the fresh and Ca-poisoned catalysts are basically not changed after the doping of Ca, which indicates that the doped Ca could not interact with Ti and thus affect the crystallographic parameter of TiO2. However, compared with that of the fresh catalyst, the position of (1 1 1) plane of CeO2 over different Ca-poisoned catalysts all are shifted. The results demonstrate that the doped Ca leads to the expansion of the CeO2 crystal unit, which may be due to the Ca2+ is partly doped into the original lattice.| Catalysts | 2θ (°) | |
|---|---|---|
| TiO2 (1 0 1) plane | CeO2 (1 1 1) plane | |
| Fresh | 25.35 | 28.79 |
| Ca-1 | 25.35 | 28.81 |
| Ca-2 | 25.34 | 28.82 |
| Ca-3 | 25.35 | 28.85 |
Results of Raman analysis
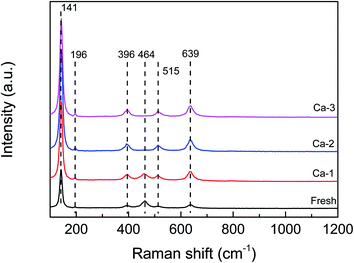
The Raman analysis was performed to detect the structural changes due to the doping of Ca and the results are displayed in Fig. 4. For the fresh catalyst, the Raman peaks at 141, 196, 396, 515 and 639 cm−1 could be observed and are ascribed to the anatase TiO2.31–33 Besides these, an obvious peak at 464 cm−1 can be detected over the fresh catalyst, which may be assigned to the F2g vibration modes of CeO2.34,35 Furthermore, no characteristic Raman peaks of Fe oxide species are observed over the fresh catalyst, indicating the Fe oxide species exist as amorphous structure or are dispersed well on the TiO2 support's surface. These results are consistent well with the XRD results. For the Ca doping catalysts, the same Raman signals attributed to the anatase TiO2 as the fresh catalyst can be observed and the intensity becomes stronger with the increase of the Ca loading, suggesting that the Ca doping could promote the crystallization of TiO2. And by contrast, the peak assigned to the CeO2 at 464 cm−1 becomes weaker and broader and even disappears with the increase of Ca loading, which may be due to the coverage of the CeO2 surface by the Ca species. Concerning the Fe oxide species, no peaks belonged to the Fe oxide species could be detected over the Ca doped catalysts either.Results of UV-vis DRS analysis
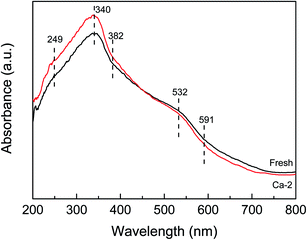
The UV-vis spectra of the fresh and Ca-2 catalysts are displayed in Fig. 5. Both of the spectra exhibit similar shapes with the same adsorption bands. The absorption band at 340 nm and that below 300nm may be attributed to the Ce4+ ← O2− and Ce3+ ← O2− charge transfer (249 nm) overlapped with the isolated Fe3+, respectively.36–39 While the absorption band at 382 nm and above 400 nm (532 and 591 nm) is ascribed to the oligomeric clusters, and large Fe2O3 particles, respectively.39,40 Despite they possess the same absorption bands, the absorption edge of the fresh and the Ca-2 catalyst is determined to be different. It is 473 nm for the fresh catalysts, while it is calculated to be 464 nm for the Ca-2 catalyst, indicating the doping of Ca will lead to an obvious blue-shift owing to the changes in the metallic species environment.41 The decreased adsorption edge may increase the energy band gap, which will not be beneficial for accelerating the oxygen transfer rate and promoting the catalytic activity of catalyst.42 Therefore, the doping of Ca leads to a higher energy band gap, which corresponds to reduced redox properties for the Ca poisoned catalysts.Results of XPS analysis
The XPS measurement was used to detect the effect of Ca doping on the chemical states of elements over the different catalysts. Fig. 6(a) displays the Fe 2p spectra of the fresh and different Ca poisoned catalyst. It can be seen that all of the spectra contained two peaks, which can be ascribed to the Fe3+ and Fe2+, respectively.6,21,43 As listed in Table 3, the ratio of Fe3+/Fe2+ over the fresh catalyst is calculated to be 1.13 from the peaking fitting result, while it is 0.81, 0.77, and 0.63 for the Ca-1, Ca-2, and Ca-3 catalyst, respectively. The redox reaction of Fe2+ + Ce4+ ↔ Fe3+ + Ce3+ can generate Fe3+ and Ce3+ and create charge imbalance over the catalyst's surface. The higher contents of Fe3+ can facilitate the oxidation of NO to NO2, which will stimulate the “fast SCR” reaction and thus promote the catalytic activity of catalysts.44,45 The XPS results show that the Fe3+ contents are greatly decreased due to the doping of Ca and the more the Ca doped, the more serious the downward trend is. The reduced Fe3+ will lower the catalytic reduction of NO and thus lead to the poor catalytic performance of catalysts.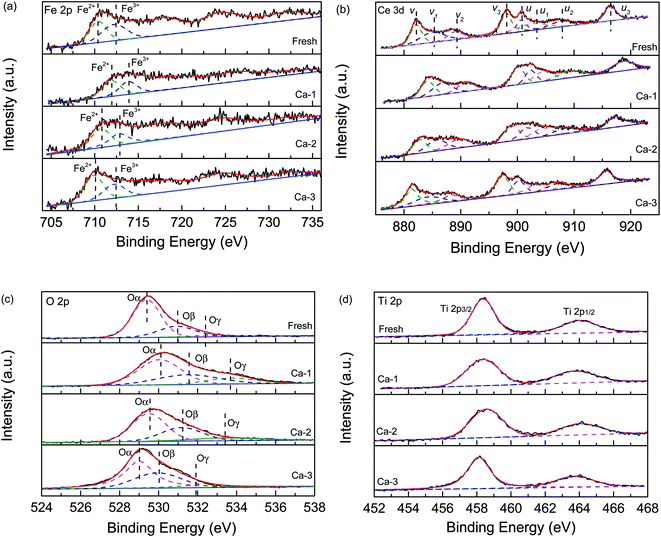 | ||
| Fig. 6 XPS spectra of the fresh and different Ca poisoned catalysts: (a) Fe 2p, (b) Ce 3d, (c) O 1s and (d) Ti 2p. | ||
| Catalysts | Fe | Ce | Ti | Ca | O | Fe3+/Fe2+ | Ce3+/Ce4+ |
|---|---|---|---|---|---|---|---|
| Fresh | 4.83 | 3.56 | 7.70 | — | 37.11 | 1.13 | 0.38 |
| Ca-1 | 3.72 | 3.07 | 6.49 | 1.67 | 35.01 | 0.81 | 0.35 |
| Ca-2 | 3.71 | 2.45 | 6.25 | 2.07 | 32.35 | 0.77 | 0.33 |
| Ca-3 | 2.52 | 2.78 | 5.67 | 2.57 | 33.78 | 0.63 | 0.29 |
The Ce 3d spectra of different catalysts are exhibited in Fig. 6(b) and all can be divided into eight sub-peaks. The sub-peaks denoted as u1 and v1 are assigned to the Ce3+, while other peaks u, u1, u2, v, v1, and v2 are related to the Ce4+.46 This result indicates that the Ce3+ and the Ce4+ are coexistence over the catalyst surface. However, as listed in Table 4, the ratio of Ce3+/Ce4+ of the four studied catalysts is different. For the fresh catalyst, it possesses the highest ratio of Ce3+/Ce4+ and the sequence of the ratio of Ce3+/Ce4+ is ranked by fresh (0.38) > Ca-1 (0.35) >Ca-2 (0.33) > Ca-3 (0.29) catalyst, which is well consistent with the catalytic activity of the catalysts. It is well known that more Ce3+ will promote the formation of oxygen vacancies and unsaturated chemical bonds via creating a charge imbalance and thus accelerate the catalytic activity of catalyst.47,48 Therefore, the decreased Ce3+ resulted from the Ca doping may be one reason for the reduced catalytic activity of the catalyst. Besides these, the Ce3+ can exert great effect on the surface acidity of catalyst and more Ce3+content will promote the adsorption of ammonia and thus enhance the catalytic activity of catalyst.48,49 This conclusion is supported by the NH3-TPD results discussed below. And this may be another reason for the decrease of catalytic performance for the Ca poisoned catalysts.
| Catalysts | Atomic ratio (%) | ||
|---|---|---|---|
| Oα/O | Oβ/O | Oγ/O | |
| Fresh | 68.99 | 26.81 | 4.20 |
| Ca-1 | 55.18 | 30.30 | 14.52 |
| Ca-2 | 55.97 | 32.73 | 11.30 |
| Ca-3 | 57.51 | 35.37 | 7.10 |
Fig. 6(c) shows the O 1s curves of the fresh and different Ca poisoned catalysts. All spectra could be separated into three peaks, which are attributed to the lattice oxygen (Oα), the surface chemisorbed oxygen (Oβ), and the adsorbed water (Oγ), respectively. And as listed in Table 4, the Oβ over the fresh catalyst is 26.81%, while this value respectively is 30.30, 32.73, and 35.37% for the Ca-1, Ca-2, and Ca-3 catalyst. These results suggest that the doping of Ca will lead to an increase of the surface chemisorbed oxygen over the catalyst's surface. It was reported that the more surface chemisorbed oxygen will facilitate the catalytic activity of catalysts than that of the lattice oxygen.50 However, it is not the case for the Ca doped catalysts. The more surface chemisorbed oxygen maybe leads to side reaction during the SCR reaction, which will result in a decrease in the catalytic performance of the catalyst. Besides this, the catalytic activity of the catalyst is affected by many other factors including textural properties, surface acidity, and redox ability.
Results of H2-TPR analysis
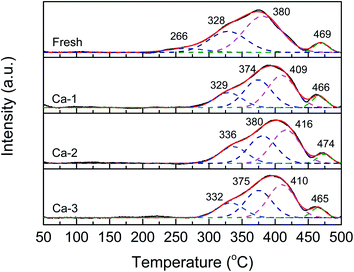
The H2-TPR profiles of the fresh and different Ca poisoned catalysts are displayed in Fig. 7. And the temperature of reduction peaks and the total H2 consumption calculated by the peak area are listed in Table 5. It can be seen from Fig. 7 that all the H2-TPR curves display the same shapes and can be divided into four reduction peaks in the temperature range of 100–500 °C, which represents the reduction of different reducible species. For the fresh catalyst, the peaks centered at 266 and 328 °C may be assigned to the reduction of surface and sub-surface Fe2O3 to Fe3O4, and the peaks at 380 and 469 °C may be ascribed to the reduction of surface CeO2 and Fe3O4 to FeO, respectively.51–55 After the doping of Ca, the H2-TPR profiles of the Ca poisoned catalysts are similar to the fresh catalyst except for the total H2 consumption and the temperature of reduction peaks. On one hand, as listed in Table 5, compared with that of the fresh catalyst, the total H2 consumption of the Ca poisoned catalysts all are decreased, suggesting the decline of the redox ability of the Ca poisoned catalysts; on the other hand, except that the temperature of the reduction peak T4 over the four investigated catalysts does not show obvious change, the positions of T1, T2, and T3 over the Ca poisoned catalysts all are shifted to higher values, indicating the active species of the Ca poisoned catalysts are more difficult to be reduced. These results demonstrate that the redox properties of the Ca poisoned catalysts are weakened, which may be another reason for the decreased catalytic activity of the Ca poisoned catalysts.| Catalysts | The temperature of reduction peaks (°C) | Total H2 consumption (a.u.) | |||
|---|---|---|---|---|---|
| T1 | T2 | T3 | T4 | ||
| Fresh | 266 | 328 | 380 | 469 | 0.89 |
| Ca-1 | 329 | 374 | 409 | 466 | 0.76 |
| Ca-2 | 336 | 380 | 416 | 474 | 0.76 |
| Ca-3 | 332 | 375 | 410 | 465 | 0.59 |
Results of NH3-TPD analysis
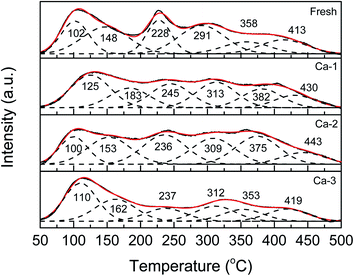
The NH3-TPD experiments were carried out to investigate the changes of surface acid sites caused by Ca doping and the results are exhibited in Fig. 8. It can be seen that all the NH3-TPD curves of the catalysts can be fitted into six sub-peaks in the whole temperature range, which are ascribed to the desorption of the weak adsorbed ammonia (<300 °C) and medium-strong adsorbed ammonia (300–500 °C), respectively.56,57 Meanwhile, compared with the fresh catalyst, the NH3-TPD curves of the Ca poisoned catalysts display obvious changes. As listed in Table 6, for one thing, the positions of the corresponding desorption peaks of the Ca poisoned catalysts all are moved to higher values, indicating NH3 become more difficult to be detached at low temperature; for another, both the weak and the medium surface acid sites of the Ca poisoned are decreased, which suggests that the Ca doping could weaken the adsorption of ammonia over the catalysts. It is well accepted that the adsorption of ammonia is crucial for the SCR reaction and the decreased surface acidity of catalysts will result in the loss of the catalytic activity of catalysts. Thus, the weakened surface acidity of catalysts due to the Ca doping may be responsible for the reduced catalytic activity of catalysts.| Catalysts | The temperature of desorption peaks (°C) | Surface acidity (mmol g−1) | |||||||
|---|---|---|---|---|---|---|---|---|---|
| Peak 1 | Peak 2 | Peak 3 | Peak 4 | Peak 5 | Peak 6 | Weak | Medium | Total | |
| Fresh | 102 | 148 | 228 | 291 | 358 | 413 | 0.54 | 0.15 | 0.69 |
| Ca-1 | 125 | 183 | 245 | 313 | 382 | 430 | 0.23 | 0.18 | 0.41 |
| Ca-2 | 100 | 153 | 236 | 309 | 375 | 443 | 0.27 | 0.24 | 0.51 |
| Ca-3 | 110 | 162 | 237 | 312 | 353 | 419 | 0.30 | 0.17 | 0.47 |
Conclusions
The fresh and different Ca poisoned Fe–Ce/Ti catalysts were synthesized and used for the NH3-SCR reaction. The experimental results show that the Ca doping will lead to a significant decrease in the catalytic activity of catalysts. And based on some physicochemical characterization results, several important conclusions can be drawn as follows:(1) The Ca doping will lead to smaller specific surface area and pore volume, which will weaken the contact of reactant molecules and active sites and thus decrease the activity of catalysts.
(2) The crystallographic parameter of TiO2 may not be affected by the Ca doping, while the CeO2 crystal unit can be expanded due to the Ca2+ is partly doped into the original CeO2 lattice.
(3) The ratios of Fe3+/Fe2+ and Ce3+/Ce4+ over the Ca poisoned catalysts both are significantly decreased, both of which will result in the drop of the catalytic activity of catalysts.
(4) The addition of Ca could weaken the redox ability and surface acidity of the Ca poisoned catalysts and thus cut down the catalytic performance of catalysts.
Funding information
The authors acknowledge financial support from the National Natural Science Foundation of China (51276039), the Natural Science Foundation of the Jiangsu Higher Education Institutions of China (17KJB610005), the Jiangsu Government Scholarship for Overseas Studies (JS-2018), and the project funded by Nanjing Xiaozhuang University (2019NXY46).Conflicts of interest
There are no conflicts to declare.References
- Q. Liang, J. Li, H. He, T. Yue and L. Tong, J. Environ. Sci., 2020, 90, 253–261 Search PubMed.
- Y. Jiang, W. Shi, C. Lai, W. Gao, L. Yang, X. Yu, Z. Yang and R. Lin, J. Energy Inst., 2020, 93, 1332–1340 Search PubMed.
- D. Wang, J. Luo, Q. Yang, J. Yan, K. Zhang, W. Zhang, Y. Peng, J. Li and J. Crittenden, Environ. Sci. Technol., 2019, 53, 6937–6944 Search PubMed.
- I. Song, H. Lee, S. W. Jeon and D. H. Kim, J. Catal., 2020, 382, 269–279 Search PubMed.
- L. Liu, K. Xu, S. Su, L. He, M. Qing, H. Chi, T. Liu, S. Hu, Y. Wang and J. Xiang, Appl. Catal., A, 2020, 592, 117413 Search PubMed.
- Y. Zeng, W. Song, Y. Wang, S. Zhang, T. Wang and Q. Zhong, J. Hazard. Mater., 2020, 383, 121212 Search PubMed.
- R. T. Guo, X. Sun, J. Liu, W. G. Pan, M. Y. Li, S. M. Liu, P. Sun and S. W. Liu, Appl. Catal., A, 2018, 558, 1–8 Search PubMed.
- B. Jia, J. Guo, H. Luo, S. Shu, N. Fang and J. Li, Appl. Catal., A, 2018, 553, 82–90 Search PubMed.
- Y. Jiang, X. Zhang, M. Lu, C. Bao, G. Liang, C. Lai, W. Shi and S. Ma, J. Taiwan Inst. Chem. Eng., 2018, 86, 133–140 Search PubMed.
- X. Leng, Z. Zhang, Y. Li, T. Zhang, S. Ma, F. Yuan, X. Niu and Y. Zhu, Fuel Process. Technol., 2018, 181, 33–43 Search PubMed.
- W. Li, C. Zhang, X. Li, P. Tan, A. Zhou, Q. Fang and G. Chen, Chin. J. Catal., 2018, 39, 1653–1663 Search PubMed.
- Y. Ma, D. Zhang, H. Sun, J. Wu, P. Liang and H. Zhang, Ind. Eng. Chem. Res., 2018, 57, 3187–3194 Search PubMed.
- C. Pang, Y. Zhuo, Q. Weng and Z. Zhu, RSC Adv., 2018, 8, 6110–6119 Search PubMed.
- T. Wang, Z. Wan, X. Yang, X. Zhang, X. Niu and B. Sun, Fuel Process. Technol., 2018, 169, 112–121 Search PubMed.
- Z. Chen, L. Liu, H. Qu, Q. Zhong and Z. Liu, Catal. Lett., 2019, 150, 514–523 Search PubMed.
- H. I. Hamoud, V. Valtchev and M. Daturi, Appl. Catal., B, 2019, 250, 419–428 Search PubMed.
- Y. Jiang, W. Shi, M. Lu, Q. Li, C. Lai, W. Gao, L. Yang and Z. Yang, Aerosol Air Qual. Res., 2019, 19, 2381–2386 Search PubMed.
- Q. Li, X. Li, W. Li, L. Zhong, C. Zhang, Q. Fang and G. Chen, Chem. Eng. J., 2019, 369, 26–34 Search PubMed.
- X. Li, J. Feng, Z. Xu, J. Wang, Y. Wang and W. Zhao, React. Kinet., Mech. Catal., 2019, 128, 163–174 Search PubMed.
- Z. Song, Y. Xing, T. Zhang, J. Zhao, J. Wang, Y. Mao, B. Zhao, X. Zhang, M. Zhao and Z. Ma, Appl. Organomet. Chem., 2019, 34, e5446 Search PubMed.
- Y. Wang, L. Xie, F. Liu and W. Ruan, J. Environ. Sci., 2019, 81, 195–204 Search PubMed.
- X. Li, X. Li, J. Chen, J. Li and J. Hao, Catal. Commun., 2016, 87, 45–48 Search PubMed.
- L. Chen, J. Li and M. Ge, Chem. Eng. J., 2011, 170, 531–537 Search PubMed.
- N. Zhu, W. Shan, Y. Shan, J. Du, Z. Lian, Y. Zhang and H. He, Chem. Eng. J., 2020, 388, 124250 Search PubMed.
- C. U. I. Odenbrand, Appl. Catal., B, 2018, 234, 365–377 Search PubMed.
- H. Chang, C. Shi, M. Li, T. Zhang, C. Wang, L. Jiang and X. Wang, Chin. J. Catal., 2018, 39, 710–717 Search PubMed.
- S. M. Liu, R. T. Guo, S. X. Wang, W. G. Pan, P. Sun, M. Y. Li and S. W. Liu, J. Taiwan Inst. Chem. Eng., 2017, 78, 290–298 Search PubMed.
- W. Zhao, Q. Zhong, T. Zhang and Y. Pan, RSC Adv., 2012, 2, 7906 Search PubMed.
- K. Zhao, J. Meng, J. Lu, Y. He, H. Huang, Z. Tang and X. Zhen, Appl. Surf. Sci., 2018, 445, 454–461 Search PubMed.
- Y. Li, Y. Li, Y. Wan, S. Zhan, Q. Guan and Y. Tian, RSC Adv., 2016, 6, 54926–54937 Search PubMed.
- Z. Wang, J. Lan, M. Haneda and Z. Liu, Catal. Today, 2020 DOI:10.1016/j.cattod.2020.05.040.
- N. Zhu, W. Shan, Z. Lian, Y. Zhang, K. Liu and H. He, J. Hazard. Mater., 2020, 382, 120970 Search PubMed.
- S. Ma, H. Tan, Y. Li, P. Wang, C. Zhao, X. Niu and Y. Zhu, Chemosphere, 2020, 243, 125309 Search PubMed.
- J. Cheng, L. Song, R. Wu, S. Li, Y. Sun, H. Zhu, W. Qiu and H. He, J. Rare Earths, 2020, 38, 59–69 Search PubMed.
- C. Xu, J. Liu, Z. Zhao, F. Yu, K. Cheng, Y. Wei, A. Duan and G. Jiang, J. Environ. Sci., 2015, 31, 74–80 Search PubMed.
- M. Zabilskiy, B. Erjavec, P. Djinović and A. Pintar, Chem. Eng. J., 2014, 254, 153–162 Search PubMed.
- A. Kambolis, H. Matralis, A. Trovarelli and C. Papadopoulou, Appl. Catal., A, 2010, 377, 16–26 Search PubMed.
- V. J. Ferreira, P. Tavares, J. L. Figueiredo and J. L. Faria, Ind. Eng. Chem. Res., 2012, 51, 10535–10541 Search PubMed.
- M. Schwidder, M. Kumar, K. Klementiev, M. Pohl, A. Bruckner and W. Grunert, J. Catal., 2005, 231, 314–330 Search PubMed.
- M. Iwasaki, K. Yamazaki, K. Banno and H. Shinjoh, J. Catal., 2008, 260, 205–216 Search PubMed.
- H. Jouini, I. Mejri, C. Petitto, J. Martinez-Ortigosa, A. Vidal-Moya, M. Mhamdi, T. Blasco and G. Delahay, Microporous Mesoporous Mater., 2018, 260, 217–226 Search PubMed.
- L. Zhong, Q. Fang, X. Li, Q. Li, C. Zhang and G. Chen, Appl. Catal., A, 2019, 579, 151–158 Search PubMed.
- N. Fang, J. Guo, S. Shu, H. Luo, Y. Chu and J. Li, Chem. Eng. J., 2017, 325, 114–123 Search PubMed.
- G. Delahay, D. Valade, A. Guzmanvargas and B. Coq, Appl. Catal., B, 2005, 55, 149–155 Search PubMed.
- F. Xia, Z. Song, X. Liu, X. Liu, Y. Yang, Q. Zhang and J. Peng, Res. Chem. Intermed., 2018, 44, 2703–2717 Search PubMed.
- N. S. Ferreira, R. S. Angélica, V. B. Marques, C. C. O. de Lima and M. S. Silva, Mater. Lett., 2016, 165, 139–142 Search PubMed.
- C. Liu, G. Gao, J.-W. Shi, C. He, G. Li, N. Bai and C. Niu, Catal. Commun., 2016, 86, 36–40 Search PubMed.
- P. Ning, Z. Song, H. Li, Q. Zhang, X. Liu, J. Zhang, X. Tang and Z. Huang, Appl. Surf. Sci., 2015, 332, 130–137 Search PubMed.
- C. Liu, L. Chen, H. Chang, L. Ma, Y. Peng, H. Arandiyan and J. Li, Catal. Commun., 2013, 40, 145–148 Search PubMed.
- L. Jiang, Q. Liu, G. Ran, M. Kong, S. Ren, J. Yang and J. Li, Chem. Eng. J., 2019, 370, 810–821 Search PubMed.
- X. Xu, J. Enchen, W. Mingfeng, L. Bosong and Z. Ling, Renewable Energy, 2012, 41, 23–28 Search PubMed.
- H. J. Wan, B. S. Wu, C. H. Zhang, H. W. Xiang, Y. W. Li, B. F. Xu and F. Yi, Catal. Commun., 2007, 8, 1538–1545 Search PubMed.
- A. P. Wimmers and J. A. Moulijn, et al., J. Phys. Chem., 1986, 90, 1331–1337 Search PubMed.
- H. Chen, Y. Xia, H. Huang, Y. Gan, X. Tao, C. Liang, J. Luo, R. Fang, J. Zhang, W. Zhang and X. Liu, Chem. Eng. J., 2017, 330, 1195–1202 Search PubMed.
- S. Yang, Y. Guo, H. Chang, L. Ma, Y. Peng, Z. Qu, N. Yan, C. Wang and J. Li, Appl. Catal., B, 2013, 136–137, 19–28 Search PubMed.
- J. Miao, H. Li, Q. Su, Y. Yu, Y. Chen, J. Chen and J. Wang, Catal. Commun., 2019, 125, 118–122 Search PubMed.
- H. Xu, Y. Li, B. Xu, Y. Cao, X. Feng, M. Sun, M. Gong and Y. Chen, J. Ind. Eng. Chem., 2016, 36, 334–345 Search PubMed.
| This journal is © The Royal Society of Chemistry 2020 |

