 Open Access Article
Frontier performance of in situ formed α-MnO2 dispersed over functionalized multi-walled carbon nanotubes covalently anchored to a graphene oxide nanosheet framework as supercapacitor materials†
Md. Mahinur Islam ,
M. Yousuf Ali Mollah,
Md. Abu Bin Hasan Susan
 and
Md. Mominul Islam
 *
*
Department of Chemistry, Faculty of Science, University of Dhaka, Dhaka 1000, Bangladesh. E-mail: mominul@du.ac.bd
First published on 21st December 2020
Abstract
α-MnO2 has been recognized as a potential material for supercapacitor applications because of its abundance, cost-effectiveness, environmental-benign nature and high theoretical specific capacitance (Csp) of 1370 F g−1. In this study, we succeeded for the first time to achieve the theoretical Csp with 3D multi-walled carbon nanotubes (MWCNTs) horizontally dispersed on 2D graphene oxide (GO) nanosheet framework-supported MnO2 ternary nanocomposites synthesized by a simple precipitation method. The in situ formation of α-MnO2 and GO, and the growth of 3D MWCNT/GO framework took place simultaneously in a strong acidic suspension containing functionalized-MWCNTs, graphite, NaNO3 and KMnO4. Characterizations of the composites synthesized by varying % wt MWCNTs were performed with state-of-the-art techniques. These composites were characterized to be semi-crystalline and mesoporous in nature, and the scrupulous analyses of field emission scanning electron microscopic images showed MnO2 nano-flower distributed over 3D MWCNTs dispersed-on-GO-nanosheet frameworks. These composites deposited on a graphite electrode exhibited an ideal supercapacitive behavior in an Na2SO4 solution measured via cyclic voltammetry and chronopotentiometry. Optimum contents of MnO2 and MWCNTs in the composites showed a maximum Csp of 1380 F g−1 with satisfactory energy and power densities compared in the Ragone plot. An ascending trend of Csp against the charge–discharge cycle number studied for 700 cycles was noticed. Well-dispersion of α-MnO2 nanoparticles throughout 3D MWCNTs covalently-anchored to the GO nanosheet framework is discussed to aid in achieving the frontier Csp of MnO2.
1. Introduction
In the past decades, the ascending demands of electrical energy for modern smart appliances have attracted considerable attention of the alternative energy storage devices such as lithium-ion batteries, capacitors and supercapacitors.1–4 Supercapacitors have been considered as the most promising energy storage protocol due to their superior specific capacitance (Csp), high power density and outstanding stability in applications.2–4 Micro-structures of metal oxides such as MnO2,5,6 RuO2,7 NiO,8 and Co3O4,9 and their hybrids10,11 have been recognized as promising supercapacitor materials. MnO2 is an environmentally friendly, inexpensive and abundant transition metal oxide, and its various allotropes have been used as molecular sieves, catalysts and electrode materials in dry cell batteries in addition to supercapacitor applications.4,12The high prospect of the α form of MnO2 in designing supercapacitor electrodes has been focused because of its high theoretical Csp of 1370 F g−1.13 The experimentalists in this field are in a kind of race to reach this milestone of theoretical Csp by attempting to tune the morphology of MnO2 using mainly carbonaceous and polymeric frameworks. Accordingly, huge numbers of research works have been published in recent years on this focal issue.14,15 The research work on MnO2 as a supercapacitor material has been launched from the work of Lee and John in 1999.16 The amorphous MnO2·H2O has been reported to show a Csp of 200 F g−1 in an aqueous KCl solution.16 Later on Liu et al. achieved a Csp of 379 F g−1 by tuning the morphology of MnO2 to form a bowl-like nanosheet with an ultra-thin thickness (ca. 4 nm) synthesized by a template-assisted hydrothermal method.15 Wang et al. have shown the influence of electrolytic media on the Csp of Mn3O4-embedded-graphene composite to be 175 F g−1 in 1.0 M Na2SO4 and 256 F g−1 in 6.0 M KOH solutions.17 It has been revealed that Csp decreases drastically as the thickness of the MnO2 film increases.13 This is reasonable since the underlying part of the nonporous material would not play the role in the charging-discharging cycle to contribute to Csp.
Recently, Huang et al. have pointed out several crucial points in fostering Csp of materials including the use of highly conductive, porous and conductive polymeric materials as the dispersing matrix.15 The researchers have succeeded to some extent by following these routes in designing efficient MnO2 composites with different frameworks to enhance Csp to, e.g., 242 F g−1 with MnO2/polyaniline (PAni) composites,18 300 F g−1 with an in situ electrodeposited PAni/MnO2 composite,19 395 F g−1 with MnO2/PAni/multi-walled carbon nanotubes (MWCNTs) composites,20 646 F g−1 with stalagmite MnO2 nanorod arrays growing vertically on flexible Ni substrates,21 752 mA h g−1 with MnO2–graphene having a sandwich structure22 and 964 F g−1 with multi-layered graphene/CNTs/MnO2 nanocomposite inter-connected pore networks.23 As far as we reviewed, the study by Jia et al. is the latest, wherein the highest Csp of MnO2 of 1229 F g−1 has been achieved by creating a special tube-on-sheet architecture of the meso-structured composite of CNT-on-MnO2 nanosheets of which the CNTs are vertically aligned on porous MnO2 nanosheets.24 This study has in fact motivated us in using MWCNTs covalently fixed on graphene oxide (GO) nanosheets as the dispersing agents for MnO2.
MWCNTs is an attractive material used in numerous applications including as a filler owing to its good electrical conductivity, high surface area, mechanical strength, chemical stability and low mass density.25,26 MWCNT itself does not meet the requirements for a commercial storage devices due to its low Csp only of 58 F g−1.27 The low Csp probably arises from the high aggregation of MWCNTs via strong hydrophobic forces that results in a poor exposure of the active site to the electrolytes.26,28 On the other hand, GO is a 2D material derived from graphite by introducing covalent C–O bonds first reported in 1855.29 Due to its ability to remain exfoliated in water as single atomic-layered sheets, cast as films, and be further reduced back to graphene, GO has been used in numerous applications as conductive films, electrode materials and composites.29
In this study, we successfully synthesized efficient ternary composites of MnO2/MWCNTs/GO by following basically two-fold molecular engineering as: (i) the dispersion of MWCNTs via the formation of an ester-like bond between the –COOH group of functionalized MWCNTs and the –OH group of GO and (ii) the dispersion of in situ formed nanoparticles of MnO2 via a precipitation method over the MWCNT/GO matrix formed simultaneously. Prior to the formation of composites, the introduction of the –COOH group on the MWCNT surface was carried out by a strong acid treatment.30 Binary composites of MnO2/GO were also prepared. The as-prepared composites were characterized with Fourier-transform infrared (FTIR) spectroscopy, field emission scanning electron microscopy (FESEM), energy dispersive X-ray spectroscopy (EDS), X-ray diffraction (XRD) and Brunauer–Emmett–Teller (BET) surface analysis techniques. The storage characteristics of the composites deposited on graphite electrodes were evaluated via cyclic voltammetry and galvanostatic charge–discharge (GCD) measurements.
2. Experimental
2.1 Chemicals and materials
Analytical-grade chemicals and materials such as potassium bromide, KBr (Sigma, Germany), graphite powder (purity: 99.975% carbon basis, particle size: <20 μm, Sigma-Aldrich, Switzerland), sodium nitrate, NaNO3 (Merck, Germany), potassium permanganate, KMnO4 (JAM, Germany), sulphuric acid, H2SO4 (Merck, Germany), hydrochloric acid, HCl (RCI, Thailand), sodium sulphate, Na2SO4 (BDH, England), MWCNTs (Sigma-Aldrich, USA), nitric acid, HNO3 (Merck, India) and poly(vinylidine fluoride), PVDF (Sigma-Aldrich, Germany) were used without any further purification. Ultrapure water (specific conductance <0.1 μS cm−1) prepared by using BOECO pure (Model-BOE 8082060, Germany) was used in this study. A graphite rod (diameter: 6.15 mm, purity: 99.99%) was purchased from Alfa Aesar, USA.2.2 Functionalization of MWCNTs
The commercial MWCNTs exist as agglomerates of several hundred micrometers.31 To segregate these MWCNT fibrils, a chemical treatment was carried out in an acidic solution. Typically, 300 mg of MWCNTs were first ultrasonicated in deionized water for 4 h to ensure their dispersion. The sonication was continued for 5 h more by adding a mixture of concentrated H2SO4 (95%) and HNO3 (65%) at a ratio of 3![[thin space (1/6-em)]](https://www.rsc.org/images/entities/char_2009.gif) :
:![[thin space (1/6-em)]](https://www.rsc.org/images/entities/char_2009.gif) 1. The mixture was then allowed to settle down and then filtered using a double ring filter paper. The solid mass was washed with deionized water until the pH of the filtrate was ca. 7.32 The thus-functionalized MWCNTs, named as F-MWCNT, were used as a precursor for the synthesis of the ternary composites under consideration.
1. The mixture was then allowed to settle down and then filtered using a double ring filter paper. The solid mass was washed with deionized water until the pH of the filtrate was ca. 7.32 The thus-functionalized MWCNTs, named as F-MWCNT, were used as a precursor for the synthesis of the ternary composites under consideration.
2.3 In situ synthesis of 3D MnO2/MWCNT/GO composites
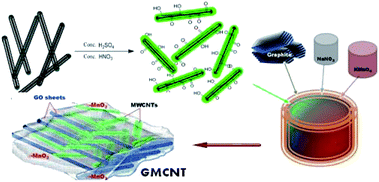
The ternary composites studied were synthesized via a chemical method,33 wherein the formation of α-MnO2 and GO as well as the formation of a 3D MWCNT/GO framework through the reaction between –OH groups of nascent GO and –COOH groups of F-MWCNT that occurred simultaneously. Typically, about 0.10 g of graphite powder as the source of GO, 0.05 g of NaNO3 and 0.015 g of F-MWCNT were mixed in 20 mL of 95% H2SO4 and the suspension was kept under a constant stirring in an ice bath. Then, 0.40 g of solid KMnO4 was gradually added to the suspension. After the addition of KMnO4, stirring was continued at 30 °C, room temperature, for 2 h. The colour of the suspension became bright brown. This brown suspension was heated, followed by an addition of 90 mL deionized water to quickly raise the temperature to ca. 100 °C. Finally, the brown suspension turned to black that was allowed to settle down overnight. After filtering out, the collected black solid mass was washed several times with deionized water to remove soluble ions. The desired product dried under vacuum was obtained as a black powder. The % weight F-MWCNT feed was 15, and the composite was named as GMCNT-15. Similarly, five composites were synthesized by varying the % weight F-MWCNT feed, as summarized in Table 1. The methods for the preparation of binary composites of MnO2/GO are described in ESI.†| Materials synthesized/treateda | Abbreviated name | % MnO2 contentb | BET characterizations | |||
|---|---|---|---|---|---|---|
| Surface area (m2 g−1) | Pore diameter (nm) | Mean pore diameter (nm) | Total pore volume (cm3 g−1) | |||
| a % represents feed amount of MWCNT.b Determined with EDS. | ||||||
| Graphene oxide | GO | — | — | — | — | — |
| GO/MnO2 | GOM | 2.50 | 4 | 1.48 | 4 | 0.004 |
| Functionalized MWCNT | F-MWCNT | — | 105 | 37.03 | 50 | 1.315 |
| 5% MWCNT + GO/MnO2 | GMCNT-5 | 0.52 | 7 | 1.86 | 12 | 0.035 |
| 10% MWCNT + GO/MnO2 | GMCNT-10 | — | 15 | 2.12 | 19 | 0.045 |
| 15% MWCNT + GO/MnO2 | GMCNT-15 | 0.75 | 14 | 2.55 | 24 | 0.085 |
| 30% MWCNT + GO/MnO2 | GMCNT-30 | 0.65 | 12 | 2.20 | 20 | 0.056 |
| 50% MWCNT + GO/MnO2 | GMCNT-50 | 0.15 | 7 | 2.29 | 14 | 0.025 |
2.4 Characterizations of the materials
The morphology, structure and chemical stability of the sample were studied via FE-SEM (JSM-7600F, JEOL, USA) using an FTIR spectrometer (Frontier FT-NIR/MIR, Perkin Elmer, USA). Surface area, pore volume and pore diameter of the as-prepared samples were analysed by N2 gas adsorption–desorption via the BET method using a BET surface analyser (Belsorpmini-II, BEL, Japan). Phase analysis and chemical characterization of the samples were carried out via XRD (Philips PW 1724) X-ray generator using an XDC-700 Guinier-Hagg focusing camera with strictly monochromatized CuKα radiation (λ = 1.540598).2.5 Electrochemical measurements
A single compartment, threeelectrode cell was used for electrochemical measurements, where the data were recorded using a computer-controlled electrochemical analyser system (Model: CHI 760E, USA). The electrochemical measurements in 0.5 M Na2SO4 electrolytic solutions were conducted using a modified graphite electrode as the working electrode, a spiral Pt wire and silver|silver chloride|saturated KCl solution [Ag|AgCl|KCl(sat.)] electrode as counter and reference electrodes, respectively. Cyclic voltammograms (CVs) were recorded in the potential range of 0.1–0.8 V at different scan rates (υ). GCD curves were recorded in the same potential range using different current densities.3. Results and discussion
3.1 Functionalization of MWCNTs and syntheses of composites
The functionalization of MWCNTs to introduce –COOH and –OH groups on the surface was carried out in a strong acidic solution comprising a mixture of concentrated H2SO4 and HNO3.31 Black powder of functionalized MWCNTs, i.e., F-MWCNT was formed via the esterification reaction (ESI†). The stability of the dispersion of F-MWCNT has been considered as an indirect measure of the degree of functionalization of MWCNTs.34 Accordingly, this was corroborated by dispersing the as-prepared F-MWCNT in water, followed by sonication for 10 min.It formed a long-standing dispersion. The thus-formed negatively charged –COOH group would repeal each other and did not allow the MWCNTs to aggregate, as in the case of pristine ones. The chemical reaction involving the formation of the ternary composite of 3D MWCNT-top-on-GO nanosheet frameworks is expressed in ESI.† The in situ formation of α-MnO2 and GO, and the growth of the 3D MWCNT/GO framework through the reaction between –OH groups of nascent GO formed instantly and –COOH groups of F-MWCNT added in a suspension containing graphite, NaNO3 and KMnO4 occur simultaneously under strong acidic conditions (Scheme 1). The binary composite of MnO2/GO was prepared in the absence of F-MWCNT.32 These materials were subjected to relevant characterizations and used to modify graphite electrodes used as supercapacitor electrodes.
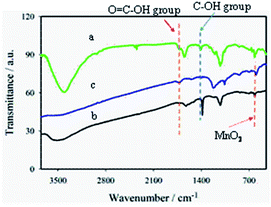
The introduction of –COOH groups on MWCNT surfaces was successful as confirmed by FTIR spectral analyses (Fig. 1a). The two characteristic bands at 1720 and 2350 cm−1 are associated with the stretching vibrations of >C![[double bond, length as m-dash]](https://www.rsc.org/images/entities/char_e001.gif) O and O–C
O and O–C![[double bond, length as m-dash]](https://www.rsc.org/images/entities/char_e001.gif) O groups, respectively, of the –COOH group.35–37 The bands at 1410 and 1227 cm−1 correspond to the O–H deformation and stretching vibration of C–O, respectively, confirming the presence of the epoxy group.38 A strong, broad band at 1590 cm−1 for the aromatic C
O groups, respectively, of the –COOH group.35–37 The bands at 1410 and 1227 cm−1 correspond to the O–H deformation and stretching vibration of C–O, respectively, confirming the presence of the epoxy group.38 A strong, broad band at 1590 cm−1 for the aromatic C![[double bond, length as m-dash]](https://www.rsc.org/images/entities/char_e001.gif) C group, confirms the presence of sp2 hybridized carbon in GO (Fig. 1b).38 Moreover, a sharp peak at 615 cm−1 for Mn–O vibration39,40 with the characteristic epoxy bands at 1405 and 1250 cm−1 for GO were also observed. The weak band at 1060 cm−1 indicates the C–OH stretching vibration of the alkoxy group for GOM composites.41–43 Thus, these oxygen-containing functional groups indicate that the graphite is oxidized to form GO.44
C group, confirms the presence of sp2 hybridized carbon in GO (Fig. 1b).38 Moreover, a sharp peak at 615 cm−1 for Mn–O vibration39,40 with the characteristic epoxy bands at 1405 and 1250 cm−1 for GO were also observed. The weak band at 1060 cm−1 indicates the C–OH stretching vibration of the alkoxy group for GOM composites.41–43 Thus, these oxygen-containing functional groups indicate that the graphite is oxidized to form GO.44
In the FTIR response typically shown for GMCNT-15, several characteristics features are noticed: (i) the blue shifts of >C![[double bond, length as m-dash]](https://www.rsc.org/images/entities/char_e001.gif) O (1728 cm−1) and the alkoxy C–OH (1076 cm−1) group of F-MWCNT, (ii) diminishing of the bands around 3450, 1450 and 1250 cm−1 associated with O–H vibration, O–H deformation, C–O epoxy stretching of chemisorbed water, respectively.38 The observed blue-shift of the band of the >C
O (1728 cm−1) and the alkoxy C–OH (1076 cm−1) group of F-MWCNT, (ii) diminishing of the bands around 3450, 1450 and 1250 cm−1 associated with O–H vibration, O–H deformation, C–O epoxy stretching of chemisorbed water, respectively.38 The observed blue-shift of the band of the >C![[double bond, length as m-dash]](https://www.rsc.org/images/entities/char_e001.gif) O group confirms the formation of an ester-linkage in the composite.45 The decrease in the intensity of the broad band between 3600 and 3000 cm−1 is indicative of the removal of chemisorbed water in GMCNT-15 through H-bonding as the O
O group confirms the formation of an ester-linkage in the composite.45 The decrease in the intensity of the broad band between 3600 and 3000 cm−1 is indicative of the removal of chemisorbed water in GMCNT-15 through H-bonding as the O![[double bond, length as m-dash]](https://www.rsc.org/images/entities/char_e001.gif) C–O bond is formed.38 The possibility of these reactions can be further supported by the studies of Jorden et al. and Luckhaus et al., where hydrogen-bonding interactions between GO and with F-MWCNT have been modelled theoretically.46,47 The extent of interactions depends on the efficiency of the insertion of F-MWCNT between the GO sheets during the in situ exfoliation process, best achieved at 15% of F-MWCNT. Thus, the –COOH group of F-MWCNT reacts with the –OH group of GO to form an ester-like linkage in this acidic environment.45 The FTIR spectra of other GMCNT composites are described in ESI.†
C–O bond is formed.38 The possibility of these reactions can be further supported by the studies of Jorden et al. and Luckhaus et al., where hydrogen-bonding interactions between GO and with F-MWCNT have been modelled theoretically.46,47 The extent of interactions depends on the efficiency of the insertion of F-MWCNT between the GO sheets during the in situ exfoliation process, best achieved at 15% of F-MWCNT. Thus, the –COOH group of F-MWCNT reacts with the –OH group of GO to form an ester-like linkage in this acidic environment.45 The FTIR spectra of other GMCNT composites are described in ESI.†
In the typical EDS response of GMCNT-15 (Fig. 2f), the characteristic peaks of Mn, C and O elements were observed. The % mass of these elements were determined by spotting on three distinct positions of the FESEM image. Similar studies for all binary and ternary composites were carried out and the values of % MnO2 are summarized in Table 1. The % MnO2 in GOM is 2.50, i.e., GOM contains about 97% of C and O species as GO. In general, the ternary composites contain a small amount of MnO2, among which GMCNT-15 contains the highest % MnO2 of 0.75. The growth of MnO2 would simultaneously take place on the surface of GO and MWCNT and inside the pores of MWCNTs, i.e., in situ formed MnO2 fills the tube of MWCNTs. Although it is not clear, the underlying MnO2 in the ternary composite including MWCNT-30 and MWCNT-50 may not be exposed for detection with EDS. Consequently, the amount of MnO2 loading was observed to decrease upon increasing the amount of MWCNTs in the ternary composite.
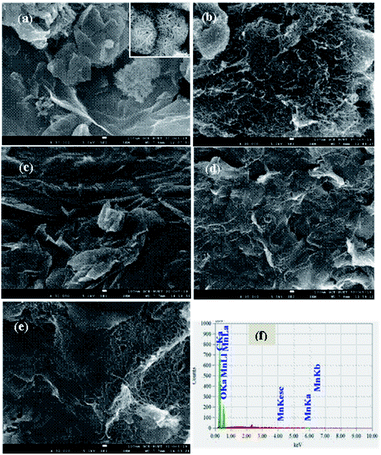 | ||
| Fig. 2 FESEM images of (a) GOM, (b) F-MWCNT, (c) GMCNT-15, (d) GMCNT-30 and (e) GMCNT-50, and (f) typical EDS spectrum of GMCNT-15. | ||
Fig. 2 illustrates FESEM images of the as-prepared materials. In the low magnification image of the GOM composite, GO nanosheets are found to be curly separated with a number amount of MnO2 nanoparticles densely deposited on their layer. The high magnification FESEM image shown in the inset clearly shows the nano-flower morphology of MnO2 particles (Fig. 2a). The FESEM image of F-MWCNT shows that MWCNTs are highly coagulated and bundled, whereas F-MWCNTs are distributed quite uniformly and MnO2 are dispersed on MWCNT and GO sheet in GMCNT-15. MWCNTs were found to reform aggregates in GMCNT-50 as in the case of F-MWCNT. The particle size distribution with the particle count of all GMCNTs, which were statistically evaluated by measuring the diameters of 100 randomly picked nanoparticles is shown in ESI.† GMCNT-15 has the highest particle counts with an average size of 10.30 nm. In GMCNT-50, there is a significant reduction in the particle count with a simultaneous increase in the average area of the particles. From these observations, it can be inferred that the functionalization of MWCNT is an effective method for preventing their agglomeration, and GO-assisted well-dispersion of MWCNTs up to their certain compositions and in situ formed MnO2 particles are uniformly distributed over the binary bed of the MWCNT/GO framework in the ternary composites.
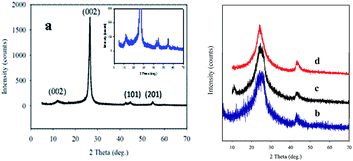
Fig. 3 represents the XRD patterns of the GMCNT composites. The sharp peak at 2θ of 26.0° is a characteristic of the (002) plane of MWCNTs.48 The characteristic peak of GO was found at 2θ = 11.9° with an interlayer distance of 0.83 nm.43 The peaks observed at 42.3 and 56.4° with a low intensity correspond to the (101) and (201) planes of α-MnO2.21,49 A decrease in the intensity is observed and the peak becomes broader as the amount of MWCNTs increases. It is worth mentioning that the shape, size and crystal planes of crystallite affect the shape of diffraction patterns (for details see ESI†). However, the crystallinity of GMCNT-5 was determined to be 90% with 13.5 nm single crystal of MWCNTs. Their degree of crystallinity and the size of crystallite decreased to become amorphous with a decrease in the feed amount of F-MWCNTs (see Table SI-1†). Most remarkably, the GMCNT-15 composite is only 17% crystalline with the crystallite size of 0.22 nm. The amorphous parts of the composite that has been reported to favour the electrolyte to insert into or to expel out from the matrix50 during the charge–discharge cycle are beneficial to increase Csp (vide infra).
As shown in Fig. SI-5,† the experimental XRD patterns of the sample matched well with the stimulated pattern of the triclinic crystal system with the P1 space group. The microstructure of the composite exhibits patterns of the oxide layer with Mn and C bridge adjacent layer into 3D architectures (Fig. SI-6†).51 Thus, the as-synthesized 3D architectures are entirely made up of randomly oriented and entangled MWCNTs with amorphous GO and in situ formed α-MnO2, as depicted in Scheme 1. Multi-covalent junctions of MWCNT such as Y-junctions were found within the entangled network structure.52 The MWCNT inter-linked with GO and in situ MnO2 via esterification by the epoxy matrix formation in the presence of a strong acid,31,53 which can be confirmed by the degree of dispersion.
The N2 gas adsorption–desorption isotherms of the composites are shown in Fig. 4. The hysteresis loop is similar to the H3 type of mesoporous materials.45,54 The BJH plots exhibit the distribution of the pore diameter. The surface parameters determined for all materials are summarized in Table 1. F-MWCNTs naturally possesses a high surface area of 105 m2 g−1 with a large pore diameter of 37 nm. Both surface area and pore diameter of MWCNTs anchored to GO nanosheets significantly decreased in the presence of MnO2 due to the disperson of MnO2 occurring not only on the surface but also inside the pores of MWCNT. It is interesting to note that when in situ formed MnO2 in the GMCNT composites was maximum the surface and pore diameter became maximum (see Table 1). For GMCNT-15, i.e., at the optimum composition of MWCNTs and MnO2, the pore diameter was maximum, which is important for the charging-discharging of a material (vide infra).
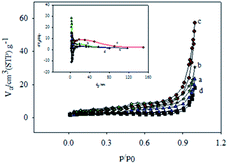 | ||
| Fig. 4 Nitrogen adsorption–desorption isotherms of (a) GMCNT-5, (b) GMCNT-10, (c) GMCNT-15 and (d) GMCNT-50 composites. Inset represents corresponding BJH plots. | ||
3.2. Charge storage performances of the composites
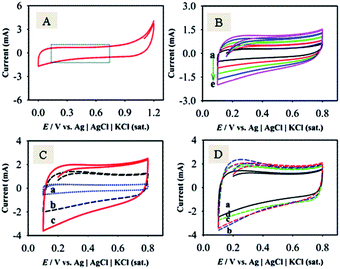
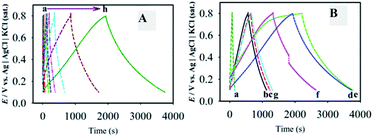
To identify the non-faradaic zone in the CVs measured with the as-synthesized material modified-graphite electrodes, the CV scan was initially performed in the potential range of 0.0–1.2 V (Fig. 5A). In the potential range of 0.1–0.8 V, an almost symmetric rectangular shape (box-shaped) response, characteristic of a non-faradaic process,55 was obtained. The shapes of CVs do not significantly change with the increase in υ from 1 to 100 mV s−1 (Fig. 5B), suggesting that the materials showed an ideal capacitive behaviour at a higher rate of charge–discharge capabilities.55 Similar studies for F-MWCNTs and GOM were also carried out as compared with GMCNT-15 (Fig. 5C). Besides other features, the currents of the CVs for GO and F-MWCNTs are about two- and four-times, respectively, lower than those for GMCNT-15. The CV responses of other composites prepared by varying % F-MWCNTs are compared in Fig. 5D. In addition, the effects of the amount of loading of GMCNT-15 on the CV response were also checked (see ESI†). In all cases, the rectangular shape of the CV response was obtained. However, this potential range chosen was employed for GCD measurements for determining Csp quantitatively.Fig. 6 shows GCD responses measured by applying constant current densities ranging from 0.5 to 20 A g−1. The observation of the symmetrical GCD response demonstrates a high reversibility between the charging and discharging processes, as observed in the case of CV studies. The increasing current density shortens the charging time as a consequence of a lower degree of alignment/insertion of solvated Na+ ions at/into the surfaces of materials forming a double layer. Ideally a longer charging time allows a high degree of insertion of solvated ions in the pore of the material, thus forming a rigid double layer.56 The discharging time of the GCD response was used to calculate the Csp as compared in Fig. 7.
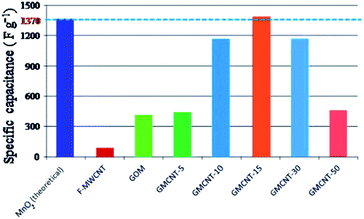 | ||
| Fig. 7 Comparison of the specific capacitance of different materials under consideration. Csp values of MnO2 (theoretical),13 MWCNTs26 and GO59 were taken from the literature. | ||
Fig. 7 illustrates the comparison of the experimental values of Csp for F-MWCNTs, GOM and GMCNTs with the theoretical value of α-MnO2. At a glance, GMCNT-15 exhibited an excellent supercapacitive behaviour with the Csp of 1380 F g−1. With the increasing amount of F-MWCNTs in the ternary composite, Csp increased initially and then decreased owing to a further increase in the % F-MWCNTs. It is rather interesting to note that Csp varies in a convex parabolic fashion against the feed amount of F-MWCNTs. The Csp of individual F-MWCNT is excessively low,26 while that of GOM binary composites was 400 F g−1 in agreement with literature.33 The combination of GOM and 5% F-MWCNTs in the GMCNT composite slightly enhanced Csp to 420 F g−1. An increase in Csp was observed by increasing the percentage of F-MWCNTs up to 15% and then Csp showed a decreasing trend in against further increase in F-MWCNTs. Csp decreased with an increase in the current density applied for the GCD measurement and the amount of material loaded (see ESI†). This decrease in Csp is due to the scarcity of the effective contact between the active surface on the electrode and electrolyte ion.56
The underlying reasons associated with frontier Csp of MnO2 obtained experimentally can easily be explained by considering the % MnO2 present and the surface characteristics of GMCNT composites as described above. MWCNT itself provides a low Csp, though it possesses a large surface area and high porosity. Pristine F-MWCNTs and GO show a purely double layer charging.26,57 Conversely, the charging of MnO2 involves a surface chemisorption of electrolyte ions, i.e., Na+ (eqn (1)), resulting in pseudo-capacitance. The charging-discharging cycle involves the rapid intercalation and de-intercalation of Na+ ions, leading to the reduction and oxidation of MnO2.13 During charging-discharging, the conversion of Mn(III) to Mn(IV)13,57 has been considered for graphene–MnO2 (ref. 33) and GO–MnO2 composites.57
| MnO2(s) + Na+(aq) + e− ⇌ MnOONa(s) | (1) |
The extent of charging and hence Csp generally depends on the amount of the accessible surface for the electrolyte ions and the amorphous nature of the oxide materials. The highly amorphous structure favours the electrolyte to insert into or to expel out from the oxide matrix.58,59 On the contrary, the active surface area and ion-permeable porosity are the keys to regulate the ion accessible surface area. The size of hydrated ions of an aqueous electrolyte is in the range of 0.60–0.76 nm. Therefore, the micropores are not suitable for the insertion of hydrated ions due to the screening effect. However, the examination of data of % MnO2 present that surface area, pore size, pore volume and degree of crystallinity GMCNT-15 possesses all the prerequisite features of an ideal supercapacitor material at their optimized levels. A moderate pore size (>2) nm is needed to maximize the electrical double layer capacitance by easy mobility and insertion of individual electrolyte ions into pores of the carbon electrodes.59 However, the pores of more than 7 nm are not suitable for the adsorption of inserted ions since they loosely bind and hence do not form a compact double layer.58,59 The surface of GMCNT-15 containing thin array of MnO2 nanoparticles with suitable pores may function for the permeation of electrolyte ions in a lock and key manner that regulates enhanced effective ion diffusion via the nano-structure-top-on GO sheets for charging-discharging through the redox reaction, as shown in eqn (1).57
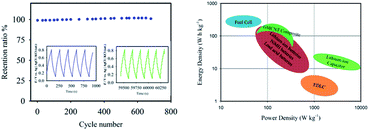
The long-term cyclic stability of GMCNT-15 was tested for 700 cycles (Fig. 8). Csp was found to increase with the cycle number. Cheng et al. have also observed this increase for MnO2 and this process is known as electro-activation.33 Upon continuous cycling, the GO sheets may move to adjust to different electrolyte ions.33 The long-time charging-discharging may also help the ions access fully the sheets of GMCNTs to extract a full advantage of the surface area. The GMCNT-15 modified hybrid electrode exhibited a high energy density of 94.6 W h kg−1 and power density of 200 W kg−1 that are derived from the GCD measurement. The Ragone plot illustrated in Fig. 8 clearly shows that GMCNT-15 can store higher energy compared to lithium-ion batteries and supercapacitors, although being pseudocapacitive in nature, it possesses lower power density than a typical electric double layer capacitor.
4. Conclusions
α-MnO2 can be well-dispersed using the 3D framework of MWCNTs horizontally dispersed on 2D GO nanosheets synthesized by a simple precipitation method. The synthesis involves a two-fold molecular engineering, wherein the in situ formation of α-MnO2 and GO and the growth of the 3D MWCNTs/GO framework through the reaction between –OH groups of nascent GO formed instantly and –COOH groups of functionalized-MWCNTs added in a suspension containing graphite, NaNO3 and KMnO4 occur simultaneously under a strong acidic condition. The ternary composites of MnO2/MWCNT/GO are semi-crystalline and mesoporous in nature and the nano-flowers of MnO2 distributed over 3D MWCNTs dispersed on GO frameworks. N2 adsorption–desorption studies suggest that GMCNT-15 has an optimum surface area of 14 m2 g−1 with a pore diameter of 2.55 nm. The MnO2/MWCNT/GO composite-modified graphite electrode showed an outstanding supercapacitive behaviour in an aqueous Na2SO4 solution studied by cyclic voltammetry and chronopotentiometry. The maximum Csp of 1380 F g−1 was obtained using an optimum amount of MnO2 and MWCNTs in the composites, which is slightly higher than the theoretical Csp of MnO2. The corresponding values of energy density and power density are 94.6 W h kg−1 and 200 W kg−1, respectively. The electrode fabricated was cycled for 700 cycles and interestingly Csp increased with an increase in the number of cycles. Thus, these composites can be practically used for fabricating low-cost, high-performance supercapacitor devices.Conflicts of interest
There are no conflicts to declare.Acknowledgements
Financial support as a special allocation for the project of “Designing Supercapacitor Materials” by the Ministry of Science and Technology, Government of the People's Republic of Bangladesh is greatly acknowledged. MMI acknowledges the financial supports in the form of fellowships from the University Grants Commission, Bangladesh and the Bose Centre for Advanced Study and Research in Natural Sciences, DU.References
- H. Hwang, D. Shin, T. Kim, S. Park, T. Yeo and W. Choi, J. Mater. Chem. A, 2018, 6, 22998–23009 Search PubMed.
- X. Lang, A. Hirata, T. Fujita and M. Chen, Nat. Nanotechnol., 2011, 6, 232–236 Search PubMed.
- K. Q. Ding, J. Chin. Chem. Soc., 2008, 55, 543–549 Search PubMed.
- T. Ohsaka, A.-N. Chowdhury, M. A. Rahman and M. M. Islam, Trends in Polyaniline Research, Nova Science Publishers, 2013, ISBN: 978-1-62808-427-6 Search PubMed.
- O. Sadak, W. Wang, J. Guan, A. K. Sundramoorthy and S. Gunasekaran, ACS Appl. Nano Mater., 2019, 2, 4386–4394 Search PubMed.
- K. Wen, G. Chen, F. Jiang, X. Zhou and J. Yang, Int. J. Electrochem. Sci., 2014, 10, 3859–3866 Search PubMed.
- Y. R. Ahn, M. Y. Song, S. M. Jo, C. R. Park and D. Y. Kim, Nanotechnology, 2006, 17, 2865–2869 Search PubMed.
- U. M. Patil, R. R. Salunkhe, K. V. Gurav and C. D. Lokhande, Appl. Surf. Sci., 2008, 255, 2603–2607 Search PubMed.
- S. G. Kandalkar, J. L. Gunjakar and C. D. Lokhande, Appl. Surf. Sci., 2008, 254, 5540–5544 Search PubMed.
- A. González, E. Goikolea, J. A. Barrena and R. Mysyk, Renewable Sustainable Energy Rev., 2016, 58, 1189–1206 Search PubMed.
- K. Sun, C. A. Riedel, A. Urbani, M. Simeoni, S. Mengali, M. Zalkovskij, B. Bilenberg, C. H. De Groot and O. L. Muskens, ACS Photonics, 2018, 5, 2280–2286 Search PubMed.
- X. Lang, A. Hirata, T. Fujita and M. Chen, Nat. Nanotechnol., 2011, 6, 232–236 Search PubMed.
- M. Toupin, T. Brousse and D. Bélanger, Chem. Mater., 2004, 16, 3184–3190 Search PubMed.
- M. Zhi, C. Xiang, J. Li, M. Li and N. Wu, Nanoscale, 2013, 5, 72–88 Search PubMed.
- M. Huang, F. Li, F. Dong, Y. X. Zhang and L. L. Zhang, J. Mater. Chem. A, 2015, 3, 21380–21423 Search PubMed.
- H. Y. Lee and J. B. Goodenough, J. Solid State Chem., 1999, 144, 220–223 Search PubMed.
- B. Wang, J. Park, C. Wang, H. Ahn and G. Wang, Electrochim. Acta, 2010, 55, 6812–6817 Search PubMed.
- H. S. Roy, M. M. Islam, M. Y. A. Mollah and M. A. B. H. Susan, Mater. Today: Proc., 2020, 29, 1013–1019 Search PubMed.
- M. G. Rabbani, M. M. Islam, M. Y. A. Mollah and M. A. B. H. Susan, Mater. Today: Proc., 2020, 1192–1198 Search PubMed.
- Y. Huang, J. Lu, S. Kang, D. Weng, L. Han and Y. Wang, Int. J. Electrochem. Sci., 2019, 14, 9298–9310 Search PubMed.
- Y. Ge, X. Wang and T. Zhao, Front. Chem., 2019, 7, 1–6 Search PubMed.
- K. Wen, G. Chen, F. Jiang, X. Zhou and J. Yang, Int. J. Electrochem. Sci., 2014, 10, 3859–3866 Search PubMed.
- C. J. Hung, P. Lin and T. Y. Tseng, J. Power Sources, 2014, 259, 145–153 Search PubMed.
- H. Jia, Y. Cai, X. Zheng, J. Lin, H. Liang, J. Qi, J. Cao, J. Feng and W. Fei, ACS Appl. Mater. Interfaces, 2018, 10, 38963–38969 Search PubMed.
- E. Grądzka and K. Winkler, in Carbon Nanotubes - Recent Progress, 2018 Search PubMed.
- F. R. Galvan, V. Barranco, J. C. Galvan and S. Batlle, Sebastian Feliu Fajardo and García, Intech, 2016, vol. i, p. 13 Search PubMed.
- L. Deng, Z. Hao, J. Wang, G. Zhu, L. Kang, Z. H. Liu, Z. Yang and Z. Wang, Electrochim. Acta, 2013, 89, 191–198 Search PubMed.
- W. Chen, Z. Fan, L. Gu, X. Bao and C. Wang, Chem. Commun., 2010, 46, 3905–3907 Search PubMed.
- D. R. Dreyer, S. Park, C. W. Bielawski and R. S. Ruoff, Chem. Soc. Rev., 2010, 39, 228–240 Search PubMed.
- S. H. Aboutalebi, A. T. Chidembo, M. Salari, K. Konstantinov, D. Wexler, H. Kun Liu and S. Xue Dou, Energy Environ. Sci., 2011, 4, 1855–1865 Search PubMed.
- S. Mallakpour and S. Soltanian, RSC Adv., 2016, 6, 109916–109935 Search PubMed.
- Y. Wang, J. Wu and F. Wei, Carbon, 2003, 41, 2939–2948 Search PubMed.
- Q. Cheng, J. Tang, J. Ma, H. Zhang, N. Shinya and L. C. Qin, Carbon, 2011, 49, 2917–2925 Search PubMed.
- M. J. Rahman and T. Mieno, J. Nanomater., 2014, 2014, 1–9 Search PubMed.
- D. S. Ahmed, A. J. Haider and M. R. Mohammad, Energy Procedia, 2013, 36, 1111–1118 Search PubMed.
- L. Stobinski, B. Lesiak, L. Kövér, J. Tóth, S. Biniak, G. Trykowski and J. Judek, J. Alloys Compd., 2010, 501, 77–84 Search PubMed.
- D. S. Ahmed, A. J. Haider and M. R. Mohammad, Energy Procedia, 2013, 36, 1111–1118 Search PubMed.
- J. D. Núñez, A. M. Benito, S. Rouzière, P. Launois, R. Arenal, P. M. Ajayan and W. K. Maser, Chem. Sci., 2017, 8, 4987–4995 Search PubMed.
- D. P. Dubal, D. S. Dhawale, R. R. Salunkhe and C. D. Lokhande, J. Electrochem. Soc., 2010, 157, A812 Search PubMed.
- C. M. Julien, M. Massot and C. Poinsignon, Spectrochim. Acta, Part A, 2004, 60, 689–700 Search PubMed.
- S. Devaraj and N. Munichandraiah, J. Phys. Chem. C, 2008, 112, 4406–4417 Search PubMed.
- D. C. Marcano, D. V. Kosynkin, J. M. Berlin, A. Sinitskii, Z. Sun, A. Slesarev, L. B. Alemany, W. Lu and J. M. Tour, ACS Nano, 2010, 4, 4806–4814 Search PubMed.
- S. Sadhukhan, T. K. Ghosh, D. Rana, I. Roy, A. Bhattacharyya, G. Sarkar, M. Chakraborty and D. Chattopadhyay, Mater. Res. Bull., 2016, 79, 41–51 Search PubMed.
- A. Gharib, L. V. Fard, N. N. Pesyan and M. Roshani, Chem. J., 2015, 1, 151–158 Search PubMed.
- H. van Bekkum, H. M. A. Buurmans, B. M. Wepster and A. M. van Wijk, Recl. Trav. Chim. Pays-Bas, 1969, 88, 301–306 Search PubMed.
- G. M. Florio, T. S. Zwier, E. M. Myshakin, K. D. Jordan and E. L. Sibert, J. Chem. Phys., 2003, 118, 1735–1746 Search PubMed.
- C. Emmeluth, M. A. Suhm and D. Luckhaus, J. Chem. Phys., 2003, 118, 2242–2255 Search PubMed.
- S. L. Chou, J. Z. Wang, S. Y. Chew, H. K. Liu and S. X. Dou, Electrochem. Commun., 2008, 10, 1724–1727 Search PubMed.
- R. Xu, X. Wang, D. Wang, K. Zhou and Y. Li, J. Catal., 2006, 237, 426–430 Search PubMed.
- H. W. Park, T. Kim, J. Huh, M. Kang, J. E. Lee and H. Yoon, ACS Nano, 2012, 6, 7624–7633 Search PubMed.
- Z. S. Yan, J. Y. Long, Q. F. Zhou, Y. Gong and J. H. Lin, Dalton Trans., 2018, 47, 5390–5405 Search PubMed.
- D. P. Hashim, N. T. Narayanan, J. M. Romo-Herrera, D. A. Cullen, M. G. Hahm, P. Lezzi, J. R. Suttle, D. Kelkhoff, E. Muñoz-Sandoval, S. Ganguli, A. K. Roy, D. J. Smith, R. Vajtai, B. G. Sumpter, V. Meunier, H. Terrones, M. Terrones and P. M. Ajayan, Sci. Rep., 2012, 2, 1–8 Search PubMed.
- K. S. Kim and S. J. Park, J. Electroanal. Chem., 2012, 673, 58–64 Search PubMed.
- R. R. Salunkhe, K. Jang, S. W. Lee, S. Yu and H. Ahn, J. Mater. Chem., 2012, 22, 21630–21635 Search PubMed.
- R. K. Gupta, J. Candler, S. Palchoudhury, K. Ramasamy and B. K. Gupta, Sci. Rep., 2015, 5, 1–11 Search PubMed.
- C. J. Hung, P. Lin and T. Y. Tseng, J. Power Sources, 2013, 243, 594–602 Search PubMed.
- M. Seredych and T. J. Bandosz, J. Mater. Chem., 2012, 22, 23525–23533 Search PubMed.
- I. Tanahashi, J. Electrochem. Soc., 1990, 137, 3052 Search PubMed.
- L. Liao and C. Pan, Soft Nanosci. Lett., 2011, 01, 16–23 Search PubMed.
Footnote |
| † Electronic supplementary information (ESI) available. See DOI: 10.1039/d0ra08772f |
| This journal is © The Royal Society of Chemistry 2020 |

