 Open Access Article
IoT-enabled dye-sensitized solar cells: an effective embedded tool for monitoring the outdoor device performance†
Themmila Khamrangab,
Marappan Velusamya,
Mohan Rameshc,
Mariadoss Asha Jhonsi d,
Madhavan Jaccob
 e,
Kanagachidambaresan Ramasubramanianf and
Arunkumar Kathiravan
 *f
*f
aDepartment of Chemistry, North Eastern Hill University, Shillong 793 022, Meghalaya, India
bDepartment of Chemistry, C. I. College, Bishnupur 795126, Manipur, India
cFunctional Materials Division, CSIR-Central Electrochemical Research Institute, Karaikudi 630 003, Tamil Nadu, India
dDepartment of Chemistry, B. S. Abdur Rahman Crescent Institute of Science and Technology, Chennai-600 048, Tamil Nadu, India
eDepartment of Chemistry & Computational Chemistry Laboratory, Loyola Institute of Frontier Energy (LIFE), Loyola College, Chennai, Tamil Nadu 600 034, India
fVel Tech Research Park, Vel Tech Rangarajan Dr Sagunthala R & D Institute of Science and Technology, Avadi, Chennai-600 062, Tamil Nadu, India. E-mail: akathir23@gmail.com
First published on 29th September 2020
Abstract
Herein, we have developed a tool for monitoring the outdoor performance of dye-sensitized solar cells. In this regard, a new dye consisting of an N-aryl-substituted imidazole with N-alkylated carbazole as the donor and cyanoacrylic acid as the acceptor has been designed. The overall power conversion efficiency of the designed dye reached ∼50%, with respect to that of the N719-based device (4%) under similar experimental conditions. Further, the device was interfaced with an IoT system, which measured the voltage and transmitted the device parameters to the user's mobile phone through a cloud channel. The developed IoT tool provides a resolution of 0.0315 mV and a round-trip delay time of <0.32 s for transmitting the information to the user's mobile phone.
Since the discovery of the first web-connected appliance in 1990, the Internet of Things (IoT) has received considerable attention.1 The IoT is a megatrend in technology that covers the entire scientific and engineering disciplines besides internet technology-affiliated communities. The IoT devices are perceived to be power efficient and small in size making them portable, and hence capable of operating in battlefields, agricultural fields, healthcare, transportation, roof top monitoring and even seismic event monitoring.2 The mode of communication can be wired or wireless, based on the need of the user, but mostly it is wireless in nature. The wireless mode creates easy mobility to the users and provides data hand to hand. The IoT devices are equipped with wireless connection facilities such as IEEE 802.11 (Wireless fidelity), IEEE 802.15.4 (Zigbee) and IEEE 802.15 (Bluetooth) protocols. These protocols help in communicating the data to the desired remote location and the data collection in many cases are cloud-interfaced. The development of IoT assures deployment of sensor networks, which obtain real-time data from the sensor nodes across the on-site areas. This design has been successfully demonstrated for water supply and management.3–5 However, numerous challenges with respect to data collection/communication/storage and device power exist, and should be overcome to make this technology suitable for practical applications. Apart from water supply and management, the IoT concept is all set for chemical and bio-sensing applications.6 For instance, Yao and later Liao et al. demonstrated a tear fluid detection with wireless transmission using a contact lens-integrated amperometric glucose biosensor. Very recently, Freitag et al. demonstrated a dye-sensitized photovoltaic device as a power source for the IoT and concluded that this concept is set to define technology for the ensuing decades.7
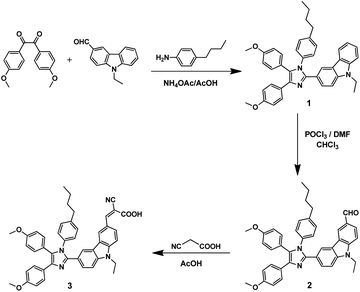
In this context, our main motivation was to monitor the outdoor performance of a dye-sensitized photovoltaic device.8–12 Consequently, we have interfaced the IoT to a dye-sensitized device fabricated using the newly synthesized dye molecule. The dye consists of an N-aryl-substituted imidazole with N-alkylated carbazole as the donor and cyanoacrylic acid as the acceptor/anchoring group (Scheme 1). The characterization results are provided in the ESI (Fig. S1–S5).† The photophysical, electrochemical and photovoltaic properties were comprehensively investigated and the obtained results are discussed. Furthermore, the real-time VOC characteristics of the device with respect to the input solar luminance were also monitored through the designed IoT module. The device was connected with a highly resistive A/D converter for recording the VOC characteristics. In addition, the round-trip delay of the near real-time monitoring was also investigated for the firebase cloud interface.
The efficient light harvesting and charge separation in the dye-sensitized semiconductor system depends on the proficient charge transfer from the donor to the acceptor unit of the dye. Hence, UV-visible absorption spectral measurements have been carried out to understand the light harvesting and type of transition type of the ICA dye. The absorption spectrum of the ICA dye was recorded in the THF solvent and is depicted in Fig. 1a. The absorption spectrum of the ICA dye consists of two major absorption peaks (maxima) in the range of 250–500 nm. Typically, the band located between 250 and 350 nm is assigned to the π–π* transition, whereas the band situated in the range of 360–460 nm corresponds to the intramolecular charge transfer (ICT) transition. Among the two types of transitions in the ICA dye, the ICT transition is considered the favourable channel for DSCs. Hence, a detailed investigation on the ICT transition is necessary before employing the ICA dye for TiO2 sensitization and photovoltaic measurements. Initially, the ICT character of the ICA dye was examined through DFT calculations. The time-dependent density functional theory (TDDFT) calculations with different functionals (B3LYP, CAM-B3LYP, M06, Wb97x, M06-2x and PBE0) were employed to find the best fit of experimental absorption with the theoretical data (Table S1†). Among the various functionals, B3LYP revealed the best fit to the experimental λmax value; hence, calculations were performed using the B3LYP functional. The computed optimized geometry of the ICA dye is displayed in inset of Fig. 1a. From the figure, it is apparent that the carbazole and cyanoacrylic acid units in the ICA dye are planar, while the imidazole unit is twisted by approximately 147° from the plane. This twisted structure can be clearly visualized from the side view of the optimized geometry (Fig. S6†). The twisted structure generally enables the efficient intramolecular charge transfer (ICT) within the dye molecule. Thus, it is believed that the ICA dye has an ICT character during light excitation. This could be easily reorganized through the frontier molecular orbitals (FMOs) of the ICA dye. Fig. 1b and c portray the computed FMOs of the ICA dye and it can be seen that the electron density of the ICA dye in the HOMO is localized mainly on the donor moiety, while the LUMO is populated with the acceptor unit. The FMO picture unambiguously divulges the ICT character of the ICA dye. Further, the molecular electrostatic potential (MESP) map has also been computed to understand the ICT nature of the ICA dye (++). The region around the imidazole unit was found to be nucleophilic with an electrostatic potential of −30.00 kcal mol−1 and the region in the vicinity of C![[double bond, length as m-dash]](https://www.rsc.org/images/entities/char_e001.gif) O and C
O and C![[triple bond, length as m-dash]](https://www.rsc.org/images/entities/char_e002.gif) N in cyanoacrylic acid exhibited a potential of −28.35 kcal mol−1 and −39.53 kcal mol−1, respectively. The only electrophilic site in the molecule was around the –OH group of carboxylic acid with an electrostatic energy of +37.65 kcal mol−1. Thus, the MESP map also endorsed the ICT character of the ICA dye.
N in cyanoacrylic acid exhibited a potential of −28.35 kcal mol−1 and −39.53 kcal mol−1, respectively. The only electrophilic site in the molecule was around the –OH group of carboxylic acid with an electrostatic energy of +37.65 kcal mol−1. Thus, the MESP map also endorsed the ICT character of the ICA dye.
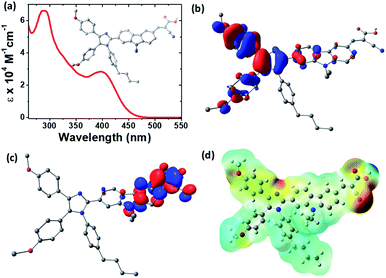 | ||
| Fig. 1 (a) Absorption spectrum of ICA dye, inset shows the optimized geometry, (b) HOMO, (c) LUMO and (d) MESP of ICA dye. | ||
Generally, the energy levels such as HOMO and LUMO of a dye are vital to understand the electron transfer characteristics towards the TiO2 conduction band. Therefore, cyclic voltammetry (CV) and differential pulse voltammetric (DPV) techniques were employed to locate the energy levels by measuring the redox potential of the dye. Fig. S7† shows the CV and DPV voltammograms of the ICA dye in the THF solvent. From the CV plot, it can be observed that there is a sharp signal at the positive potential in the range of +0.5–0.6 V vs. Ag/AgCl and the precise value of oxidation potential is acquired from the DPV plot, which shows the value of +0.62 V vs. Ag/AgCl. This clearly suggests that the ICA dye undergoes a one-electron oxidation process. Notably, even after three cycles of CV, the signal was unaltered, which proves the electrochemical stability of the ICA dye under the applied potential. The energy of HOMO with respect to the oxidation potential of the ICA dye was calculated as −5.63 eV and was found to be lower than that of the redox potential of the iodine/iodide electrolyte (−4.8 eV). This value facilitates the efficient regeneration of the ICA molecule after the injection of its electron to the TiO2 semiconductor. The absorption edge of the ICA dye was used to calculate the onset energy (Eonset) and was found to be 2.72 eV. Both HOMO and Eonset values were used to calculate the energy of LUMO and it was observed that LUMO (−2.91 eV) of the ICA dye was more negative than the conduction band of TiO2 (−4.0 eV). This definitely favours the effective electron injection from the excited ICA dye to the conduction band of TiO2. Thus, ICA dye can be a promising material for the construction of the photoanode in the DSC device.
Sensitizing the TiO2 semiconductor with a dye was the key step to develop the photoanode for DSC fabrication. A primary process in the photoanode upon photoexcitation is the electron injection and this process entirely depends on the dye binding as well as light harvesting properties of the material. In order to understand such properties of ICA on the TiO2 surface, ∼4 micron thickness TiO2 films were prepared from a commercially available titania paste (Solaronix SA, Ti-Nanoxide HT/SC series). The films were sensitized in 0.3 mM ICA dye in THF solvent at room temperature for 1 h. The normalized absorption spectrum of ICA-anchored TiO2 thin film is displayed in Fig. 2a. As compared to the solution absorption spectrum, the ICA dye showed broad absorption with a bathochromic shift, which is typically due to the J-type aggregation of the dye.13 This would be beneficial to enhance the light harvesting efficiency of the ICA dye on the TiO2 surface. However, the absorption spectrum of ICA on TiO2 got blue shifted at lower concentration (0.03 mM). The observed blue shift was perhaps due to the H-aggregation or deprotonation of the carboxylic group. To establish whether the blue shift in the absorption spectrum is due to aggregation or deprotonation, we have compared the absorption spectra of 0.03 mM ICA/TiO2 and ICA in triethylamine (TEA). The main intention of introducing TEA to the solution of ICA dye was to deprotonate carboxylic acid,14,15 and as a result, it would weaken the electron-pulling strength of the acceptor moiety (–C![[triple bond, length as m-dash]](https://www.rsc.org/images/entities/char_e002.gif) N), which in turn may alter the ICT band of the ICA dye. Fig. 2a clearly shows that the absorption maxima of 0.03 mM ICA/TiO2 and ICA/TEA are identical, and this confirms that the blue shift in the absorption spectrum is due to the deprotonation of the carboxylic group and not due to aggregation. Further, the constructed LHE spectra of the ICA-sensitized TiO2 films in two different concentrations are shown in Fig. 2b. The calculated Γ values were 3.45 × 10⁻⁸ and 2.49 × 10⁻⁸ mol cm−2 for high and low ICA dye concentrations, respectively. Based on the results, high concentration of ICA dye exhibited notable LHE (90%) and Γ values. Thus, a high concentration of ICA dye is recommended for photovoltaic applications.
N), which in turn may alter the ICT band of the ICA dye. Fig. 2a clearly shows that the absorption maxima of 0.03 mM ICA/TiO2 and ICA/TEA are identical, and this confirms that the blue shift in the absorption spectrum is due to the deprotonation of the carboxylic group and not due to aggregation. Further, the constructed LHE spectra of the ICA-sensitized TiO2 films in two different concentrations are shown in Fig. 2b. The calculated Γ values were 3.45 × 10⁻⁸ and 2.49 × 10⁻⁸ mol cm−2 for high and low ICA dye concentrations, respectively. Based on the results, high concentration of ICA dye exhibited notable LHE (90%) and Γ values. Thus, a high concentration of ICA dye is recommended for photovoltaic applications.
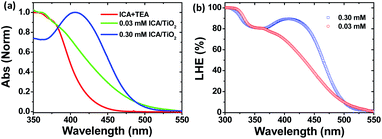 | ||
| Fig. 2 (a) Normalized absorption spectra of ICA in TEA and titania surface, (b) LHE spectra of ICA-sensitized TiO2 films. | ||
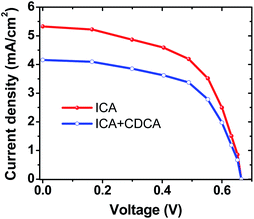
The LHE of ICA in the region from 400 nm to 520 nm, indicated that the ICA-sensitized TiO2 device would generate the photocurrent. Hence, the photocurrent density–photovoltage (J–V) curve measurement was performed under simulated AM 1.5 solar irradiation (100 mW cm−2) and is shown in Fig. 3. The complete device fabrication details are given in the ESIn.† The photovoltaic parameters of the ICA device are summarized in Table S2.† The device based on the ICA dye shows an efficiency of 2.04%, with a short-circuit photocurrent density (JSC) of 5.26 mA cm−2, an open-circuit photovoltage (VOC) of 0.58 V, and a fill factor (FF) of 0.66. For a fair comparison, the N719-sensitized DSC was also fabricated under the same conditions and yielded an η value of 4%. Conspicuously, the overall conversion efficiency of the ICA dye reached 51% with respect to the N719 dye. The efficacy of the ICA dye is also compared with previously reported carbazole derivatives16–18 (Table S3†). Further, structural optimization such as expanding absorption spectra to include more of the visible region and tuning HOMO/LUMO energy levels are expected to produce more efficient carbazole dyes and this work has commenced in our laboratory.
Further, to improve the performance of the ICA device, chenodeoxycholic acid (CDCA) was considered as a co-adsorbent. Since CDCA can anchor strongly to the TiO2 surface, it would hinder the dye–dye interaction/aggregation.19 Thus, the performance of the ICA device in the presence of CDCA was studied. The results are presented in Table S2,† and the corresponding J–V curve is shown in Fig. 3. Contrarily, CDCA did not play a vital role in device performance; however, the Jsc of the device decreased. To address the cause of difference in Jsc, we conducted surface coverage measurements of the ICA dye with and without CDCA. The Γ values were calculated to be 3.45 × 10⁻⁸ and 2.83 × 10⁻⁸ mol cm−2 without and with CDCA, respectively. These values indicate that the amount of ICA dye adsorbed on the TiO2 surface was reduced with the presence of CDCA, resulting in the loss of active light harvesting, in-turn suggesting that CDCA was not suitable for improving the performance. These results hint that the ICA dye did not aggregate on the TiO2 surface.20
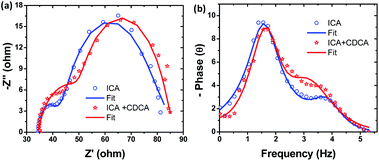
To further understand the charge transfer properties of the ICA device, a typical electrochemical impedance spectroscopy (EIS) analysis was employed. Fig. 4 shows the EIS Nyquist plot of ICA and ICA + CDCA devices. Nyquist plots have two semicircles. The first semicircle is generally attributed to the charge transfer resistance at the counter electrode/electrolyte interface, while the second semicircle in the middle-frequency range represents the charge-transfer resistance at the TiO2/dye/electrolyte interface.21
It can be seen from Fig. 4a that the radius of the larger semicircle increases a bit in the order of ICA + CDCA > ICA, indicating that the charge recombination resistance increased from ICA to ICA + CDCA. This is to some extent consistent with the order of VOC: ICA + CDCA (0.59 V) > ICA (0.58 V). However, the difference in VOC is not significant. A Bode phase plot is also related to the charge transfer resistance at the TiO2/dye/electrolyte interface. Hence, the EIS Bode plots of the devices were also investigated (Fig. 4b). It is known that the reciprocal of electron lifetime is associated with the charge recombination rate, which in-turn is associated to the lower frequency peak in the Bode plot. Thus, the electron lifetime (τn) can be estimated from τ = 1/(2πf) where τ is the lifetime of electrons in TiO2 and f is the frequency of the peak in the Bode plot. The calculated values were 98.91 and 97.75 ms for ICA and ICA + CDCA, respectively. Thus, EIS results indicate that the introduction of CDCA to ICA dye could not improve the VOC. These results are in good agreement with the photovoltaic results.
Further, to understand the outdoor performance of the developed dye-sensitized solar cells (DSSCs), we have employed the IoT technology. As is known, exposing the dye-sensitized photovoltaic device to sun light induces electron flow across the terminals. The terminals were connected in a very high resistance circuit (with voltage comparator or analog to digital circuit). The electron flow from the device pass through a very high resistance digital voltmeter (ADC converter), which has the capability to measure the voltage drop across the terminals at the mV level. The ADS1115 IC was connected with the microcomputer that has cloud connection capability and wireless fidelity modules. The microcomputer (i.e. Raspberry Pi Zero W processor) was programmed to measure the voltage across the terminal every second and update the same in the cloud repository. The cloud repository we have used is firebase. The round-trip delay between sensing and reporting to the android application was observed to be less than 0.33 s. The ADS1115 and the Raspberry Pi W IoT setup was powered with a battery setup to work indigenously throughout the monitoring session.
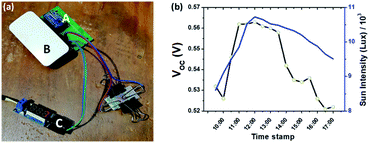
Fig. 5a shows the IoT setup for monitoring the open circuit voltage of the device. The end terminal of the device was connected with the Analog to Digital Converter IC–ADS1115 with a gain factor of 1. The ADS1115 IC used in this setup was a 16 bit A/D converter with a resolution of 0.0315 mV. The ADS1115 IC was connected with the microcomputer (Raspberry Pi device) for the cloud interface through a Wifi support. The Raspberry Pi microcomputer was programmed to send the VOC to the cloud interface and the same was viewed in the android-based application. Fig. S8† illustrates the android application window displaying the live data from the device through cloud interface. The live streaming was done through the node-red programming language. Fig. 5b shows the VOC monitored through the IoT interface from 09:00 to 17:00 h. The VOC was observed to be maximum during peak day time 11.00 am to 02.00 pm.
In summary, we have demonstrated the outdoor DSSC performance through the IoT technology. The designed IoT system effectively monitored the device performance through a cloud interface. The performance of the device was notified to the user through a mobile android application within 0.32 s. The round-trip time of the cloud interface shows effective communication establishment. The system provides a near real-time data on the performance of DSSCs.
Conflicts of interest
There are no conflicts to declare.Acknowledgements
A. K. thanks to SERB Research Scientists scheme (SB/SRS/2018-2019-05/CS, Dated: 30/01/2019). A. K. also acknowledges SAIF, IIT Madras for analytical measurements.References
- Postscapes. Internet of Things (IoT) History, https://www.postscapes.com/internet-of-things-history/ Search PubMed.
- N. Hassan, C. T. Chou and M. Hassan, IEEE Internet Things J., 2019, 6, 2379 Search PubMed.
- B. P. Wong and B. Kerkez, Environ. Modell. Softw., 2016, 84, 505 CrossRef.
- T. Li, M. Xia, J. H. Chen, Y. J. Zhao and C. de Silva, Sensors, 2017, 17, 1735 CrossRef.
- P. J. Vikesland, Nat. Nanotechnol., 2018, 13, 651 CrossRef CAS.
- M. Mayer and A. J. Baeumner, Chem. Rev., 2019, 119, 7996 CrossRef CAS.
- H. Michaels, M. Rinderle, R. Freitag, I. Benesperi, T. Edvinsson, R. Socher, A. Gagliardi and M. Freitag, Chem. Sci., 2020, 11, 2895 RSC.
- B. O'Regan and M. Grätzel, Nature, 1991, 353, 737 CrossRef.
- A. Błaszczyk, Dyes Pigm., 2018, 149, 707 CrossRef.
- Q. Yu, Y. Wang, Z. Yi, N. Zu, J. Zhang, M. Zhang and P. Wang, ACS Nano, 2010, 4, 6032 CrossRef CAS.
- H. Ozawa, T. Sugiura, T. Kuroda, K. Nozawa and H. Arakawa, J. Mater. Chem. A, 2016, 4, 1762 RSC.
- K. Kakiage, Y. Aoyama, T. Yano, K. Oya, J. Fujisawa and M. Hanaya, Chem. Commun., 2015, 51, 15894 RSC.
- K. Sayama, S. Tsukagoshi, K. Hara, Y. Ohga, A. Shinpou, Y. Abe, S. Suga and H. Arakawa, J. Phys. Chem. B, 2002, 106, 1363 CrossRef CAS.
- T. Khamrang, M. Velusamy, M. Jaccob, M. Ramesh, M. Kathiresan and A. Kathiravan, Phys. Chem. Chem. Phys., 2018, 20, 6264 RSC.
- A. Kathiravan, M. Panneerselvam, K. Sundaravel, N. Pavithra, V. Srinivasan, S. Anandan and M. Jaccob, Phys. Chem. Chem. Phys., 2016, 18, 13332 RSC.
- Z. S. Wang, N. Koumura, Y. Cui, M. Takahashi, H. Sekiguchi, A. Mori, T. Kubo, A. Furube and K. Hara, Chem. Mater., 2008, 20, 3993 CrossRef CAS.
- K. Stalindurai, A. Karuppasamy, J. D. Peng, K. C. Ho, A. Tamilselvan and C. Ramalingan, Tetrahedron, 2017, 73, 278 CrossRef CAS.
- R. Kumar, V. Sudhakar, K. Prakash, K. Krishnamoorthy and M. Sankar, ACS Appl. Energy Mater., 2018, 1, 2793 CrossRef CAS.
- S. Ito, H. Miura, S. Uchida, M. Takata, K. Sumioka, P. Liska, P. Comte, P. Pechy and M. Grätzel, Chem. Commun., 2008, 5194 RSC.
- T. Khamrang, A. Seetharaman, M. D. Kumar, M. Velusamy, M. Jaccob, M. Ramesh, M. Kathiresan and A. Kathiravan, J. Phys. Chem. C, 2018, 122, 22241 CrossRef CAS.
- Q. Wang, J. Moser and M. Grätzel, J. Phys. Chem. B, 2005, 109, 14945 CrossRef CAS.
Footnote |
| † Electronic supplementary information (ESI) available: Synthesis, methods, NMR, HR-MS characterization and other spectral data. See DOI: 10.1039/d0ra07353a |
| This journal is © The Royal Society of Chemistry 2020 |

