 Open Access Article
Chirality dependent inverse-melting and re-entrant gelation in α-cyclodextrin/1-phenylethylamine mixtures†
Reut Shapira,
Sapir Katalan,
Rachel Edrei and
Yoav Eichen *
*
Schulich Faculty of Chemistry, Technion – Israel Institute of Technology, Technion City, 3200008 Haifa, Israel. E-mail: yoav@ch.technion.ac.il
First published on 26th October 2020
Abstract
Solutions of cyclohexakis-(1→4)-α-D-glucopyranosyl, α-cyclodextrin, αCD, in R-(+)-1-phenylethylamine, αCD/R-PEA, and S-(−)-1-phenylethylamine, αCD/S-PEA, display abnormal phase transitions that strongly depend on supramolecular diastereomeric interactions. While αCD/R-PEA mixtures show one sol–gel inverse-melting phase transition, αCD/S-PEA mixtures show temperature dependent gel–sol–gel re-entrant behavior. NMR, Raman spectroscopy, microscopy and X-ray scattering measurements reveal that hydrogen bond weakening in solution, as well as changes in crystal composition are responsible for entropy increase and gel formation upon heating.
Introduction
Re-entrant phase transitions occur when a continuous thermodynamic field variation, usually temperature or pressure, shows two or more phase transitions, and the final state visually resembles the initial state.1 In such cases, it looks as if the system returns to, or “re-enters”, its original state. However, even though the initial and final states are macroscopically similar, thermodynamics dictates that these two phases must be different, in either composition or structure. This abnormal phase behaviour is one of few less common phase transitions, of which the anomaly of water in the temperature–pressure–volume space is most known and studied.2–4 Yet another anomalous phase transition, sometimes found in mixtures, is inverse-melting, also referred to as inverse-freezing,5,6 describing a liquid solution that reversibly solidifies upon heating, and melts upon cooling. Recently, these odd phase transitions draw attention because of their relevance to biology7–9 and different fields of technology.10–13In a recent publication,14 we have reported on our efforts to gain understanding of the microscopic picture of inverse melting in mixtures of low molecular weight components. The work focused on inverse melting solutions of cyclohexakis-(1→4)-α-D-glucopyranosyl, α-cyclodextrin, αCD, a cyclic hexamer of D-glucopyranose linked to one another through α-1,4 glycosidic bonds, in aqueous pyridine.15–18 As some water–pyridine mixtures are known to show re-entrant phase behavior,19,20 we explored the possibility that the similarities between re-entrant transitions and inverse melting processes are non-coincidental. NMR studies of these systems revealed surprising relationship between inverse-melting and re-entrant supramolecular interactions in the solvent, implying that these two processes are linked to one another.14 In phase transitions that involve formation of solids, re-entrant phase transition, or at least re-entrant intermolecular interactions, could be a pre-requisite for the appearance of inverse melting.14
Phase re-entrance phenomena are sometimes observed in binary liquid solutions1,21,22 and gases,23–25 denaturation of proteins,26–28 liquid crystals,29–31 and gels.32–36 This abnormal phase behaviour was first observed over 100 years ago.22 However, despite its role in important fields of biology and technology,7,9,12,13 it received relatively limited attention, mainly from physicists who developed models that put this phenomenon in the right thermodynamics perspective.37–39 In contrast, there is only very limited success in revealing the supramolecular origins of this phenomenon.40–42
Focusing on re-entrant gel transitions, most of the known formulations are based on high-molecular-weight polymers, composed of mixtures of at least three components.33–35 The presence of polymers in many of the inverse freezing and re-entrant systems is not surprizing. Due to their length and wealth of degrees of freedom, polymers have many possible conformations, of which some are enthalpy favoured, while others are populated only at higher temperatures, invoking entropy into play. Therefore, a system containing a polymer has a better chance to exhibit re-entrant gel formation compared to a mixture of small molecules, with limited number of conformations.
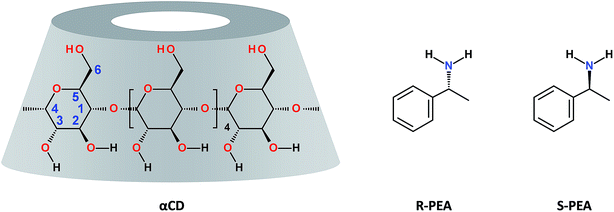
The present paper focuses on a new system that is composed of two chiral low-molecular weight components: αCD and different proportions of the two enantiomers of 1-phenylethylamine, PEA. Similar to the systems reported by Zheng et al.,43–45 we expected that diastereomeric interactions between enantiopure αCD and the two enantiomers of PEA will result in notably different macroscopic phase diagrams for the two systems. Indeed, a re-entrant gel is formed upon mixing αCD with pure S-(−)-PEA. In contrast, under the same conditions, mixtures of αCD and R-(+)-PEA show only inverse melting behaviour. The phase diagram, as well as the structural and thermal properties of αCD/PEA mixtures were characterized using viscometry, light transmittance, differential scanning calorimetry, NMR, Raman spectroscopy, optical and electron microscopy and X-ray scattering techniques, all in order to obtain understanding of this unique system.
Results and discussion
Molecule structures
At room temperature a mixture of 0.25 gr of αCD in 1 ml of (R)-(+)-PEA, αCD/R-PEA, is a clear, fluid and homogeneous solution. The solution contains about 1.1% wt water, and the mole ratio of the components is 1![[thin space (1/6-em)]](https://www.rsc.org/images/entities/char_2009.gif) :
:![[thin space (1/6-em)]](https://www.rsc.org/images/entities/char_2009.gif) 30
30![[thin space (1/6-em)]](https://www.rsc.org/images/entities/char_2009.gif) :
:![[thin space (1/6-em)]](https://www.rsc.org/images/entities/char_2009.gif) 3 αCD
3 αCD![[thin space (1/6-em)]](https://www.rsc.org/images/entities/char_2009.gif) :
:![[thin space (1/6-em)]](https://www.rsc.org/images/entities/char_2009.gif) (R)-(+)-PEA
(R)-(+)-PEA![[thin space (1/6-em)]](https://www.rsc.org/images/entities/char_2009.gif) :
:![[thin space (1/6-em)]](https://www.rsc.org/images/entities/char_2009.gif) H2O. In contrast, at the same temperature, a similar mixture of 0.25 g αCD in 1 ml of (S)-(−)-PEA (1
H2O. In contrast, at the same temperature, a similar mixture of 0.25 g αCD in 1 ml of (S)-(−)-PEA (1![[thin space (1/6-em)]](https://www.rsc.org/images/entities/char_2009.gif) :
:![[thin space (1/6-em)]](https://www.rsc.org/images/entities/char_2009.gif) 30
30![[thin space (1/6-em)]](https://www.rsc.org/images/entities/char_2009.gif) :
:![[thin space (1/6-em)]](https://www.rsc.org/images/entities/char_2009.gif) 3 αCD
3 αCD![[thin space (1/6-em)]](https://www.rsc.org/images/entities/char_2009.gif) :
:![[thin space (1/6-em)]](https://www.rsc.org/images/entities/char_2009.gif) (S)-(−)-PEA
(S)-(−)-PEA![[thin space (1/6-em)]](https://www.rsc.org/images/entities/char_2009.gif) :
:![[thin space (1/6-em)]](https://www.rsc.org/images/entities/char_2009.gif) H2O), αCD/S-PEA, appears as a highly viscous, opaque microcrystalline gel. Clearly, the difference between the two systems stems from diastereomeric differences in the supramolecular interactions between αCD and the two PEA enantiomers, yielding chirality dependent match and miss-match between the solvent, PEA, and the solute, αCD.46 This difference in matching is also revealed from the difference in the association constant between αCD and PEA enantiomers observed in aqueous solutions, Kass = 26.0 and 33.6 L mol−1 for R-(+)-PEA and S(−)-PEA respectively.47 Moreover, because of this difference in intermolecular interactions, cyclodextrins were found suitable for separation of enantiomers of PEA.48–52 For example, a commercially available column, with a stationary phase coated with β-cyclodextrin, βCD, separates R-(+)-PEA from S(−)-PEA in useful resolution, with R-(+)-PEA being eluted first when hydrophobic eluents are used.
H2O), αCD/S-PEA, appears as a highly viscous, opaque microcrystalline gel. Clearly, the difference between the two systems stems from diastereomeric differences in the supramolecular interactions between αCD and the two PEA enantiomers, yielding chirality dependent match and miss-match between the solvent, PEA, and the solute, αCD.46 This difference in matching is also revealed from the difference in the association constant between αCD and PEA enantiomers observed in aqueous solutions, Kass = 26.0 and 33.6 L mol−1 for R-(+)-PEA and S(−)-PEA respectively.47 Moreover, because of this difference in intermolecular interactions, cyclodextrins were found suitable for separation of enantiomers of PEA.48–52 For example, a commercially available column, with a stationary phase coated with β-cyclodextrin, βCD, separates R-(+)-PEA from S(−)-PEA in useful resolution, with R-(+)-PEA being eluted first when hydrophobic eluents are used.Interestingly, upon heating these two mixtures, their behaviour becomes macroscopically similar. At around 65 °C the gel of αCD/S-PEA melts, turning into a homogeneous liquid while αCD/R-PEA retains its homogeneous liquid-state. Upon further heating to above 75 °C, both solutions solidify, forming an inverse melting gel, Fig. 1. These are the only phase transitions one can observe visually in the −10 °C to +100 °C temperature range and atmospheric pressure.
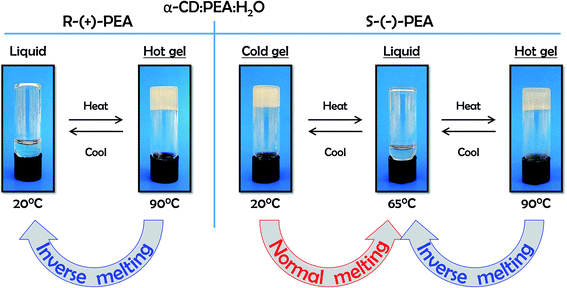 | ||
| Fig. 1 Temperature dependent sol–gel phase transitions in αCD/R-PEA (left) and αCD/S-PEA (right) in the −10 to +100 °C temperature range. | ||
Temperature dependent viscosity of αCD/PEA mixtures
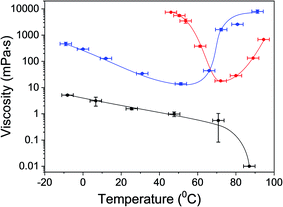
One of the main characteristics of the gel state is its relative high viscosity compared to the fluid liquid-state.53,54 To support gel formation and extract the gelation points, the viscosity of αCD/R-PEA and αCD/S-PEA was measured as a function of the temperature, Fig. 2. In accordance with the findings presented in Fig. 1, αCD/R-PEA mixture has relatively low viscosity at temperatures below 60 °C, 1–2 order of magnitude higher than pure PEA. The viscosity of the system drops with increasing temperature, resembling pure R-PEA and S-PEA. At temperatures above 60 °C the viscosity increases dramatically with temperature, reaching a highly viscous gel state at about 90 °C. In contrast, at low temperatures, the viscosity of αCD/S-PEA is very high as the system is in its “cold gel” state. Viscosity starts dropping at about 50 °C as the “cold gel” melts. Upon further temperature increase to about 70 °C the viscosity reaches its lowest value, 18 mPa s, and the solution turns homogeneous and transparent. Upon further increasing the temperature the viscosity again increases with temperature as the system transforms into its “hot gel” state.Temperature dependent light transmittance of αCD/PEA systems
Temperature dependent light transmittance through samples of αCD/R-PEA and αCD/S-PEA was studied at different αCD concentrations and heating rates in heat-and-cool cycles. Around the gelation points the transmittance changed rapidly from high values, characteristic of liquid phases, to lower values that are characteristic of opaque gel phases. For convenient sample comparison, we have looked for a fitting function that could best represent the gelation process. The poly-crystalline structure of the gels (see Microscopy section below), suggests that the formation of the gel commences with slow continuous nucleation, eqn (1), followed by autocatalytic crystal growth, eqn (2):
 | (1) |
 | (2) |
 | (3) |
The fitting parameters show that in all of our systems k1 ≪ k2ϕ0, and that the behaviour of the system can be efficiently represented by a simpler sigmoid fitting function, eqn (4):
 | (4) |
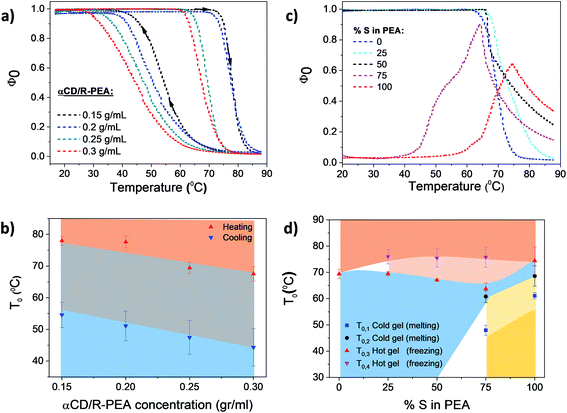
Temperature dependent light transmittance of αCD/R-PEA samples at different concentrations of αCD, Fig. 3a and b, showed the presence of only one phase transition in the 20 °C to 90 °C temperature range and results were fitted using eqn (4). Similar to other low molecular weight inverse melting gels,56 the phase transition temperature, T0, drops with increasing αCD concentration. Upon heating, T0 values were found to be 78, 77, 69 and 67 °C for 0.15, 0.2, 0.25 and 0.3 g mol−1 αCD/R-PEA solutions respectively. Cooling the same systems yielded T0 of 55, 51, 47, 44 °C for 0.15, 0.2, 0.25 and 0.3 g mol−1 αCD/R-PEA solutions respectively, presenting an average hysteresis of 23 °C. The concentration of αCD in the system does not seem to influence the gel structure as the general trend of curve is maintained through all four measured concentrations. Similar curves were built for systems containing S-PEA and mixtures of R-PEA and S-PEA, Fig. 3c and d and S1.† The “cold gel” of αCD/S-PEA melts upon heating in two sequential steps, Fig. 3c, thus a bi-sigmoidal function was applied for fitting the normal melting region, eqn (S1),† represented as T0,1 = 58 °C and T0,2 = 68 °C at 100%, S-PEA in Fig. 3d (see Fig. S2 and Table S1† for more details about fitting). At T0,3 = 74 °C, this sample forms a “hot gel” with low transmittance in an inverse melting transition. The use of different enantiomeric compositions of PEA as the solvent for αCD results with different phase transition profiles. Fig. 3c clearly shows that the system containing αCD and racemic PEA, αCD/rac-PEA (black line), has one liquid-to-gel transition at high temperature, and is macroscopically similar to the αCD/R-PEA system. However, αCD/rac-PEA shows two clear sub-processes in the liquid-to-gel transition (T0,3 = 67 °C and T0,4 = 75 °C in Fig. 3d), in contrast to only one process observed for αCD/R-PEA. The first sub-transition for αCD/rac-PEA could be formation of gel structure made of αCD and R-PEA, while the second sub-transition seems to be related to the formation of gel structure made of αCD and S-PEA. This two-step transition is observed also upon heating the αCD/75R:25S-PEA system, cyan line, where the solvent mixture contains more R-PEA than S-PEA. This mixture is characterized by transition temperatures of T0,3 = 69 °C and T0,4 = 76 °C. The αCD/25R:75S-PEA system (magenta line) exhibits a curve shape that is similar to αCD/S-PEA and presents two main transitions: “cold gel” to liquid and liquid to “hot gel”. However, the “cold gel” of αCD/25R:75S-PEA has lower melting points, T0,1 = 48 °C and T0,2 = 61 °C, implying that it is less stable than the “cold gel” of pure αCD/S-PEA. We assume that the disturbance of R-PEA enantiomer to the “cold gel” structure of αCD/25R:75S is responsible for the decrease in the observed melting points. The “hot gel” of αCD/25R:75S-PEA which forms at T0,3 = 63 °C and T0,4 = 76 °C, is observed at lower temperature than the “hot gel” of αCD/S-PEA. Here too, two sub transitions are observed due to the presence of two diastereomeric structures of αCD-PEA, as in αCD/rac-PEA and αCD/75R:25S-PEA. Fig. 3d presents the phase transition temperature as a function of the enantiomeric composition of the PEA solvent. All transition temperatures were confirmed independently using numerical first and second derivatives for each transmittance curve.57 The dependence of the phase transition temperature on heating rate is presented in Fig. S3.†
Differential scanning calorimetry
Thermograms of αCD/R-PEA, αCD/rac-PEA and αCD/S-PEA mixtures were recorded using differential scanning calorimetry, DSC, at a heating rate of 1 °C min−1, Fig. 4. All the transitions found in the thermographs are first-order with ΔH = +2.30 J g−1 for melting of the αCD/S-PEA “cold gel”, and ΔH = +0.6 J g−1, 0.82 J g−1 and 0.92 J g−1 for the formation of the “hot gel” of αCD/R-PEA, αCD/rac-PEA and αCD/S-PEA, respectively. Melting of the “cold gel” of αCD/S-PEA as well as the solidification of αCD/rac-PEA upon heating are composed of at least two sub-processes, in agreement with the results obtained from temperature dependent light transmission. The amount of heat consumed during these liquid-to-gel transitions is similar to the previously reported ΔH values for the inverse melting process in αCD/4-MP/H2O mixtures,17,58 and two order of magnitude lower than that of water melting. The relatively small ΔH values suggest that the strength of the intermolecular interactions does not change dramatically during phase transition, and that the major effect originates from re-ordering of the systems.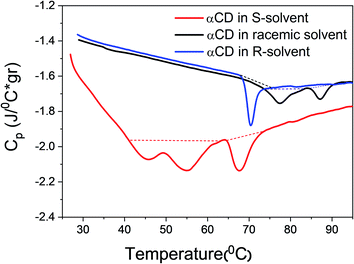 | ||
| Fig. 4 DSC thermographs of 0.25 g ml−1 αCD/R-PEA (blue), αCD/rac-PEA (black) and αCD/S-PEA (red). Heating rate: 1 °C min−1. | ||
NMR spectroscopy
Temperature dependent solution 1H-NMR spectra of αCD/R-PEA and αCD/S-PEA were taken across the thermally induced gelation points, Fig. S4 and S5,† respectively. Relying on the loss of NMR peak intensity one can quantify the percentage of the different components turning anisotropic upon gelation.14,59 Fig. 5 reveals that while in the liquid phase the integration of the peaks of the different ingredients match the true system composition of 1![[thin space (1/6-em)]](https://www.rsc.org/images/entities/char_2009.gif) :
:![[thin space (1/6-em)]](https://www.rsc.org/images/entities/char_2009.gif) 30
30![[thin space (1/6-em)]](https://www.rsc.org/images/entities/char_2009.gif) :
:![[thin space (1/6-em)]](https://www.rsc.org/images/entities/char_2009.gif) 3 αCD
3 αCD![[thin space (1/6-em)]](https://www.rsc.org/images/entities/char_2009.gif) :
:![[thin space (1/6-em)]](https://www.rsc.org/images/entities/char_2009.gif) PEA
PEA![[thin space (1/6-em)]](https://www.rsc.org/images/entities/char_2009.gif) :
:![[thin space (1/6-em)]](https://www.rsc.org/images/entities/char_2009.gif) H2O, all gel phases possess significantly lower αCD concentrations, implying that upon gelation most of the αCD separates from solution and participates in the solid network. Moreover, an important difference between the hot and cold gels of the αCD/S-PEA system is that the solid of the “cold gel” consists of a 1
H2O, all gel phases possess significantly lower αCD concentrations, implying that upon gelation most of the αCD separates from solution and participates in the solid network. Moreover, an important difference between the hot and cold gels of the αCD/S-PEA system is that the solid of the “cold gel” consists of a 1![[thin space (1/6-em)]](https://www.rsc.org/images/entities/char_2009.gif) :
:![[thin space (1/6-em)]](https://www.rsc.org/images/entities/char_2009.gif) 9.5 ± 0.5 αCD
9.5 ± 0.5 αCD![[thin space (1/6-em)]](https://www.rsc.org/images/entities/char_2009.gif) :
:![[thin space (1/6-em)]](https://www.rsc.org/images/entities/char_2009.gif) S-PEA, consuming about 28% of the PEA and 86% of the αCD of the system, while the solid of the “hot gel” consists of a 1
S-PEA, consuming about 28% of the PEA and 86% of the αCD of the system, while the solid of the “hot gel” consists of a 1![[thin space (1/6-em)]](https://www.rsc.org/images/entities/char_2009.gif) :
:![[thin space (1/6-em)]](https://www.rsc.org/images/entities/char_2009.gif) 7.5 ± 0.5 αCD
7.5 ± 0.5 αCD![[thin space (1/6-em)]](https://www.rsc.org/images/entities/char_2009.gif) :
:![[thin space (1/6-em)]](https://www.rsc.org/images/entities/char_2009.gif) S-PEA, consuming about 14% of the PEA and 54% of the αCD of the system. For the “hot gel” of αCD/R-PEA, the αCD
S-PEA, consuming about 14% of the PEA and 54% of the αCD of the system. For the “hot gel” of αCD/R-PEA, the αCD![[thin space (1/6-em)]](https://www.rsc.org/images/entities/char_2009.gif) :
:![[thin space (1/6-em)]](https://www.rsc.org/images/entities/char_2009.gif) R-PEA ratio is found to be 1
R-PEA ratio is found to be 1![[thin space (1/6-em)]](https://www.rsc.org/images/entities/char_2009.gif) :
:![[thin space (1/6-em)]](https://www.rsc.org/images/entities/char_2009.gif) 7.5 ± 0.5, similar to the “hot gel” of αCD/S-PEA.
7.5 ± 0.5, similar to the “hot gel” of αCD/S-PEA.
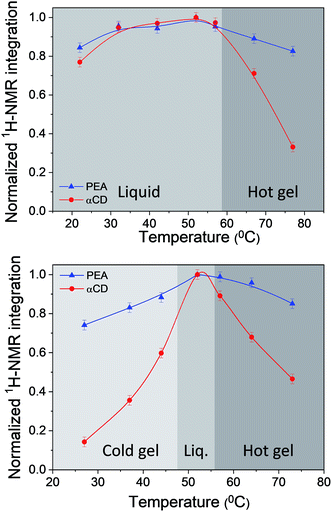 | ||
| Fig. 5 Normalized 1H-NMR integration values of the solvent PEA methyl peak (blue) and the solute αCD-H1 peak (red) as a function of temperature for 0.25 g ml−1: top: αCD/R-PEA and bottom: αCD/S-PEA. | ||
Raman spectroscopy
The counterintuitive material behavior expressed in phase reentrance and inverse melting is often explained by a change in hydrogen bonding upon heating. In the liquid phase of most of such systems, molecules participate in hydrogen bound networks, dictating low orientational entropy. Heating increases the orientational entropy by populating non hydrogen bound states, separation of solid components and formation of a gel. Thus, for gaining more information on the systems reported here, Raman spectroscopy was used for following the temperature dependence of hydrogen bonds in αCD/PEA mixtures. Raman spectra taken at the different temperatures are identical in vibration energy, except in three regions that show important temperature dependence: N–H stretching around 3300 cm−1, N–H deformation around 750 cm−1 and broad absorption peak around 400 cm−1, Fig. 6 (full spectra are presented in Fig. S6†). Upon heating pure PEA, the N–H stretching vibration peaks (symmetric and asymmetric bands) shift to higher energy, whereas N–H deformation vibration peaks shifts to lower energy, Fig. 6 bottom, an indication of hydrogen bond weakening.60 Temperature-dependent Raman spectroscopy of inverse melting αCD/R-PEA, Fig. 6 middle, and re-entrant αCD/S-PEA, Fig. 6 top, show similar effects on N–H stretching and deformation peaks. The results suggest weakening of hydrogen bonds, mainly between solvent molecules, in both αCD/R-PEA and αCD/S-PEA mixtures upon increasing temperature. This contributes to the increase in orientational, and thus total, entropy upon gelation. In all systems the absorption of the N–H stretch vibration is composed of at least two peaks that belong to at least two populations, and their relative intensity changes with temperature. Work is currently directed towards fully characterizing the origins of this temperature dependence and results will be published in due course.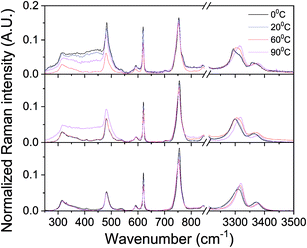 | ||
| Fig. 6 Raman spectra of PEA (bottom), αCD/R-PEA (middle) and αCD/S-PEA (top) at different temperatures: 0 °C, 20 °C, 60 °C and 90 °C. Focus on N–H vibrations at ∼750 cm−1 and 3000 cm−1. | ||
Microscopy
Light microscopy and cryo-scanning electron microscopy (cryo-SEM) were applied to the exploration of the morphological differences between the “cold gel” and “hot gel” of αCD/S-PEA and the “hot gel” of αCD/R-PEA, see Fig. 7 and S7† for light microscopy and cryo-SEM respectively. Both light and cryo-SEM microscopy show clear morphological differences between the three gels. The “cold gel” of αCD/S-PEA consists of long and thin fibres, with a characteristic length of 50–100 μm, and an average width of 1 μm, Fig. 7, top. In contrast, the “hot gel” of αCD/S-PEA appears as an assembly of lamellar layers with average inter-lamellar distance of ∼500 nm, Fig. 7 middle, see also cryo-SEM in Fig. S7† middle. These results agree with the thermodynamic basis of the reentrant phenomena whereby the initial and final states are macroscopically similar but microscopically different. Interestingly, the “hot gel” of αCD/R-PEA is morphologically different from the two gels of αCD/S-PEA and is characterized by relatively short, needle-like crystals, with a characteristic length of 1–5 μm and average width of 200 nm.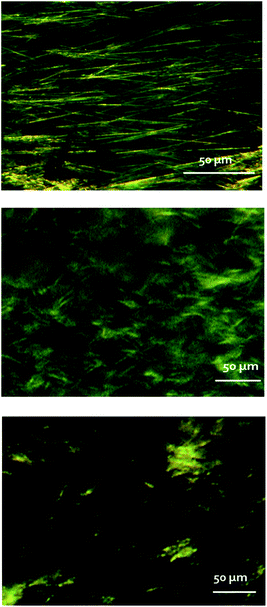 | ||
| Fig. 7 Light microscopy images of αCD/S-PEA cold gel (top), αCD/S-PEA hot gel (middle) and αCD/R-PEA hot gel (bottom). | ||
X-ray scattering
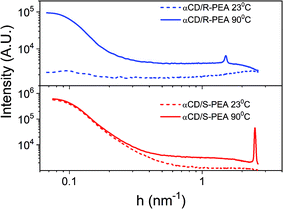
The different crystalline structures of the αCD/R-PEA and αCD/S-PEA gels were also studied using X-ray scattering, providing information about the long-range order of these materials. Fig. 8 shows the normalized SAXS profiles of the αCD/R-PEA and αCD/S-PEA systems at room temperature, 23 °C, and at 90 °C. At room temperature, the solvent, PEA, and liquid αCD/R-PEA show a scattering pattern typical of homogeneous amorphous materials, see blue dashed line in Fig. 8. The “hot gel” of αCD/R-PEA, forming at about 90 °C, shows material inhomogeneity with long-range order characterized by periodicity with d = 4.13 nm (peak at h = 1.522 nm−1). The presence of distinct diffraction peaks in the diffractogram implies the presence of micron size crystals, see Fig. S8.† The room temperature “cold gel” of αCD/S-PEA shows clear material inhomogeneity with no distinct diffraction peaks, but its “hot gel” shows periodicity with d = 2.51 nm (h = 2.505 nm−1). All gel-curves were fitted to h−4 function, eqn (S2)† showing large-surface particles with background values61 (fitting results are summarized in Fig. S9†). Background values indicate the presence of fluid in different amounts that separate the microcrystals in the gel structure. The values are summarized in Table S2† and clearly show that the contribution of the fluid is more dominant in the hot gels than in the cold gel. The fluid is a major contributor to the disorder in the gel structure, so its presence in larger amounts indicates a higher entropy contribution to the higher temperature gels.Wide angle X-ray scattering, WAXS, was used to compare the unit cells of the crystals of the different gels of αCD/S-PEA and αCD/R-PEA, Fig. 9 and S10.† All gel profiles show broad peaks, indicating the presence of small crystals that are separated by solvent. The WAXS diffraction of a room temperature “cold gel” of αCD/S-PEA, Fig. 9 middle, has three indicative peaks at 2θ = 11.7, 13.3 and 14.0°, which are typical for powders of αCD-hydrate, αCD·H2O, Fig. 9 bottom.62 These peaks imply that only the “cold gel” of αCD/S-PEA contains the αCD·H2O inclusion complex, while in the “hot gels” of both αCD/S-PEA and αCD/R-PEA the αCD cavity is either empty or contains a PEA molecule. The release of water molecules from the cavity upon heating joins to other effects mentioned above explaining the entropy gain in the inverse melting process.
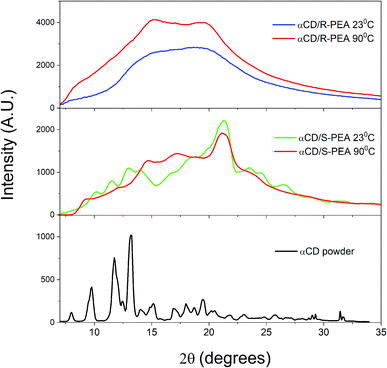 | ||
| Fig. 9 WAXS results for αCD powder (bottom, black), αCD/S-PEA at 23 °C (middle, green) and 90 °C (middle, red) and αCD/R-PEA at 23 °C (top, blue) and 90 °C (top, red). | ||
Conclusions
Mixtures of αCD/R-PEA and αCD/S-PEA show abnormal inverse-melting and reentrant phase transition, respectively, emphasizing the role of diastereomeric supramolecular interactions in controlling such phase transitions. These mixtures were physically and chemically characterized to understand the origin of their abnormal phase transitions. The different transmittance-based phase diagrams of αCD/R-PEA and αCD/S-PEA exhibit the significant role of 3D fit between solvent and solute in inverse melting systems. According to temperature-transmittance relation and DSC, enantiomeric solvent mixtures show complex transitions that should be more investigated. Characterization of αCD/S-PEA “cold gel” and “hot gel” clearly show that the initial and final phases of the re-entrant system are microscopically different both in structure and composition. NMR and X-ray scattering data show that the gel–sol–gel transition upon heating involves release of PEA and water from the crystals to the fluid, by that increasing the entropy of the system. Raman spectroscopy indicates hydrogen bond weakening upon heating in the PEA solvent itself as a driving force for solidification upon heating, similar to previously reported findings on the αCD/water/4-methylpyridine system.14 Thus, results show that the temperature dependence of the intermolecular interactions in pure PEA as well as in PEA/water compositions are the main driving force behind these inverse melting and re-entrance phenomena.Experimental section
Materials
α-Cyclodextrin, αCD, R-(+)-phenylethylamine, R-PEA, S-(−)-phenylethylamine, S-PEA, were purchased from Sigma-Aldrich and used without further purification.Sample preparation
![[thin space (1/6-em)]](https://www.rsc.org/images/entities/char_2009.gif) :
:![[thin space (1/6-em)]](https://www.rsc.org/images/entities/char_2009.gif) 30
30![[thin space (1/6-em)]](https://www.rsc.org/images/entities/char_2009.gif) :
:![[thin space (1/6-em)]](https://www.rsc.org/images/entities/char_2009.gif) 3 αCD
3 αCD![[thin space (1/6-em)]](https://www.rsc.org/images/entities/char_2009.gif) :
:![[thin space (1/6-em)]](https://www.rsc.org/images/entities/char_2009.gif) PEA
PEA![[thin space (1/6-em)]](https://www.rsc.org/images/entities/char_2009.gif) :
:![[thin space (1/6-em)]](https://www.rsc.org/images/entities/char_2009.gif) H2O.
H2O.Methods
The scattered intensity I(h) was recorded in the interval 0.07 < h < 2.7 nm−1, where h is the scattering vector defined as h = (4π/λ)sin(θ), 2θ is the scattering angle, and λ is the radiation wavelength (0.1542 nm). The solutions under study were sealed in a glass capillary of about 2 mm in diameter and 0.01 mm wall thickness and measured at 23 and 90 °C under vacuum. I(h) was normalized to time, solid angle, primary beam intensity, capillary diameter, transmission, and the Thompson factor. Scattering of the solvent, empty capillary and electronic noise were subtracted. All calculations were performed using the Mathcad software. All structured element appears again after heating–cooling–heating process.
Conflicts of interest
Authors state that there are no conflicts to declare.References
- T. Narayanan and A. Kumar, Phys. Rep., 1994, 249, 135–218 CrossRef CAS.
- Y. D. Fomin, E. N. Tsiok and V. N. Ryzhov, Eur. Phys. J.: Spec. Top., 2013, 216, 165–173 CAS.
- A. M. Almudallal, S. V. Buldyrev and I. Saika-Voivod, J. Chem. Phys., 2012, 137, 034507 CrossRef.
- D. Frenkel, Phys. A, 1999, 263, 26–38 CrossRef CAS.
- G. P. Johari, Phys. Chem. Chem. Phys., 2001, 3, 2483–2487 RSC.
- A. L. Greer, Nature, 2000, 404, 134–135 CrossRef CAS.
- R. Asor, O. Ben-Nun-Shaul, A. Oppenheim and U. Raviv, ACS Nano, 2017, 11, 9814–9824 CrossRef CAS.
- L. Letamendia and F. J. Bermejo, in Metastable Systems under Pressure, ed. S. Rzoska, A. Drozd-Rzoska and V. Mazur, Springer, Odessa, 2010, pp. 153–166 Search PubMed.
- I. Alshareedah, T. Kaur, J. Ngo, H. Seppala, L. A. D. Kounatse, W. Wang, M. M. Moosa and P. R. Banerjee, J. Am. Chem. Soc., 2019, 141, 14593–14602 CrossRef CAS.
- Y. Rotbaum, G. Parvari, Y. Eichen and D. Rittel, Macromolecules, 2017, 50, 4817–4826 CrossRef CAS.
- G. Parvari, Y. Rotbaum, Y. Eichen and D. Rittel, Chem. Commun., 2018, 54, 12578–12581 RSC.
- K. Senol, G. Parvari, Y. Rotbaum, Y. Eichen, D. Rittel and A. Shukla, Int. J. Impact Eng., 2020, 140, 103547 CrossRef.
- J. Zhang, W. Yang, A. Q. Vo, X. Feng, X. Ye, D. W. Kim and M. A. Repka, Carbohydr. Polym., 2017, 177, 49–57 CrossRef CAS.
- R. Shapira, Y. S. Balazs, S. Kababya, R. Edrei and Y. Eichen, Phys. Chem. Chem. Phys., 2018, 20, 29610–29615 RSC.
- M. Plazanet, C. Floare, M. R. Johnson, R. Schweins and H. P. Trommsdorff, J. Chem. Phys., 2004, 121, 5031–5034 CrossRef CAS.
- M. Plazanet, M. Dean, M. Merlini, A. Hüller, H. Emerich, C. Meneghini, M. R. Johnson and H. P. Trommsdorff, J. Chem. Phys., 2006, 125, 1–7 CrossRef.
- E. Tombari, C. Ferrari, G. Salvetti and G. P. Johari, J. Chem. Phys., 2005, 123, 051104-1–051104-4 Search PubMed.
- R. Angelini, G. Salvi and G. Ruocco, Philos. Mag., 2008, 88, 4109–4116 CrossRef CAS.
- R. J. L. Andon and J. D. Cox, J. Chem. Soc., 1952, 4601 RSC.
- J. D. Cox, J. Chem. Soc., 1952, 4606 RSC.
- J. D. Cox and E. F. G. Herington, Trans. Faraday Soc., 1956, 52, 926–930 RSC.
- C. S. Hudson, Z. Phys. Chem., 1904, 47, 113–115 CAS.
- J. A. Schouten, Phys. Rep., 1989, 172, 33–92 CrossRef CAS.
- A. Deerenberg, J. A. Schouten and N. J. Trappeniers, Phys. A, 1980, 103, 183–204 CrossRef.
- R. J. Tufeu, P. H. Keyesg and W. B. Daniels, Phys. Rev. Lett., 1975, 35, 1004–1006 CrossRef CAS.
- S. A. Hawley, Biochemistry, 1971, 10, 2436–2442 CrossRef CAS.
- J. Zhang, X. Peng, A. Jonas and J. Jonas, Biochemistry, 1995, 34, 8631–8641 CrossRef CAS.
- J. F. Brandts, R. J. Oliveira and C. Westort, Biochemistry, 1970, 9, 1038–1047 CrossRef CAS.
- P. E. Cladis, D. Guillon, F. R. Bouchet and P. L. Finn, Phys. Rev. A, 1981, 23, 2594–2601 CrossRef CAS.
- P. E. Cladis, Phys. Rev. Lett., 1975, 35, 48–51 CrossRef CAS.
- P. E. Cladis, R. K. Bogardus and D. Aadsen, Phys. Rev. A, 1978, 18, 2292–2306 CrossRef CAS.
- H. Nagatomi, N. Yanai and N. Kimizuka, Chem. Lett., 2018, 47, 97–99 CrossRef CAS.
- S. Katayama, Y. Hirokawa and T. Tanaka, Macromolecules, 1984, 17, 2641–2643 CrossRef CAS.
- T. Li, T. Ci, L. Chen, L. Yu and J. Ding, Polym. Chem., 2014, 5, 979–991 RSC.
- F. Bomboi, F. Romano, M. Leo, J. Fernandez-Castanon, R. Cerbino, T. Bellini, F. Bordi, P. Filetici and F. Sciortino, Nat. Commun., 2016, 7, 1–6 RSC.
- A. F. Kostko, J. L. Harden and M. A. McHugh, Macromolecules, 2009, 42, 5328–5338 CrossRef CAS.
- N. Schupper and N. M. Shnerb, Phys. Rev. E: Stat., Nonlinear, Soft Matter Phys., 2005, 72, 1–16 CrossRef.
- M. Sellitto, Phys. Rev. B: Condens. Matter Mater. Phys., 2006, 73, 1–4 CrossRef.
- Y. V. Kalyuzhnyi, A. Jamnik and P. T. Cummings, Soft Matter, 2017, 13, 1156–1160 RSC.
- G. Jancsó, J. Solution Chem., 2006, 35, 991–1005 CrossRef.
- L. Almásy, P. Bánki, M. C. Bellissent-Funel, M. Bokor, L. Cser, G. Jancsó, K. Tompa and J. M. Zanotti, Appl. Phys. A: Mater. Sci. Process., 2002, 74, 516–518 CrossRef.
- W. Marczak, K. Kiełek, B. Czech, H. Flakus and M. Rogalski, Phys. Chem. Chem. Phys., 2009, 11, 2668–2678 RSC.
- J. L. Zhou, X. J. Chen and Y. S. Zheng, Chem. Commun., 2007, 5200–5202 RSC.
- D. M. Li and Y. S. Zheng, Chem. Commun., 2011, 47, 10139–10141 RSC.
- Y. S. Zheng, S. Y. Ran, Y. J. Hu and X. X. Liu, Chem. Commun., 2009, 1121–1123 RSC.
- C. Reichardt, Solvents and Solvent Effects in Organic Chemistry, Wiley, Weinheim, 3rd edn, 2003 Search PubMed.
- A. Cooper and D. D. MacNicol, J. Chem. Soc., Perkin Trans. 2, 1978, 760–763 RSC.
- M. D. Truppo and N. J. Turner, Org. Biomol. Chem., 2010, 8, 1280–1283 RSC.
- D. W. Armstrong, L. W. Chang and S. S. C. Chang, J. Chromatogr. A, 1998, 793, 115–134 CrossRef CAS.
- J. Berglund, L. Cedergren and S. B. Andersson, Int. J. Pharm., 1997, 156, 195–200 CrossRef CAS.
- W. X. Huang, H. Xu, S. D. Fazio and R. V. Vivilecchia, J. Chromatogr. B: Biomed. Sci. Appl., 1997, 695, 157–162 CrossRef CAS.
- X. Y. Gong and P. C. Hauser, J. Chromatogr. A, 2005, 1094, 196–199 CrossRef CAS.
- H. Henning Winter, Encycl. Polym. Sci. Technol., 2003, 10, 132–145 Search PubMed.
- M. Djabourov, Polym. Int., 1991, 25, 135–143 CrossRef CAS.
- L. Bentea, M. A. Watzky and R. G. Finke, J. Phys. Chem. C, 2017, 121, 5302–5312 CrossRef CAS.
- P. Terech and R. G. Weiss, Chem. Rev., 1997, 97, 3133–3159 CrossRef CAS.
- M. K. Bain, M. Bhowmik, D. Maity, N. K. Bera, S. Ghosh and D. Chattopadhyay, J. Appl. Polym. Sci., 2010, 118, 631–637 CAS.
- C. Ferrari, E. Tombari, G. Salvetti and G. P. Johari, J. Chem. Phys., 2007, 126, 2–6 CrossRef.
- B. Escuder, M. LLusar and J. F. Miravet, J. Org. Chem., 2006, 71, 7747–7752 CrossRef CAS.
- P. J. Larkin, Infrared and Raman Spectroscopy, Elsevier Inc., The Netherlands, 1st edn, 2011 Search PubMed.
- O. Glatter and O. Kratky, Small Angle X-ray Scattering, Academic Press Inc., London, 1982 Search PubMed.
- Y. Nakai, K. Yamamoto, K. Terada, A. Kajiyama and I. Sasaki, Chem. Pharm. Bull., 1986, 34, 2178–2182 CrossRef CAS.
- P. Kang, K. M. Lee, W. K. Lee, K. H. Lee, B. Lee, J. Cho and N. H. Hur, RSC Adv., 2014, 4, 46203–46207 RSC.
- J. B. Segur and H. E. Oberstar, Ind. Eng. Chem., 1951, 43, 2117–2120 CrossRef CAS.
- N. Koifman, I. Biran, A. Aharon, B. Brenner and Y. Talmon, J. Struct. Biol., 2017, 198, 177–185 CrossRef CAS.
Footnote |
| † Electronic supplementary information (ESI) available. See DOI: 10.1039/d0ra07643k |
| This journal is © The Royal Society of Chemistry 2020 |

