 Open Access Article
A multifunctional use of bis(methylene)bis(5-bromo-2-hydroxyl salicyloylhydrazone): from metal sensing to ambient catalysis of A3 coupling reactions†
Krisana Peewasan *a,
Marcel P. Merkel
 b,
Olaf Fuhr
 bc,
Christopher E. Anson
 a and
Annie K. Powell
 *ab
*ab
aInstitute of Inorganic Chemistry, Karlsruhe Institute of Technology, Engesserstrasse 15, 76131 Karlsruhe, Germany. E-mail: krisana.peewasan@kit.edu; annie.powell@kit.edu
bInstitute of Nanotechnology, Karlsruhe Institute of Technology Campus North, Hermann-von-Helmholtz-Platz 1, 76344 Eggenstein-Leopoldshafen, Karlsruhe, Germany
cKarlsruhe Nano Micro Facility Karlsruhe Institute of Technolog, Hermann-von-Helmholtz-Platz 1, 76344 Eggenstein-Leopoldshafen, Germany
First published on 9th November 2020
Abstract
The potential use of bis(methylene)bis(5-bromo-2-hydroxylsalicyloylhydrazone) as a multifunctional fluorescence sensor for Cu2+, Ni2+, Co2+ and Fe2+ ions was investigated. The optical behaviour shows an increase in an absorption band at 408 nm which can be ascribed to the d–d transition (UV-vis) of the metal ions and a concomitant decrease in fluorescence intensity at 507 nm. The crystallographic analysis shows the binding site of the sensor to two Cu2+ ions and confirms the stoichiometry of 1![[thin space (1/6-em)]](https://www.rsc.org/images/entities/char_2009.gif) :
:![[thin space (1/6-em)]](https://www.rsc.org/images/entities/char_2009.gif) 2 (ligand to metal) which is in good agreement with a Job plot analysis. Furthermore the Cu2+-complex catalyses A3 coupling reactions at 1 mol% catalytic loading; chiral propargylamine derivatives were obtained in high yield after 24 h reaction time under ambient conditions.
2 (ligand to metal) which is in good agreement with a Job plot analysis. Furthermore the Cu2+-complex catalyses A3 coupling reactions at 1 mol% catalytic loading; chiral propargylamine derivatives were obtained in high yield after 24 h reaction time under ambient conditions.
Introduction
The design and development of chemosensors which provide high selectivity and sensitivity towards metal ions have attracted much attention from chemists, biologists and environmental scientists.1,2 Metal ions can play both beneficial and harmful roles depending on their speciation and concentration in natural systems. Among the 3d metal ions, the detection of these trace metals in biological systems has been intensively investigated. It is of particular interest to detect copper (Cu2+) because Cu2+ ions are the third most abundant in the human body after Fe3+ and Zn2+. The Cu2+ ions play crucial roles in several biological processes3 such as haemopoiesis as well as various enzyme-catalysed and redox reactions.4 Although an average concentration of Cu2+ in the body of 0.1 mM is required for biological processes high levels lead to various disorders such as Menkes and Wilson's diseases.5–8 Several techniques are widely used to detect copper ions, including atomic absorption spectroscopy (AAS)9 and inductively coupled plasma atomic emission or mass spectroscopy (ICP-AES, ICP-MS).10 However, the biggest drawbacks of these techniques are expense, complicated sample pre-treatment procedures and high sample volumes. Thus, alternative methods which provide high selectivity, simplicity and low cost are required such as colorimetric, fluorescence and electrochemical analysis. Through targeted ligand design metallosensors with high selectivity and sensitivity can be developed. Another important requirement is to make the system low-cost and atom efficient. To this end, a number of sensors utilising fluorescent dyes both in aqueous and organic phases has been reported.11–19 Although high selectivity and sensitivity were achieved, such fluorescent probes require meeting the challenge of multi-step synthesis and control of pH.Copper is not only used in biological processes, but is also well known as catalyst for A3 coupling,20–24 azide–alkyne cycloaddition (click-reaction)25,26 and aldol-type reactions.27 Among these, the A3 coupling reaction is of particular interest, because chiral propargylamines28 obtained from this reaction are crucial building blocks in organic chemistry for diastereoselective and enantioselective components which exhibit biologically activities and are common in natural products.29
We report here the synthesis of the bis(methylene)bis(5-bromo-2-hydroxyl salicyloylhydrazone) (=H6L) as a new fluorescent metal chemosensor and the application of its copper complexation for catalysis. H6L was designed as a potentially decadentate ligand with coordination of ten oxygen or nitrogen donor atoms. The decadentate coordination sites are provided by oxygen and nitrogen atoms arranged suitably for complexation to transition metal ions. Furthermore, the salicyloylhydrazone groups introduced in this ligand system can provide fluorescence properties making it possible track optical behaviour for various coordination compounds in comparison with those for the free ligand. The selectivity and sensitivity towards the metal dications Cu2+, Pb2+, Cd2+, Zn2+, Ni2+, Co2+, Fe2+ and Sn2+ in DMSO solution were investigated. Crystallographic analysis of the Cu2+-complex reveals the nature of the complexation of the H6L sensor showing a ligand![[thin space (1/6-em)]](https://www.rsc.org/images/entities/char_2009.gif) :
:![[thin space (1/6-em)]](https://www.rsc.org/images/entities/char_2009.gif) metal stoichiometry of 1
metal stoichiometry of 1![[thin space (1/6-em)]](https://www.rsc.org/images/entities/char_2009.gif) :
:![[thin space (1/6-em)]](https://www.rsc.org/images/entities/char_2009.gif) 2. The [Cu2(H5L)(NO3)2]NO3·0.5H2O·2CH3CN-complex was also used in a catalytic study for the A3 coupling reaction with 1 mol% loading under ambient conditions.
2. The [Cu2(H5L)(NO3)2]NO3·0.5H2O·2CH3CN-complex was also used in a catalytic study for the A3 coupling reaction with 1 mol% loading under ambient conditions.
Experimental
Materials and method
All reagents and solvents were used as received from commercial suppliers without further purification. Infrared spectra were recorded on a PerkinElmer Spectrum GX FT-IR spectrometer in ATR mode in the range 4000–400 cm−1. The following abbreviations were used to describe the peak characteristics: br = broad, sh = shoulder, s = strong, m = medium and w = weak. NMR spectra of the compounds were measured using a Bruker Ultrashield plus 500 (500 MHz) and Varian 500 MHz spectrometer. 1H- and 13C-measurements were recorded using deuterated solvents and referenced to tetramethylsilane (TMS) as an internal standard (δ = 0 ppm). The single crystal X-ray diffraction (SCXRD) data were collected on a STADIVARI diffractometer using Ga-Kα, λ = 1.34143 Å radiation with area detection using a Dectris Eiger2 R 4M detector. Powder X-ray diffraction (PXRD) measurements were performed on a STOE STADI-P diffractometer with Cu-Kα radiation. The optical properties were investigated using Fluoromax-4 spectrofluorometer and Shimadzu UV-24500 in the range 200–800 nm at room temperature using 1 cm path length cells. The stock solution of H6L (100 μM) and the corresponding metal ions solutions (1000 μM) were prepared in DMSO.Spectral analysis
The UV-vis absorption and fluorescence experiments were performed in DMSO. The spectral titration experiments were accomplished through a stepwise addition of Cu2+ solution (100 μM) to a solution of H6L (25 μM) in DMSO. The absorption intensity was recorded in the range 200–800 nm reference to DMSO. The fluorescence intensity was recorded at λex/λem = 310 nm/507 nm after shaking the solution and allowing to stand for 5 min to ensure proper mixing. Both the excitation and emission slits were set to 10.0 nm. The stoichiometry of the complex formed between H6L and Cu2+ was determined by preparing a series of solutions of H6L and Cu2+ at ratios of 1![[thin space (1/6-em)]](https://www.rsc.org/images/entities/char_2009.gif) :
:![[thin space (1/6-em)]](https://www.rsc.org/images/entities/char_2009.gif) 9, 2
9, 2![[thin space (1/6-em)]](https://www.rsc.org/images/entities/char_2009.gif) :
:![[thin space (1/6-em)]](https://www.rsc.org/images/entities/char_2009.gif) 8, 3
8, 3![[thin space (1/6-em)]](https://www.rsc.org/images/entities/char_2009.gif) :
:![[thin space (1/6-em)]](https://www.rsc.org/images/entities/char_2009.gif) 7, 4
7, 4![[thin space (1/6-em)]](https://www.rsc.org/images/entities/char_2009.gif) :
:![[thin space (1/6-em)]](https://www.rsc.org/images/entities/char_2009.gif) 6, 5
6, 5![[thin space (1/6-em)]](https://www.rsc.org/images/entities/char_2009.gif) :
:![[thin space (1/6-em)]](https://www.rsc.org/images/entities/char_2009.gif) 5, 6
5, 6![[thin space (1/6-em)]](https://www.rsc.org/images/entities/char_2009.gif) :
:![[thin space (1/6-em)]](https://www.rsc.org/images/entities/char_2009.gif) 4, 7
4, 7![[thin space (1/6-em)]](https://www.rsc.org/images/entities/char_2009.gif) :
:![[thin space (1/6-em)]](https://www.rsc.org/images/entities/char_2009.gif) 3, 8
3, 8![[thin space (1/6-em)]](https://www.rsc.org/images/entities/char_2009.gif) :
:![[thin space (1/6-em)]](https://www.rsc.org/images/entities/char_2009.gif) 2, and 9
2, and 9![[thin space (1/6-em)]](https://www.rsc.org/images/entities/char_2009.gif) :
:![[thin space (1/6-em)]](https://www.rsc.org/images/entities/char_2009.gif) 1 and recording the absorbance. The plot of [HG] versus [H]/([H] + [G]) was drawn to determine the stoichiometry using a Job plot analysis.
1 and recording the absorbance. The plot of [HG] versus [H]/([H] + [G]) was drawn to determine the stoichiometry using a Job plot analysis.
Preparation of the ligand (H6L)
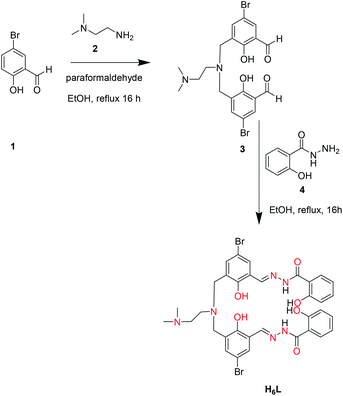
A mixture of 5-bromosalicylaldehyde (1, 4.20 g, 20 mmol), N,N′′-dimethylethylenediamine (2, 0.88 g, 10 mmol) and paraformaldehyde (1.2 g) was refluxed in ethanol for 16 h. The corresponding intermediate (3) was obtained in 68% yield after purification using column chromatography. It was then reacted with 2-hydroxybenzhydrazide (4, 3.48 g, 13.5 mmol) under reflux in ethanol (100 mL) for 16 h. The product bis(methylene)bis(5-bromo-2-hydroxyl salicyloylhydrazone) (H6L) was obtained as a yellow solid (92% yield) after removal of ethanol and washing with Et2O.Preparation of the copper complex [Cu2(H5L)(NO3)2]NO3·0.5H2O·2CH3CN
H6L (78 mg, 0.1 mmol) was dissolved in 5 mL of a mixture of acetonitrile and methanol (1![[thin space (1/6-em)]](https://www.rsc.org/images/entities/char_2009.gif) :
:![[thin space (1/6-em)]](https://www.rsc.org/images/entities/char_2009.gif) 1, % v/v) at room temperature. Then Cu(NO3)2·2.5H2O (56 mg, 2.0 mmol) was added to the solution and the reaction mixture was stirred at room temperature for 30 min. After standing for 7 days, crystals were collected by filtration (70% yield based on the ligand H6L). The powder product was characterised using IR, and PXRD (see ESI†).
1, % v/v) at room temperature. Then Cu(NO3)2·2.5H2O (56 mg, 2.0 mmol) was added to the solution and the reaction mixture was stirred at room temperature for 30 min. After standing for 7 days, crystals were collected by filtration (70% yield based on the ligand H6L). The powder product was characterised using IR, and PXRD (see ESI†).
Results and discussion
Design and synthesis of H6L and its optical properties
Ligand H6L was designed to have ten possible coordination sites from both O and N atoms as well as the potential to exhibit strong fluorescence. The preparation of H6L is versatile and straightforward, providing the final product in excellent (92%) yield via a two step reaction (Scheme 1).The optical properties of H6L were investigated. A 25 μM stock solution of H6L (100 μM) in DMSO was prepared for use as a working solution for a Job plot analysis and fluorescence experiments. The absorption maxima of the bands were found at 296 nm, 310 nm, 345 nm and 450 nm, the latter of which can be attributed to the n → π* transition of the C![[double bond, length as m-dash]](https://www.rsc.org/images/entities/char_e001.gif) N moiety. The absorption maximum at 310 nm was selected as excitation wavelength for the fluorescence experiment and both the excitation and emission slits were set to 10 nm. Strong fluorescence intensity of the free ligand H6L at 507 nm was observed (Fig. 1).
N moiety. The absorption maximum at 310 nm was selected as excitation wavelength for the fluorescence experiment and both the excitation and emission slits were set to 10 nm. Strong fluorescence intensity of the free ligand H6L at 507 nm was observed (Fig. 1).
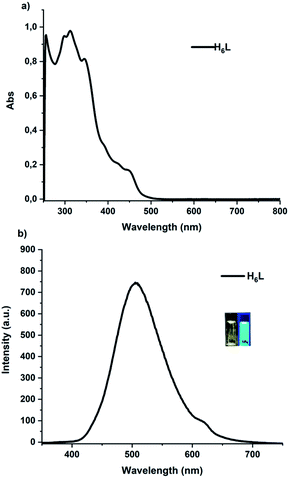 | ||
| Fig. 1 (a) Absorption and (b) fluorescence spectra of H6L. The measurement was carried out at room temperature, 25 μM in DMSO and λex = 310 nm, slit; 10 nm/10 nm were used. | ||
Use of H6L for Cu2+ sensing
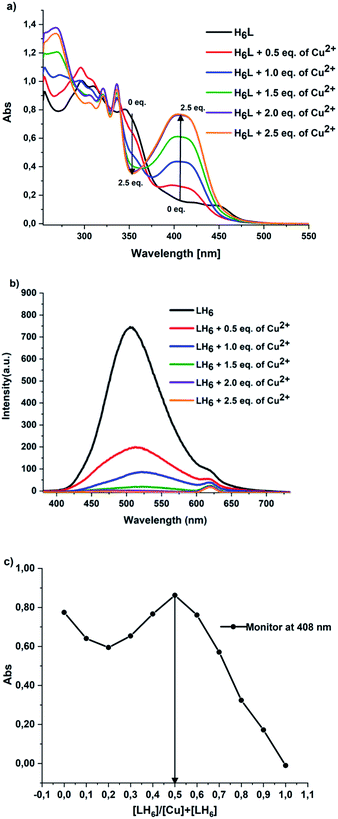
The potential use of H6L to detect Cu2+ ion was investigated by titration of a 25 μM solution of H6L with a 100 μM solution of Cu2+ in DMSO. A decrease in intensity of the absorption at 346 nm and an increase in intensity of a new band at 408 nm were observed on increasing the number of equivalents of Cu2+. The band at 408 nm is attributed to a d–d transition. Corresponding fluorescence titration experiments of the sensor H6L with increasing equivalents of Cu2+ show a concomitant decrease in fluorescence intensity at 507 nm of H6L. The fluorescence intensity of the free sensor H6L was completely quenched when 2.0 equivalents of Cu2+ were added. A Job plot analysis established a 1![[thin space (1/6-em)]](https://www.rsc.org/images/entities/char_2009.gif) :
:![[thin space (1/6-em)]](https://www.rsc.org/images/entities/char_2009.gif) 2 stoichiometry of H6L to Cu2+ (Fig. 2) with the lower limit of detection (LOD) found to be 0.036 μM, calculated using the UV-vis absorption data.
2 stoichiometry of H6L to Cu2+ (Fig. 2) with the lower limit of detection (LOD) found to be 0.036 μM, calculated using the UV-vis absorption data.
Chemoselectivity of H6L towards M2+
The response of H6L towards other M2+ ions was investigated. Absorptions were observed in the 370–450 nm range (Fig. 3a), but these were much weaker than the absorption at 408 nm observed for Cu2+ ions. The intensities of these absorptions show the trend Cu2+ > Ni2+ > Co2+ > Zn2+ > Sn2+ > Fe2+ > Pb2+ > Cd2+.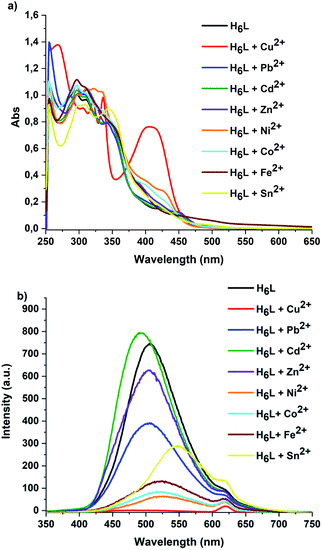 | ||
| Fig. 3 (a) UV-vis spectra of H6L + M2+, (b) fluorescence spectra of H6L + M2+ (λex = 310 nm, slit; 10 nm/10 nm) of H6L (25 μM) and M2+ (25 μM) in DMSO. | ||
The fluorescence behaviour of the H6L + M2+ systems showed similar trends to those of the absorption spectra. The fluorescence intensity decreases according to Cu2+ > Ni2+ > Co2+ > Fe2+ ⋙ Sn2+ ≫ Zn2+ ≫ Pb2+ ≫ Cd2+ (Fig. 3b) with a dramatic break between Fe2+ and Sn2+. Thus Cu2+, Ni2+, Co2+ and Fe2+ are the best candidates for chemosensing with H6L.
Structural details for [Cu2(H5L)(NO3)2]NO3·0.5H2O·2CH3CN
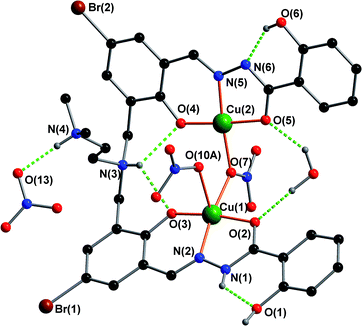
Fig. 4 shows the structural features of [Cu2(H5L)(NO3)2]NO3·0.5H2O·2CH3CN. The coordination sphere of Cu(1) consists of two-coordinating O atoms from the ligand (O(2) and O(3)), one nitrogen atom of the ligand (N(2)), one bridging O atom from one nitrate (O(7)) and one coordinated O atom from another nitrate (O(10)). The coordination environment of Cu(2) consists of two O atoms from the ligand (O(4) and O(5)), one nitrogen atom from the ligand (N(5)) and one bridging O atom from nitrate (O(7)), thus Cu(1) and Cu(2) are bridged via O(7), whereas O(10A) only coordinates to Cu(1). Furthermore, N(4) of the ligand is protonated and a N(4)–H⋯O(13) intermolecular hydrogen bond to a nitrate anion is build. O(5) and O(2) form either intermolecular hydrogen bonds to a water molecule. The protonated N(3) atom of the ligand form intramolecular hydrogen bonds to O(3) and O(4). Likewise, N(1) and N(6) build hydrogen bonds to O(1) and O(6), respectively. The Cu–O distance ranges from 1.889(2) to 2.595(4) Å, whereas the Cu–N distance is between 1.910(3) and 1.931(3) Å. The Cu–Cu distance is 3.5612(7) Å and the angle between Cu–O(7)–Cu is 126.62(15). The positive charges of the two Cu2+ ions are balanced by the deprotonated ligand at N(6) and three nitrate anions and the SHAPE30 analysis shows that the best coordination geometry of Cu(1) is spherical square pyramid with a deviation value 2.463 and the Cu(2) is appear square planar with a deviation value 0.246 but has O(10B) making long contact with 2.582 Å. The square-pyramidal coordination sphere of Cu(1) consists of one N and two O atoms from the ligand (N(2), O(2) and O(3)) and one unidentate bridging O atom O(7) from one nitrate, with a further O atom O(10) from the other nitrate in the apical position. The coordination environment of Cu(2) is similar to Cu(1) although Cu(2)-O(10A) is rather longer at 2.595(4) Å, and the molecule has approximate mirror symmetry. One of the hydrazine groups (N(1)) is still protonated, while N(6) is deprotonated and together with the three nitrates balances the charge. N(4) of the ligand is protonated with N(4)–H⋯O(13) forming an intermolecular hydrogen bond to a nitrate anion. The Cu–O distance ranges from 1.889(2) to 2.595(4) Å, whereas the Cu–N distance is between 1.910(3) and 1.931(3) Å. O(7) forms a unidentate eq,eq-bridge with Cu(1)–O(7)–Cu(2) = 126.62(15)° and Cu(1)⋯Cu(2) = 3.5612(7) Å. The other nitrate ligand shows minor disorder between unidentate bridging (78%) and syn,syn-bridging (22%) modes. SHAPE30 analysis shows that the best coordination geometry of Cu(1) is spherical square pyramid with a deviation value 2.463, while Cu(2) is square planar with a deviation value 0.246, although with a long contact of 2.582 Å to O(10B). A summary of the crystallographic refinement data (Table S1†) and SHAPE analysis (Table S2†) are given in the ESI.†Catalytic study
The investigation of the potential of [Cu2(H5L)(NO3)2]NO3·0.5H2O·2CH3CN as a catalyst for the A3 coupling reaction was explored. Cyclopentane carboxaldehyde (5), piperidine (6) and phenylacetylene (7) were chosen as reagents for a model reaction. The catalytic loading was first investigated with the reaction performed under aerobic conditions at room temperature for 16 h (Table 1). The efficiency of this catalytic system can be followed by monitoring the disappearance of the aldehyde proton signal at 9.60 ppm and the appearance of a new peak of the quaternary proton of the propargylamine product at 3.50 ppm.| Entry | Catalytic loading | Conversion yield (%) |
|---|---|---|
| a Conversion yields were calculated by the integration of 1H NMR at 9.60 ppm and 3.50 ppm after 16 h reaction time.b The comparison of entry 2 and entry 5 at 1 mol% loading performed over 16 h under the same reaction conditions performed 24 h, respectively, is shown in bold. | ||
| 1 | 5 mol% | 95a |
| 2 | 1 mol% | 92a |
| 3 | 0.5 mol% | 80a |
| 4 | 0.1 mol% | 78a |
| 5 | 1 mol% | 95b |
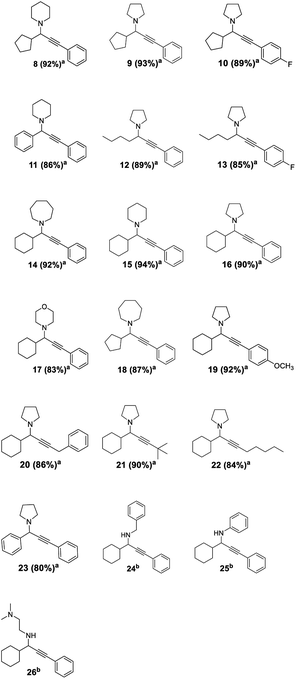
The results show that with 5 mol% catalytic loading the maximum conversion yield was obtained (95%, entry 1). However, reducing the catalytic loading to 1 mol% only affects the conversion yield by 3%. Increasing the reaction time to 24 h raises the conversion yield to 95% (entry 5). Thus, the catalytic loading of 1 mol% and reaction time of 24 h were chosen as test conditions for this system. The scope of the catalytic system was investigated using various aldehydes, alkynes and amines (Table 2). The reactions were carried out at room temperature for 24 h in i-PrOH and 4 Å molecular sieves were used to trap water. After 24 h, the reaction mixture was filtered through celite and washed with dichloromethane. The crude products were purified using column chromatography.
The high efficiency catalysis is clearly seen for the various combinations of aldehyde and secondary amine, with products attained in high yield with low catalytic loading, short reaction time and mild reaction conditions.31–34 However, no products were obtained when the aromatic and/or aliphatic primary amines were used. In addition, the stability of the catalyst used in this reaction was investigated using ESI-TOF mass spectrometry. The [Cu2(H5L)(NO3)2]NO3·0.5H2O·2CH3CN was dissolved in i-PrOH and the change in mass was monitored after 24 h, 48 h and 72 h (Fig. S27†). Regarding the results from mass spectroscopy, in solution, one coordinated nitrate was found to be removed from Cu(1) of the coordination cluster (mass cal. = 969.9178 m/z, found = 969.9068 m/z, Fig. S27†) resulting in a free reactive site on copper. This allows a possible mechanism for the A3 coupling reaction of this system to be proposed (Fig. 5). Furthermore, the compound was tested as a catalyst for click chemistry but without any success.
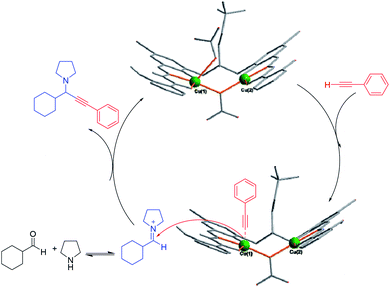 | ||
| Fig. 5 Possible mechanism for the A3 coupling reaction catalysed by [Cu2(H5L)(NO3)2]NO3·0.5H2O·2CH3CN. | ||
Conclusion
Bis(methylene)bis(5-bromo-2-hydroxyl salicyloylhydrazone) can be used as a multiple functionality ligand. Coordination complexes formed with this ligand can be used as a highly selective and sensitive fluorescent sensor for Cu2+, Ni2+, Co2+ and Fe2+ ions. The molecular structure of the copper(II) complex confirms the binding mode of the ligand with the metal to ligand stoichiometry of 2![[thin space (1/6-em)]](https://www.rsc.org/images/entities/char_2009.gif) :
:![[thin space (1/6-em)]](https://www.rsc.org/images/entities/char_2009.gif) 1 in line with results from a Job plot analysis. The presence of a d–d band at 408 nm proves that the copper is in the 2+ state. In addition, the application of the [Cu2(H5L)(NO3)2]NO3·0.5H2O·2CH3CN for catalysing A3 coupling reactions was found to have high efficiency in providing a wide range of products in high yields (>80%) with catalytic loading of 1 mol% and 24 h reaction time. Moreover, the stability of the catalytic system has been investigated and the results show the catalyst is stable over 72 h in i-PrOH solution. Furthermore, we extended the scope of this catalytic system for copper catalysed azide–alkyne cycloaddition (CuAAC) using benzyl azide and phenyl acetylene as a model reagent. However, the expected triazole product was not obtained. This can be explained by the fact that the Cu2+ is not usually suitable for click chemistry.
1 in line with results from a Job plot analysis. The presence of a d–d band at 408 nm proves that the copper is in the 2+ state. In addition, the application of the [Cu2(H5L)(NO3)2]NO3·0.5H2O·2CH3CN for catalysing A3 coupling reactions was found to have high efficiency in providing a wide range of products in high yields (>80%) with catalytic loading of 1 mol% and 24 h reaction time. Moreover, the stability of the catalytic system has been investigated and the results show the catalyst is stable over 72 h in i-PrOH solution. Furthermore, we extended the scope of this catalytic system for copper catalysed azide–alkyne cycloaddition (CuAAC) using benzyl azide and phenyl acetylene as a model reagent. However, the expected triazole product was not obtained. This can be explained by the fact that the Cu2+ is not usually suitable for click chemistry.
Conflicts of interest
The authors declare no conflict of interest.Acknowledgements
We thank the DFG for funding through SFB/TRR 88 “3MET” and the Helmholtz Association via POF STN. We would like to thank Prof. Dr Dieter Fenske for collecting the crystallographic data.References
- D. T. Quang and J. S. Kim, Chem. Rev., 2010, 110, 6280–6301 CrossRef CAS.
- B. Kaur, N. Kaur and S. Kumar, Coord. Chem. Rev., 2018, 358, 13–69 CrossRef CAS.
- M. Uauy, R. Olivares and M. Gonzalez, Am. J. Clin. Nutr., 1998, 67, 952S–959S CrossRef.
- H. Tapiero, D. M. Townsend and K. D. Tew, Biomed. Pharmacother., 2003, 57, 386–398 CrossRef CAS.
- D. J. Waggoner, T. B. Bartnikas and J. D. Gitlin, Neurobiol. Dis., 1999, 6, 221–230 CrossRef CAS.
- C. Vulpe, B. Levinson, S. Whitney and J. Gitschier, Nat. Genet., 1993, 3, 7–13 CrossRef CAS.
- K. J. Barnham, C. L. Masters and A. I. Bush, Nat. Rev. Drug Discovery, 2004, 3, 205–214 CrossRef CAS.
- I. Scheinberg and I. H. Sternlieb, Am. J. Clin. Nutr., 1996, 63, 842S–845S CrossRef CAS.
- A. P. S. Gonzáles, M. A. Firmino, C. S. Nomura, F. R. P. Rocha, P. V. Oliveira and I. Gaubeur, Anal. Chim. Acta, 2009, 636, 198–204 CrossRef.
- Y. Liu, P. Liang and L. Guo, Talanta, 2005, 68, 25–30 CrossRef CAS.
- Y. Zhou, J. Zhang, H. Zhou, Q. Zhang, T. Ma and J. Niu, J. Lumin., 2012, 132, 1837–1841 CrossRef CAS.
- D. Zhang, Y. Ma and R. An, Res. Chem. Intermed., 2015, 41, 5059–5069 CrossRef CAS.
- X. Cheng, Y. Zhou, Y. Fang, Q. Rui and C. Yao, RSC Adv., 2015, 5, 19465–19469 RSC.
- Y. Hu, J. Zhang, Y. Z. Lv, X. H. Huang and S. L. Hu, Spectrochim. Acta, Part A, 2016, 157, 164–169 CrossRef CAS.
- F. A. Abebe and E. Sinn, Tetrahedron Lett., 2011, 52, 5234–5237 CrossRef CAS.
- Y. S. Mi, Z. Cao, Y. T. Chen, Q. F. Xie, Y. Y. Xu, Y. F. Luo, J. J. Shi and J. N. Xiang, Analyst, 2013, 138, 5274–5280 RSC.
- S. Prabhu, S. Saravanamoorthy, M. Ashok and S. Velmathi, J. Lumin., 2012, 132, 979–986 CrossRef CAS.
- U. Fegade, S. K. Sahoo, S. Attarde, N. Singh and A. Kuwar, Sens. Actuators, B, 2014, 202, 924–928 CrossRef CAS.
- H. Yu, J. Y. Lee, S. Angupillai, S. Wang, S. Feng, S. Matsumoto and Y. A. Son, Spectrochim. Acta, Part A, 2015, 151, 48–55 CrossRef CAS.
- V. A. Peshkov, O. P. Pereshivko and E. V. Van Der Eycken, Chem. Soc. Rev., 2012, 41, 3790–3807 RSC.
- C.-J. L. Woo-Jin Yoo and L. Zhao, Aldrichimica Acta, 2011, 2, 43–51 Search PubMed.
- C. Wei, Z. Li and C. J. Li, Synlett, 2004, 9, 1472–1483 Search PubMed.
- L. Zani and C. Bolm, Chem. Commun., 2006, 41, 4263–4275 RSC.
- I. Jesin and G. C. Nandi, Eur. J. Org. Chem., 2019, 16, 2704–2720 CrossRef.
- H. C. Kolb, M. G. Finn and K. B. Sharpless, Angew. Chem., Int. Ed., 2001, 40, 2004–2021 CrossRef CAS.
- C. W. Tornøe, C. Christensen and M. Meldal, J. Org. Chem., 2002, 67, 3057–3064 CrossRef.
- Z. Liu, Z. Zhang, G. Zhu, Y. Zhou, L. Yang, W. Gao, L. Tong and B. Tang, Org. Lett., 2019, 21, 7324–7328 CrossRef CAS.
- D. Castagnolo, N. Scalacci, A Toscani and K Lauder, Chem. Rev., 2017, 117, 14091–14200 CrossRef.
- B. V. Rokade, J. Barker and P. J. Guiry, Chem. Soc. Rev., 2019, 48, 4766–4790 RSC.
- M. LlunellD. CasanovaJ. CireraS. Alvarez, SHAPE version 2.1, Universitat de Barcelona, Barcelona 2013 Search PubMed.
- C. Wei, Z. Li and C. J. Li, Org. Lett., 2003, 5, 4473–4475 CrossRef CAS.
- L. Shi, Y. Q. Tu, M. Wang, F. M. Zhang and C. A. Fan, Org. Lett., 2004, 6, 1001–1003 CrossRef CAS.
- Y. Zhang, P. Li, M. Wang and L. Wang, J. Org. Chem., 2009, 74, 4364–4367 CrossRef CAS.
- E. Loukopoulos, M. Kallitsakis, N. Tsoureas, A. Abdul-Sada, N. F. Chilton, I. N. Lykakis and G. E. Kostakis, Inorg. Chem., 2017, 56, 4898–4910 CrossRef CAS.
Footnote |
| † Electronic supplementary information (ESI) available: Experimental section, X-ray structure determinations, NMR spectra, IR spectra, UV-vis spectra and CIFs of complexes. CCDC 2001537. For ESI and crystallographic data in CIF or other electronic format see DOI: 10.1039/d0ra07687b |
| This journal is © The Royal Society of Chemistry 2020 |

