 Open Access Article
Coalbed methane diffusion and water blocking effects investigated by mesoscale all-atom molecular dynamic simulations
Qingzhong
Zhu
ab,
Ling
Lin
 c,
Zhong
Liu
ab,
Yunxiang
Luo
c,
Hongming
Fan
ab,
Wei
Guo
ab,
Chen
Zhang
ab,
Sanshuai
Wang
ab and
Wenjia
Luo
c,
Zhong
Liu
ab,
Yunxiang
Luo
c,
Hongming
Fan
ab,
Wei
Guo
ab,
Chen
Zhang
ab,
Sanshuai
Wang
ab and
Wenjia
Luo
 *c
*c
aThe CBM Exploration and Development Pilot Test Base of CNPC, Renqiu City, Hebei Province 062552, P. R. China
bHuabei Oilfield Company, CNPC, Renqiu City, Hebei Province 062552, P. R. China
cSchool of Chemistry and Chemical Engineering, Southwest Petroleum University, Chengdu, 610500, P. R. China. E-mail: luowenjia@swpu.edu.cn
First published on 17th November 2020
Abstract
In coalbed methane extraction processes, the water blocking effect (WBE) is a formation damage that limits the extraction efficiency. To investigate WBE mechanisms at the molecular level, realistic coal models must be developed to simulate the interplay between methane and liquid phase water in a coal matrix's mesopores and macropores. This study built a massive and highly scalable coal tube model with accurate all-atom force fields. Based on this model, we investigated the adsorption and diffusion of methane and liquid water in the mesopores of coal. We found that methane forms multiple layers of adsorption on the coal surface, and the diffusivity of methane strongly depends on pore sizes and the presence of water. When both methane and liquid water were loaded in the coal tube, the liquid phase formed a nearly impenetrable barrier that prevented methane diffusion. This work provides insights into the mechanism of the WBE and can facilitate further studies on WBE alleviating strategies.
1. Introduction
Coalbed methane (CBM) is an unconventional form of natural gas found in coal beds.1 Many factors, including the permeability of coal, the porosity and composition of coal, and the degree of gas saturation, dictate the CBM extraction efficiency.2 For example, hydraulic fracturing by a pressurized liquid (mostly water) is often used to increase the permeability of coal and facilitate the flow of methane to a wellbore. A better understanding of the methane flow mechanisms in coal can help engineers improve extraction technologies and guide decision-makers to take appropriate strategies in specific programs.The flow of methane in coal has two broad types. The first type is the diffusion of methane within the pore system of the coal matrix itself, and the second type is the fluid flow in fractures or cleats with aperture sizes ranging from micrometers to millimeters.2,3 Molecular dynamic (MD) simulations are powerful tools to tackle the first type of flow problem, such as predicting the desorption and diffusion behaviors of methane at a molecular level. However, MD methods are incapable of solving the second type of flow problem because the length and time scales are too large. Contrarily, experimental or numerical methods are routinely applied to study the second type of methane flow.4,5
In this study, we focus on the development and application of MD methods in simulating the interaction among methane, water, and coal at both microscale and mesoscale. MD simulations related to methane adsorption on coal surfaces are widely found in the literature. Earlier studies often concentrate on using a relatively simple molecular model, such as graphene6 or CmHn (m < 100)7 molecules, to represent the coal. Quantum chemical calculations were performed to gain insights on the mechanisms of methane adsorption, or sometimes competitive adsorption with other molecules like CO2.6–9 More recent investigations utilize larger coal models containing thousands of atoms and MD simulations to estimate the adsorption capability of coal and the diffusivity of methane under various temperatures, pressures, and concentrations.10–17
One of the limitations of the aforementioned MD studies10–17 is that they usually simulate the micropore (<2 nm) structures. According to the classification proposed by the International Union of Pure and Applied Chemistry (IUPAC), pores within the range of 2–50 nm are considered to be mesopores.18 A frequently used way to construct coal models is by placing a coal nanoparticle consisting of hundreds or thousands of atoms in the center of a simulation box and allowing methane or other molecules to be adsorbed around the particle.17,19,20 These models cannot be scaled up to introduce mesopores unless the particle contains several millions of atoms.
The water-blocking effect (WBE) is one of the formation damages that restrict the extraction efficiency of CBM reservoirs with low permeability.21,22 Experiments also found that WBE happens mainly in the mesopore to macropore range.23 Therefore, a model that is capable of simulating the mesopores or macropores in coal is indispensable.
The co-adsorption of methane and water on coal surfaces are topics for multiple MD studies. However, previous studies usually treated these substances as one mixed-phase instead of two separate phases. For example, Zhang et al. simulated the adsorption of CH4 on moist coal surfaces by introducing up to 3 wt% of water.24 Meng et al. performed a combined experimental and computational study of CH4 adsorption on wet coal surfaces.25 Xiang et al.,26 Yu et al.,27 Zhou et al.28 considered the competitive adsorption between CH4, H2O, and CO2. Billemont et al. studied the co-adsorption of CH4, H2O, and CO2 in a porous coal structure that resembles coal,29 while other researchers focused on CH4 adsorption on moist kerogens.30,31 The adsorption of liquid water on coal surfaces without methane has also been examined before,32,33 and the effects of surfactants were discussed.34
In this study, we aim to extend the understanding of the interaction between methane and water in a coal tube, specifically, when the number of methane and water molecules is huge (>104) enough to form two separate phases rather than a single mixed phase. We propose a more realistic and scalable coal model that can represent mesopore or even macropore structures of coal in Section 2.1. Based on this model, we explore the diffusivity of methane as influenced by pore sizes and the presence of water in Section 3. The origin and mechanism of the WBE are scrutinized in Section 3.4.
2. Methods
2.1 The coal model
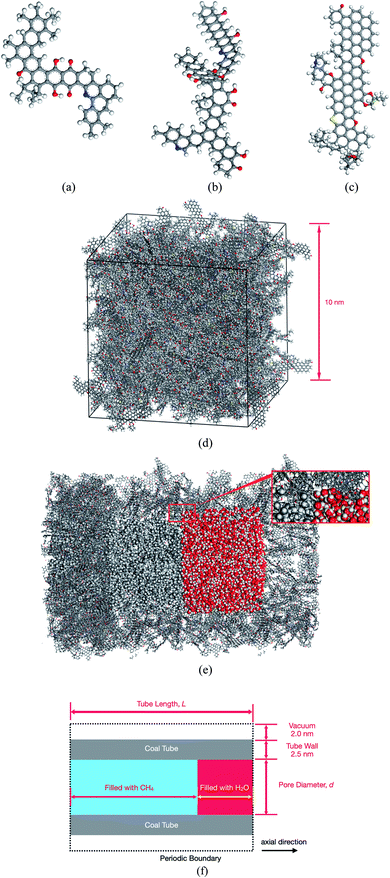
Coal has an amorphous structure. Numerous representations of coal can be found in the literature, ranging from molecular clusters of less than 100 atoms35 to large periodic cells with more than 104 atoms.36,37In this study, we chose the three molecular models proposed by Given38 (Fig. 1(a)), Given39 (Fig. 1(b)), and Fuchs and Sandhoff40 (Fig. 1(c)) for bituminous coals as building blocks to construct a complex model of coal. These three component molecules contain typical functional groups frequently found in coal. With an approximate ratio of 10![[thin space (1/6-em)]](https://www.rsc.org/images/entities/char_2009.gif) :
:![[thin space (1/6-em)]](https://www.rsc.org/images/entities/char_2009.gif) 1
1![[thin space (1/6-em)]](https://www.rsc.org/images/entities/char_2009.gif) :
:![[thin space (1/6-em)]](https://www.rsc.org/images/entities/char_2009.gif) 10, these three molecules were loaded into a 10.0 nm cubic cell by using the amorphous cell module of the Materials Studio 2017 software package.41 As shown in Fig. 1(d), the resultant cell with formula C40616H33353N431O2919S191 has a density of 0.97 g cm−3, which is lower than the actual coal density of around 1.30 g cm−3.36 However, this lower density originates from the micropores distributed within the coal cell and is appropriate in this study because the adsorption behaviors of CH4 and H2O in these pores are to be examined.
10, these three molecules were loaded into a 10.0 nm cubic cell by using the amorphous cell module of the Materials Studio 2017 software package.41 As shown in Fig. 1(d), the resultant cell with formula C40616H33353N431O2919S191 has a density of 0.97 g cm−3, which is lower than the actual coal density of around 1.30 g cm−3.36 However, this lower density originates from the micropores distributed within the coal cell and is appropriate in this study because the adsorption behaviors of CH4 and H2O in these pores are to be examined.
The coal cell was duplicated in all three directions and trimmed into a tube, as shown in Fig. 1(e). CH4 and H2O molecules were filled into the tube as needed in subsequent simulations. Several parameters, including the diameter (d) of the pore, the length (L) of the tube, and the amount of loaded CH4 and H2O, as illustrated in Fig. 1(f), are adjustable. A typical pore diameter considered in this study is 10 nm, which is in the range of mesopores (2–50 nm).18 Besides, as demonstrated by the inset in Fig. 1(e), the interior surface of our coal tube is not smooth but populated with micropores inherited from the cubic cell model, which can better simulate the real coal surface. Geometrical constraints were imposed to prevent CH4 or H2O molecules from escaping the tube through those micropores by placing a cylindrical carbon nanotube wall around the tube. The tube is periodic, which means that CH4 or H2O can flow within the tube across the boundary in the axial direction. The coal tube, along with the filled CH4 or H2O, constitute our simulation system. The largest system examined in this study contains 398![[thin space (1/6-em)]](https://www.rsc.org/images/entities/char_2009.gif) 456 atoms.
456 atoms.
2.2 Molecular dynamics
Molecular dynamic (MD) simulations were performed using the LAMMPS program.42 Pairwise interactions and atomic charges were described by the OPLS all-atom force field43 coupled with the TIP4P water model with cutoffs of 10 Å.44 Because of the large size of our model, we fixed the positions of coal atoms. Furthermore, CH4 and H2O molecules were treated as rigid bodies. Therefore, only non-bonded interactions, including van der Waals and electrostatic forces as given by eqn (1), are relevant in this study since all bonded interaction energies are constant throughout the simulation. | (1) |
Long-range interactions were summed by using the particle–particle–particle–mesh (pppm) method with an accuracy of 10−4.45 Because of the presence of the rigid coal tube, the size of the simulation box must be kept constant. Therefore all simulations were performed in the NVT ensemble with a Nosé–Hoover thermostat.46 The pressure within the coal tube was controlled by adjusting the loading of the filled CH4. Details of this approach are given in Section 3.1. Unless otherwise noted, the simulation temperature was 313 K (40 °C), the average temperature (27–52 °C) in a typical coalbed.47 All simulations were performed with a time step of 2 fs and a total integration time of 1000 ps.
Self-diffusion coefficients (Ds) of methane were estimated from the mean-squared displacement (MSD) based on the Einstein model (eqn (2)), where the summation runs over all CH4 molecules in the system, and rk(t) is the position of k-th CH4 molecule at time t.
 | (2) |
Methane has a critical temperature (Tc) of 190.56 K and a critical pressure (pc) of 4.592 MPa.48 Under the temperature (27–52 °C) and pressure (0–15 MPa) range relevant to this study, methane can be either a gas or a supercritical fluid. To ensure that our computational method can correctly capture the physical properties of methane, we calculated Ds of free methane molecules in a periodic 20 nm cubic box and compared them with experimental measurements,49 as shown in Fig. 2.
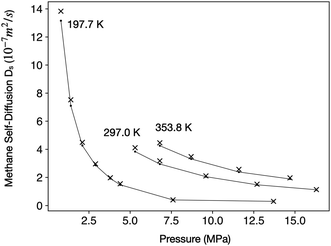 | ||
| Fig. 2 Comparison of experimental Ds from ref. 49 (black dots connected by lines) with values predicted by MD simulations (‘x’ symbols) under three different temperatures. | ||
The close match between estimated and experimental Ds in wide temperature and pressure ranges suggests that our computational method can accurately describe the behaviors of methane in both gaseous and supercritical phases. Therefore, in the subsequent text, we shall not distinguish between gaseous methane and supercritical methane for the sake of conciseness. Conclusions from this study should apply to both phases.
3. Results and discussion
3.1 Adsorption of methane
The adsorption behavior of CH4 in the coal tube under different pressures, i.e. the adsorption isotherm, could be estimated using the grand canonical Monte Carlo (GCMC) method in conventional simulations.50 However, the large size of the system prevents us from carrying out GCMC calculations.To circumvent this difficulty, we took an alternative and equally accurate approach by performing a series of runs in which a gradually increased number of CH4 molecules were filled into the coal tube. After a system has reached equilibrium, the density of CH4 (ρCH4) averaged along the axial direction becomes a function of the radial distance from the coal tube wall. Because of the van der Waal attraction between CH4 and coal molecules, a high density near the tube wall is expected. However, in areas far from the tube wall, ρCH4 asymptotically converges to a fixed value ρ. The pressure of methane can then be calculated from ρ through an equation of state, such as the Peng–Robinson equation.51 Based on the total number of CH4 molecules in the coal tube and the methane pressure, isotherms can be generated.
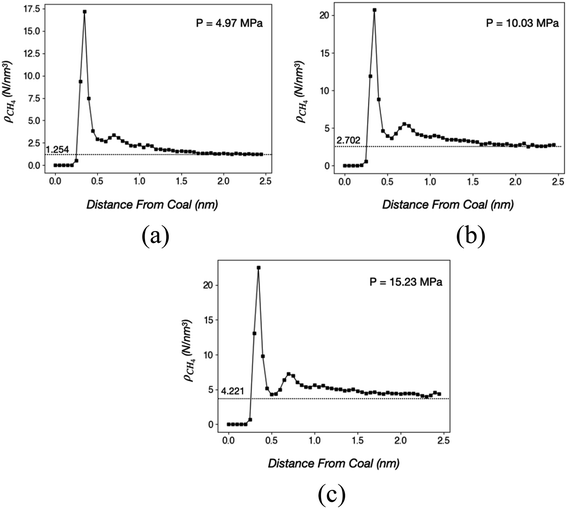
In this study, we loaded CH4 molecules into a coal tube with L = 20.0 nm and d = 10.0 nm. The structures are similar to Fig. 1(f) except that CH4 fills the entire tube without any H2O. At 40 °C, ρCH4 versus radial distances from the wall under three different CH4 loadings are shown in Fig. 3.
Fig. 3 suggests that at least two layers of CH4 molecules are adsorbed on coal under 40 °C and pressures between 5 MPa and 15 MPa. The first and the second layers are approximately 0.35 and 0.7 nm away from the coal, respectively. Heights of the first and the second peak are directly proportional to the pressure, indicating that a larger number of molecules are adsorbed on the coal surface under higher pressures. However, the percentage of surface-bound CH4 decreases at higher pressures because the coal surface is gradually saturated. Quantitatively, the numbers and percentages of surface-bound CH4 molecules (within 1.0 nm from the surface) are 1973 (54.2%), 2718 (44.3%), and 3198 (38.0%) in the three cases of Fig. 3(a)–(c), respectively.
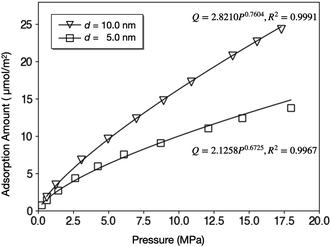
The isotherms of CH4 adsorption in a coal tube with d = 10.0 nm and d = 5.0 nm under 40 °C are shown in Fig. 4. Because of the multilayer adsorption, the isotherms cannot be described by a monolayer Langmuir model. Contrarily, the Freundlich model of eqn (3) is accurate. In this model, Q is the adsorption amount in µmol m−2, k and n are empirical constants, and P is the pressure in MPa. Fig. 4 displays the fit curves along with fitting parameters based on the Freundlich model.
 | (3) |
A direct comparison with experiments was not easy because the core sizes and specific surface areas of coal vary significantly from sample to sample. By assuming a specific surface area of 6.88 m2 g−1,52 the adsorption amount of d = 10.0 nm tube under 10 MPa (16.32 µmol m−2) is equal to 2.80 cm3 g−1, which is lower than the Langmuir volume measured by some experiments, for example, 36.00 cm3 g−1.53 This discrepancy can be explained by the existence of macropores (d > 50 nm) in coal samples since larger pores have higher adsorption capacity per surface area. Fig. 4 supports this speculation by demonstrating that the adsorption amount under 10.0 MPa increases by 62% from 10.0 µmol m−2 to 16.2 µmol m−2 when the tube diameter doubles.
3.2 Self-diffusion of methane
We varied the diameter of the coal tube and calculated the methane self-diffusion coefficients Ds. The results under 40 °C and 5 MPa, 10 MPa, and 15 MPa are listed in Table 1. For comparison, Ds of pure CH4 in a 20 nm periodic cubic box is also included.| d (nm) | D s (m2 s−1) | ||
|---|---|---|---|
| 5 MPa | 10 MPa | 15 MPa | |
| 1.0 | 4.94 × 10⁻¹⁰ | 3.18 × 10⁻¹⁰ | 2.73 × 10⁻¹⁰ |
| 2.0 | 6.61 × 10⁻⁹ | 5.84 × 10⁻⁹ | 2.92 × 10⁻⁹ |
| 5.0 | 2.33 × 10⁻⁸ | 1.74 × 10⁻⁸ | 1.56 × 10⁻⁸ |
| 10.0 | 5.42 × 10⁻⁸ | 3.77 × 10⁻⁸ | 2.59 × 10⁻⁸ |
| Free CH4 | 4.89 × 10⁻⁷ | 2.21 × 10⁻⁷ | 1.42 × 10⁻⁷ |
Results in Table 1 indicate that Ds values are lower at higher pressures. For example, in the d = 10 nm pore, Ds under 15 MPa is roughly one half of that under 5 MPa. However, Ds depends more strongly on the pore diameter since it decreases by several orders of magnitude as the diameter increases. In a tube with a diameter of only 1.0 nm, nearly all CH4 are immobilized on the coal surface through adsorption. Therefore, Ds in d = 1.0 nm tube corresponds to the surface diffusion coefficient and roughly matches the experimental values between 2.0 × 10⁻¹¹ and 8.0 × 10⁻¹¹ m2 s−1.53 As the diameter increases, CH4 molecules gain more mobility as suggested by the larger values of Ds. When d = 5.0 nm or d = 10.0 nm, a CH4 molecule interacts with both the tube wall and other gas molecules. Thus, the diffusion becomes Knudsen form. In the extreme case of an infinite diameter, bulk diffusion dominates, and Ds should approach that of bulk CH4, which is 2.21 × 10⁻⁷ m2 s−1 at 313 K and 10 MPa according to our estimation and 2.05 × 10⁻⁷ m2 s−1 as reported by literature under a similar temperature (333 K) and pressure (11 MPa).54
3.3 Adsorption and diffusion of liquid water
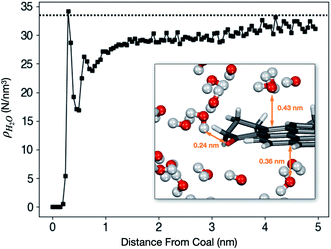
Liquid H2O was loaded into a coal tube with L = 10.0 nm and d = 10.0 nm. The average density ρ as a function of the radial distance from the tube wall after the system reaches equilibrium is shown in Fig. 5.The hydrophobic effect of coal is visible from Fig. 5. The first peak appears around 0.30 nm. However, the peak density (34.1 molecules per nm3) is only marginally higher than the bulk density. The inset in Fig. 5 shows that H2O molecules are at least 0.3 nm away from the coal molecule unless there is a hydrogen-bond-forming functional group such as C![[double bond, length as m-dash]](https://www.rsc.org/images/entities/char_e001.gif) O or O–H.
O or O–H.
Outside the first shell, ρH2O is lower than and gradually approaches the bulk density. ρH2O at the core of the cube (far from the surface) is still slightly lower than 1.0 g cm−3 because it is impossible to fill the tube completely full. Before the start of the simulation, extra spaces must be left between water and coal to avoid crashes of the simulation program due to strong repulsion.
Liquid water has a much lower diffusivity compared with CH4. We estimated Ds = 3.107 × 10⁻⁹ m2 s−1 for H2O based on the above model.
3.4 Evolution of the CH4/H2O interface
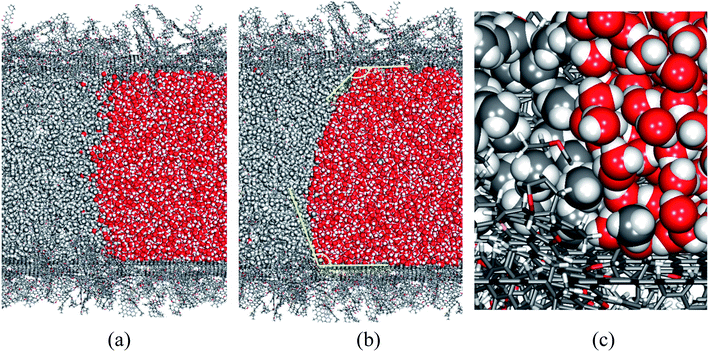
In this study, we aim at understanding the influence of liquid water, which is commonly encountered during CBM extraction, on the adsorption and diffusion of methane. We created a tube model, as illustrated in Fig. 1(f), to represent the co-existence of methane and liquid water phases in coal. In this model, L = 40.0 nm and d = 10.0 nm. The lengths of the CH4 and H2O phases in the axial direction are 30.0 nm and 10.0 nm, respectively.Without a pressure gradient, methane and water in the coal tube will not flow in any direction. Still, the methane/water interface evolves with time, and component molecules diffuse in all directions, including across the phase boundary. Fig. 6 shows the structures of the phase interface at the beginning (after an initial structural relaxation) and at the end of the simulation. A meniscus and contact angles greater than 90° between water and the coal surface are visible, which is expected because of the hydrophobic nature of coal molecules.
During our 1000 ps simulation, the liquid water phase occupies the right side of the tube and prevents the methane phase from flowing, meaning that water blocks the coal pore. However, we also found that a small number of CH4 and H2O molecules diffuse into the other phase. In Fig. 7, we plot the logarithms of the mole fractions of methane (xCH4) and water (xH2O) as functions of axial distances from the phase interface. The x-origins of these plots are the position of the phase interface, which is further defined as the point where xCH4 ≈ xH2O ≈ 0.5.
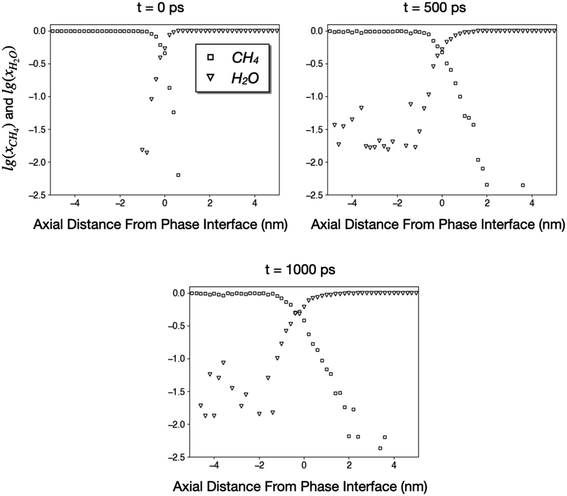 | ||
| Fig. 7 Logarithms of mole fractions of CH4 and H2O as functions of distances from the phase interface. The CH4 and H2O phases correspond to regions where x < 0 and x > 0, respectively. | ||
Fig. 7 indicates that a small number of CH4 and H2O molecules diffuse into the other phase as far as 4 nm during a simulation of 1000 ps. The diffusivity of H2O in CH4 is much higher than that of CH4 in liquid water since the water vapor concentration in methane is greater than 0.01 until at least 4 nm from the interface. On the other hand, the concentration of CH4 in the water at 2–4 nm away from the interface is approximately 0.004, which corresponds to a Henry's constant of 0.0022 mol kg−1 bar−1 and reasonably close to the experimental solubility of methane in water (0.0014 mol kg−1 bar−1).55 Nonetheless, the majority of methane was not able to penetrate the liquid phase. The concentrations of CH4 in liquid water at 500 ps and 1000 ps are almost identical, suggesting that the system has reached equilibrium, and water has blocked the coal pore.
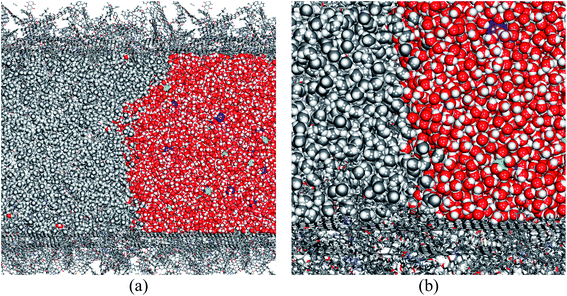
Since in industrial applications, the fracturing fluids are saline, containing KCl to inhibit clay swelling in most cases, we have also considered the influence of impurities by introducing 2 wt% of KCl into the water phase. The structure of the phase interface after 1000 ps of simulation is shown in Fig. 8. A comparison with the pure water scenario (Fig. 6) suggests that salt does not alter the hydrophobic nature of the coal surface, and the liquid phase can still block the coal pore. Therefore, conclusions from this paper also apply to saline water.
4. Conclusions
We have constructed a large realistic atomic model for coal to investigate the water-blocking effect in CBM extraction processes. Our model is scalable and can be adjusted to represent micro-, meso-, or even macro-size pores in coal.Adsorption of methane in our coal model indicates that methane can form multiple adsorption layers on the coal surface in mesopores, which can be accurately described by a Freundlich adsorption model rather than a Langmuir model. Self-diffusion of methane in our coal models suggests that the diffusivity of CH4 depends strongly on the pore size, which transitions from surface to Knudsen and then bulk diffusion as the pore size increases from micro- to meso- and macro-scale. The diffusion coefficients of CH4 in coal reported in different studies may differ by several orders of magnitude. Our results may explain this discrepancy because the dependency of diffusion on pore sizes was often not considered.
The presence of liquid water impedes the mobility of methane. A water plug with 10 nm length completely blocks a d = 10 nm coal tube. Although the coal surface is hydrophobic, the liquid water is stable and remains as a continuous phase with no tendency to break into smaller beads during a 1000 ps simulation. Methane is unable to penetrate the water phase, although a small quantity of methane diffuses into the water.
Our models and methods developed in this study can be extended to simulate the CBM extraction process and the influence of water on a longer time or length scale. Specifically, we have only simulated the phase equilibrium between methane and water. However, methane extraction is a dynamic process that involves depressurization and flow of methane and water within the coal matrix and cleats. Although the relationship between the depressurization rate and extraction efficiency has been extensively discussed in the literature, it is still a challenge to simulate the depressurization process through MD methods because the large length and time scales require huge molecular models and very long simulation time. Our model presented in this work may provide a framework for MD simulations of depressurization processes. For example, our further investigations will be focused on the flow of methane and water in the coal tube under the presence of pressure gradients.
This work suggests that the WBE may originate from the stability of the liquid water phase in micropores or mesopores of coal. Possible methods of alleviating WBE may include elevating the coalbed temperature, increasing the depressurization rate, introduction of surfactants to increase the hydrophobicity of coal, or injection of CO2 to expel CH4 molecules. These strategies can be tested by using MD methods and should be the topics of future studies.
Author contributions
Conceptualization, Qingzhong Zhu and Wenjia Luo; methodology, Ling Lin; software, Wenjia Luo, Chen Zhang, Sanshuai Wang; validation, Ling Lin, Zhong Liu and Yunxiang Luo; formal analysis, Hongming Fan; investigation, Wei Guo; resources, Qingzhong Zhu, Ling Lin; data curation, Qingzhong Zhu; writing—original draft preparation, Ling Lin; writing—review and editing, Wenjia Luo; visualization, Hongming Fan; supervision, Ling Lin and Wenjia Luo; project administration, Qingzhong Zhu, Wenjia Luo; funding acquisition, Qingzhong Zhu, Ling Lin, and Wenjia Luo.Funding
This research was funded by National Major Science and Technology Projects of China, grant number 2017ZX05064.Conflicts of interest
The authors declare no conflict of interest.References
- M. Mastalerz, in Future Energy, ed. T. M. Letcher, Elsevier, Boston, second edn, 2014, pp. 145–158, DOI:10.1016/B978-0-08-099424-6.00007-7.
- T. A. Moore, Int. J. Coal Geol., 2012, 101, 36–81 CrossRef CAS.
- H. L. Ramandi, P. Mostaghimi, R. T. Armstrong, M. Saadatfar and W. V. Pinczewski, Int. J. Coal Geol., 2016, 154–155, 57–68 CrossRef CAS.
- S. E. Laubach, R. A. Marrett, J. E. Olson and A. R. Scott, Int. J. Coal Geol., 1998, 35, 175–207 CrossRef CAS.
- C. R. Clarkson, R. M. Bustin and J. H. Levy, Carbon, 1997, 35, 1689–1705 CrossRef CAS.
- X.-Q. Liu, Y. Xue, Z.-Y. Tian, J.-J. Mo, N.-X. Qiu, W. Chu and H.-P. Xie, Appl. Surf. Sci., 2013, 285, 190–197 CrossRef CAS.
- N.-X. Qiu, Y. Xue, Y. Guo, W.-J. Sun and W. Chu, Comput. Theor. Chem., 2012, 992, 37–47 CrossRef CAS.
- R. Pini, S. Ottiger, G. Storti and M. Mazzotti, Adsorption, 2010, 16, 37–46 CrossRef CAS.
- B. Nie, L. Wang, X. Li, C. Wang and L. Li, Int. J. Min. Sci. Technol., 2013, 23, 919–923 CrossRef CAS.
- J. Zhang, K. Liu, M. B. Clennell, D. N. Dewhurst and M. Pervukhina, Fuel, 2015, 160, 309–317 CrossRef CAS.
- S. Yu, Z. Yan-Ming and L. Wu, Appl. Surf. Sci., 2017, 396, 291–302 CrossRef CAS.
- H. Hu, L. Du, Y. Xing and X. Li, Fuel, 2017, 187, 220–228 CrossRef CAS.
- Y. Dang, L. Zhao, X. Lu, J. Xu, P. Sang, S. Guo, H. Zhu and W. Guo, Appl. Surf. Sci., 2017, 423, 33–42 CrossRef CAS.
- Y. Song, B. Jiang and F. L. Li, IOP Conf. Ser.: Mater. Sci. Eng., 2017, 213, 012014 Search PubMed.
- S. Yu, J. Bo and Q. Meijun, Energy Fuels, 2018, 32, 3085–3096 CrossRef CAS.
- Y. Yang, L. Lin, M. Li, X. Zhang, C. Yang, Y. Wang, B. Fan, C. Chen and W. Luo, Appl. Sci., 2019, 9, 3421 CrossRef CAS.
- K. Dong, F. Zeng, J. Jia, C. Chen and Z. Gong, Mol. Simul., 2019, 45, 15–25 CrossRef CAS.
- J. Rouquerol, D. Avnir, C. W. Fairbridge, D. H. Everett, J. M. Haynes, N. Pernicone, J. D. F. Ramsay, K. S. W. Sing and K. K. Unger, Pure Appl. Chem., 1994, 66, 1739–1758 CAS.
- S. Yu, J. Bo and L. Fengjuan, Fuel, 2019, 235, 23–38 CrossRef CAS.
- T. J. Tambach, J. P. Mathews and F. van Bergen, Energy Fuels, 2009, 23, 4845–4847 CrossRef CAS.
- A. Mirzaei-Paiaman, M. Masihi and J. Moghadasi, Pet. Sci. Technol., 2011, 29, 1187–1196 CrossRef CAS.
- Y. Lu, H. Li, J. Lu, S. Shi, G. G. X. Wang, Q. Ye, R. Li and X. Zhu, Process Saf. Environ. Prot., 2020, 138, 292–299 CrossRef CAS.
- Z. Xu, Z. Li, C. Wang and C. D. Adenutsi, J. Nat. Gas Sci. Eng., 2016, 36, 486–495 CrossRef CAS.
- J. Zhang, M. B. Clennell, D. N. Dewhurst and K. Liu, Fuel, 2014, 122, 186–197 CrossRef CAS.
- J. Meng, S. Li, J. Niu, H. Meng, R. Zhong, L. Zhang and B. Nie, Environ. Earth Sci., 2020, 79, 44 CrossRef CAS.
- J. Xiang, F. Zeng, H. Liang, B. Li and X. Song, Sci. China: Earth Sci., 2014, 57, 1749–1759 CrossRef CAS.
- S. Yu, J. Bo and L. Wu, Phys. Chem. Chem. Phys., 2017, 19, 17773–17788 RSC.
- W. Zhou, H. Wang, Z. Zhang, H. Chen and X. Liu, RSC Adv., 2019, 9, 3004–3011 RSC.
- P. Billemont, B. Coasne and G. De Weireld, Langmuir, 2013, 29, 3328–3338 CrossRef CAS.
- L. Huang, Z. Ning, Q. Wang, R. Qi, Y. Zeng, H. Qin, H. Ye and W. Zhang, Fuel, 2018, 211, 159–172 CrossRef CAS.
- J. Zhou, Q. Mao and K. H. Luo, Energy Fuels, 2019, 33, 5368–5376 CrossRef CAS.
- W. Zhang, M. He, H. Wei, X. Zhu, X. You, X. Lyu and L. Li, Mol. Simul., 2018, 44, 769–773 CrossRef CAS.
- T. Vu, A. Chaffee and I. Yarovsky, Mol. Simul., 2002, 28, 981–991 CrossRef CAS.
- X. You, M. He, W. Zhang, H. Wei, Q. He, X. Lyu and L. Li, Mol. Simul., 2018, 44, 722–727 CrossRef CAS.
- A. L. C. Jonathan and P. Mathews, Fuel, 2012, 96, 1–14 CrossRef.
- Z. Zhang, Q. Kang, S. Wei, T. Yun, G. Yan and K. Yan, Energy Fuels, 2017, 31, 1310–1317 CrossRef CAS.
- Z. Lei, D. Yang, Y.-h. Zhang and P. Cui, J. Fuel Chem. Technol., 2017, 45, 769–779 CrossRef CAS.
- P. Given, Advances in organic geochemistry: proceedings of the international meeting in Milan, Macmillan, New York, 1962, pp. 39–48 Search PubMed.
- P. Given, Fuel, 1960, 39, 147–153 CAS.
- W. Fuchs and A. G. Sandhoff, Ind. Eng. Chem., 1942, 34, 567–571 CrossRef CAS.
- BIOVIA Dassault Systèmes, Materials Studio 2017, 5005 Wateridge Vista Drive, San Diego, CA 9212, USA, 2016 Search PubMed.
- S. Plimpton, J. Comput. Phys., 1995, 117, 1–19 CrossRef CAS.
- W. L. Jorgensen, D. S. Maxwell and J. Tirado-Rives, J. Am. Chem. Soc., 1996, 118, 11225–11236 CrossRef CAS.
- W. L. Jorgensen, J. Chandrasekhar, J. D. Madura, R. W. Impey and M. L. Klein, J. Chem. Phys., 1983, 79, 926–935 CrossRef CAS.
- R. W. Hockney and J. W. Eastwood, Computer simulation using particles, CRC Press, 1988 Search PubMed.
- W. Hoover, Canonical Dynamics: Equilibrium Phase-Space Distributions, 1985 Search PubMed.
- J. C. Pashin and M. R. McIntyre, Int. J. Coal Geol., 2003, 54, 167–183 CrossRef CAS.
- U. Setzmann and W. Wagner, J. Phys. Chem. Ref. Data, 1991, 20, 1061–1155 CrossRef CAS.
- R. Dawson, F. Khoury and R. Kobayashi, AIChE J., 1970, 16, 725–729 CrossRef CAS.
- Y. Liu, Y. Zhu, W. Li, J. Xiang, Y. Wang, J. Li and F. Zeng, J. Nat. Gas Sci. Eng., 2016, 30, 119–126 CrossRef CAS.
- D.-Y. Peng and D. B. Robinson, Ind. Eng. Chem. Fundam., 1976, 15, 59–64 CrossRef CAS.
- Y. Zhang, J. Zhu, Q. Lyu, J. Liu and F. Pan, J. Energy Inst., 2020, 93, 2096–2107 CrossRef.
- J. Dong, Y. Cheng, Q. Liu, H. Zhang, K. Zhang and B. Hu, Energy Fuels, 2017, 31, 2643–2651 CrossRef CAS.
- A. Greiner‐Schmid, S. Wappmann, M. Has and H. D. Lüdemann, J. Chem. Phys., 1991, 94, 5643–5649 CrossRef.
- P. J. Linstrom and W. Mallard, NIST chemistry webbook, National Institute of Standards and Technology, Gaithersburg MD, 2001 Search PubMed.
| This journal is © The Royal Society of Chemistry 2020 |

