 Open Access Article
Hydrogenation of CO to olefins over a supported iron catalyst on MgAl2O4 spinel: effects of the spinel synthesis method†
Yu Wanga,
Hou-Xing Lia,
Xue-Gang Lia,
Wen-De Xiao *a and
De Chenb
aShanghai Jiao Tong University, Shanghai, China. E-mail: wdxiao@sjtu.edu.cn
bNorwegian University of Science and Technology, 7491 Trondheim, Norway
First published on 9th November 2020
Abstract
In the process of CO hydrogenation to olefins by the Fischer–Tropsch synthesis (FTO), the support is a key factor in the activity, selectivity, and thermal and chemical stability of the catalysts, and magnesium aluminate spinel (MgAl2O4) has recently been reported to be very effective. In this work, three methods, namely, citric acid solution combustion (MAC), EDTA sol–gel (MAG) and NH3-coprecipitation (MAP) have been employed to prepare the spinel with detailed characterization of the structure, specific surface area, porosity, and alkalinity properties of both the as-synthesized spinel and the supported catalysts. The results showed that MAC and MAG possessed stronger basicity with more homogeneous particle sizes and narrower distribution of the pore size due to the formation of the metal-nitrate–chelate-complex. This led to a large quantity of gas being released during calcination, however, stronger interactions between the active phase and MAC resulted in lower CO conversion. The catalyst supported on MAP (CMAP) exhibited the highest CO conversion, the highest selectivity of lower olefins, the shortest induction period of reaction, and the lowest AFS chain growth probability; thus, MAP was suggested as an applicable synthetic method. Based on the CMAP catalyst, the effects of the operational conditions were investigated and a 200 hour stability test was carried out with satisfactory performance.
1. Introduction
Olefins, especially ethylene, propylene, and butene, are typically produced from petroleum through naphtha cracking. Beyond the petroleum process, from coal and natural gas, olefins can be produced via the well-known Fischer–Tropsch (FT) hydrogenation of CO via syngas (H2 + CO) on iron catalyst.1 The conventional iron-based catalysts are divided into two categories: the unsupported (bulk or molten iron oxide) and the supported.2,3 The unsupported catalyst is mechanically unstable at relatively higher temperatures, and the undesirable Boudouard reaction (2CO → C + CO2) causes excessive carbon deposition when the FT process is operated at higher temperatures to steer the product selectively toward lighter hydrocarbons.3,4For supported catalysts, the key properties such as the specific surface area, porosity, and channel morphology of the support determine the dispersion of the active components.5 Besides, the acidity of the support exerts its influence on its interaction with the active phase, and on the catalytic performance.6–9 The Hägg iron carbide (χ-Fe5C2) has been generally accepted as the active phase for the FT reactions.10–12 Many previous works found that the χ-Fe5C2 crystal facet greatly affects the catalytic performance and the formation of the Hägg iron carbide strongly depends on the interaction between the iron species and the support.12–14 To gain further insight into the properties of the support and their effects on the catalytic performance, and to determine the optimal combination of support, active metal, and promoter, extensive endeavors have been conducted to clarify the interactions between the active phase and the support.7,8,15,16
The commonly used supports, like oxides and carbon materials, have been reported for FT reactions.16–23 From a practical standpoint, most research efforts focus on oxide carriers due to their lower cost. Park and co-workers24 have presented the effects of the crystal phase and the pore structure of Al2O3 by the calcination of boehmite or gibbsite under different temperatures and found that the active particle size and distribution greatly relied on the pore structure of Al2O3. The well-dispersed iron-on γ-Al2O3 leads to the formation of aluminates, due to the strong interaction between iron and Al2O3, which is more difficult to reduce and hinders the formation of active carbide iron, thus lowering the FT activity.24
Spinel is a unique material, with a general formula of AB2O4, in which A is a bivalent cation such as Mg2+, Ni2+, Zn2+, Fe2+, etc., and B is a trivalent cation such as Al3+, Co3+, Cr3+, Fe3+, etc., with a cubic crystal system. Because of its favorable properties, such as excellent mechanical strength with low expansion at high temperature, satisfactory thermal and chemical stability, and high resistance to chemical attack, MgAl2O4 has been used as a carrier for the catalytic process at high temperature such as in steam reforming, methanation, dehydrogenation and cracking processes.25–29 Abbas and Chen30 studied the hierarchical porous spinel MFe2O4 (M = Fe, Zn, Ni and Co) synthesized by hydrothermal reaction. In the FT area, it has been reported that alkaline promoters such as K2O, MnO and MgO could improve the olefin selectivity.31–33 Inspired by previous works, magnesium-aluminate spinel (MgAl2O4) has been employed as a support for iron-based FT catalysts for olefin on-purpose production (FTO) by the authors recently.34,35
It was found that the properties of MgAl2O4 are strongly associated with the synthesis method.36 To date, methods including solid-state, co-precipitation, hydrothermal, sol–gel, combustion and spray drying, and metal–chitosan complexation have been reported for the synthesis of MgAl2O4 spinel.37–42
The solid-state method is a traditional method for preparing mixed metal oxides, in which the synthesis temperature is generally at 1500 °C and above,43 with high energy consumption. Moreover, high-temperature treatment could destroy the porosity and surface area, and deteriorate the catalytic performance.
The combustion synthesis method was proposed in the 1990s. Ibrahim et al.44 reported various ceramic oxide powders synthesized by this method using urea-formaldehyde as fuel. Firstly, formaldehyde, urea, and the corresponding metal nitrates were heated to form the urea-formaldehyde metal complex gel. The ceramic phase was formed by drying gel and autoignition was initiated by burning fuel. Bhaduri and co-workers45,46 employed the combustion synthesis method to prepare Al2O3, ZrO2 and spinel. As usual, metal nitrates and urea were used as oxidizers and fuel, respectively.39 Prabhakaran42 studied the synthesis of nanocrystalline MgAl2O4 spinel powder by using the urea-formaldehyde polymer gel combustion route. Nowadays, citric acid has taken the place of urea as fuel in the combustion synthesis route. The addition of citric acid to nitrate solution is beneficial for forming a citric–metal-nitrate complex that subsequently facilitates the crystallization of spinel at a relatively lower temperature. Behera47 and Saberi48 reported the synthesis of MgAl2O4 by citrate–metal-nitrate self-sustained combustion. The sol–gel method is based on the gelation of raw material with the addition of gelation agent or else, using expensive organometallics as the precursors.37 Walker et al.38 used methacrylic acid (C4H6O3), acrylic acid (C3H4O2), magnesium hydroxide (Mg(OH)2), basic alumina acetate (Al(OH)(C2H3O2)2) and ammonium hydroxide as precursors for preparing a homogeneous gel of magnesium methacrylate (Mg(C4H5O2)2·H2O), aluminum acrylate (Al2(OH)3(C3H3O2)3·H2O) and ammonium acrylate (NH4(C3H3O2)·H2O). MgAl2O4 was obtained by pyrolysis of this gel and it was found that the spinel crystallization occurred at 600 °C, while the purely-ordered spinel could be obtained at 1030 °C with the subsequent calcination. In the co-precipitation method, metal-salt precursors were firstly dissolved in water, followed by the addition of the precipitant to produce metal hydroxides. Generally, the precipitants used for the co-precipitation processes are alkali, carbonate, and sulfate, etc. This method is widely used in powder preparation for various oxides or composite oxides. Ewais and co-workers49 prepared the Mg–Al spinel by the co-precipitation method using Mg(NO3)2·6H2O and Al (NO3)3·9H2O as precursors and ammonia as the precipitant and found that the spinel could be obtained after roasting at above 1300 °C. Abdi and co-workers50 used MgCl2 and AlCl3 as precursors with NaOH as the precipitant to produce the mixture by ball milling; after drying, the spinel powder was obtained by roasting at 600–1200 °C.
The hydrothermal method gives high purity spinel with a homogeneous porosity and a large surface area.51 The precursors could be both metal salts and hydrated metal hydroxides. Zhang et al.51 prepared nanocrystalline MgAl2O4 with a mesoporous structure using magnesium nitrate and aluminum nitrate as the precursors, with cetyltrimethylammonium bromide (CTAB) by hydrothermal synthesis at 180 °C, which is quite complicated, inefficient and of high cost. The spray drying method has been developed in recent years and is generally used for preparing soft and agglomerate-free granules of nanopowder. Kim and co-workers41 prepared spherical granules of MgAl2O4 spinel by combining the microfluidization and spray freeze-drying process. Recently, hot isostatic pressing, spark plasma sintering, hot pressing, and vacuum sintering techniques have been used to prepare transparent MgAl2O4 for optic applications.
In this work, to find a facile route for the catalyst support for FTO reactions, combustion, complexing sol–gel and co-precipitation methods were employed to synthesize MgAl2O4 for a comparative investigation, and all the as-synthesized samples were characterized in detail. Moreover, K, Mn, and Fe were loaded on the as-synthesized MgAl2O4 to prepare catalysts for FTO reactions and it was found that the properties of the MgAl2O4 spinel have a great impact on the catalytic performance.
2. Experimental
2.1 Support preparation
The solution combustion, complexing sol–gel, and co-precipitation methods were selected to prepare the MgAl2O4 supports. The series of supports were designated as MAX (where “X” represents the method employed). The details of the reagents for the preparation of the support and catalysts are shown in Table S1.†![[thin space (1/6-em)]](https://www.rsc.org/images/entities/char_2009.gif) :
:![[thin space (1/6-em)]](https://www.rsc.org/images/entities/char_2009.gif) 1 mole ratio to metal ions was added to deionized water, both of which were then kept at 80 ± 1 °C under vigorously stirring until butter was formed. The butter was aged in a culture vessel for 2 h at room temperature and dried at 120 °C for 24 h in a drying oven, and at the same time, it gradually foamed into a sponge in the oven. After drying, the resulting sponge was smashed and then calcined at 900 °C in a muffle furnace for 10 h in air flow and cooled to room temperature; thereafter, it was pulverized into powder of <180 μm for active metal loading and characterization. This first sample was designated as MAC.
1 mole ratio to metal ions was added to deionized water, both of which were then kept at 80 ± 1 °C under vigorously stirring until butter was formed. The butter was aged in a culture vessel for 2 h at room temperature and dried at 120 °C for 24 h in a drying oven, and at the same time, it gradually foamed into a sponge in the oven. After drying, the resulting sponge was smashed and then calcined at 900 °C in a muffle furnace for 10 h in air flow and cooled to room temperature; thereafter, it was pulverized into powder of <180 μm for active metal loading and characterization. This first sample was designated as MAC.![[thin space (1/6-em)]](https://www.rsc.org/images/entities/char_2009.gif) :
:![[thin space (1/6-em)]](https://www.rsc.org/images/entities/char_2009.gif) 1 mole ratio to metal ions, was dissolved in deionized water with a small amount of ammonia to promote the dissolution of EDTA. It was then kept at 80 ± 1 °C under vigorous stirring until it became sticky. The mixture was aged in a culture vessel for 2 h at room temperature and dried at 120 °C for 24 h, followed by calcination at 900 °C in a muffle furnace for 10 h in flowing air and then cooled to room temperature. It was pulverized into powder of <180 μm for active metal loading and characterization, and by this method, the spinel sample was obtained and designated as MAG.
1 mole ratio to metal ions, was dissolved in deionized water with a small amount of ammonia to promote the dissolution of EDTA. It was then kept at 80 ± 1 °C under vigorous stirring until it became sticky. The mixture was aged in a culture vessel for 2 h at room temperature and dried at 120 °C for 24 h, followed by calcination at 900 °C in a muffle furnace for 10 h in flowing air and then cooled to room temperature. It was pulverized into powder of <180 μm for active metal loading and characterization, and by this method, the spinel sample was obtained and designated as MAG.2.2 Catalyst preparation
K, Mn and Fe were loaded by the incipient wetness impregnation of complexed metal nitrates during the preparation of catalysts. K(NO3)3, Mn(NO3)2 and Fe(NO3)3 were dissolved in deionized water with a certain amount of citric acid (mole ratio of metal to citric acid is 1![[thin space (1/6-em)]](https://www.rsc.org/images/entities/char_2009.gif) :
:![[thin space (1/6-em)]](https://www.rsc.org/images/entities/char_2009.gif) 1) to prepare the precursor solution. The amounts of precursor salts are shown in Table S2.† The support was immersed in precursor solution, followed by drying at 120 °C. The above step was repeated until the precursors were fully loaded on the carrier. They were dried at 120 °C overnight and calcinated at 350 °C for 5 h. The catalysts were labelled as CMAC, CMAG, and CMAP.
1) to prepare the precursor solution. The amounts of precursor salts are shown in Table S2.† The support was immersed in precursor solution, followed by drying at 120 °C. The above step was repeated until the precursors were fully loaded on the carrier. They were dried at 120 °C overnight and calcinated at 350 °C for 5 h. The catalysts were labelled as CMAC, CMAG, and CMAP.
2.3 Characterization
The as-synthesized supports and catalysts were characterized by thermal gravimetric analysis and differential scanning calorimetry (TGA-DSC) based on a NETZSCH STA-449-F3 thermal analyzer. Samples were heated from room temperature to 900 °C at 20 °C min−1 under a dry air flow of 50 mL min−1 to study the thermal decomposition behavior. The crystallinity was characterized by an X-ray diffraction (XRD, Rigaku D/max-2200/PC) instrument equipped with a CuKα radiation source (λ = 1.54 Å). The instrument was operated at 40 kV and 30 mA and the diffraction pattern was recorded in the 2 theta range from 10° to 80°, with a scanning speed of 5° min−1. The surface morphology and structure of the supports were measured by scanning electron microscopy (SEM, Sirion 200) and transmission electron microscopy (TEM, JEOL JEM2011), respectively. BET surface area, pore volumes, and average pore diameters were obtained by N2 physisorption at −196 °C, conducted on a Quantachrome ASIQA3200-3 automation system. Samples were heated at 10 °C min−1 to 350 °C and held for 12 h under a vacuum of 10−6 torr before the measurements. The specific surface area and the pore size distribution were calculated according to the Brunauer–Emmett–Teller (BET) and the Barret–Joyner–Halenda (BJH) methods, respectively. Elemental chemical analysis of samples was conducted using an inductively coupled plasma-optical emission spectroscopy instrument (ICP-AES, Thermo ICAP7600) equipped with a Spectro Ciros CCD spectrometer. The basicity of the supports and catalysts was determined by CO2 temperature-programmed desorption (CO2-TPD), where the samples were pretreated at 400 °C in a flow of Ar, followed by exposure to CO2 for 120 min and then flushed with Ar flow of 40 mL min−1. Finally, with the flow of Ar, the sample was heated from room temperature to 800 °C at 10 °C min−1, and the data was collected. The reduction behavior of the active phase was determined by H2 temperature-programmed reduction (TPR, Quantachrome TPRWin v3.52). The catalysts were kept at 250 °C for 2 h in a pure He flow of 40 mL min−1, then cooled back to room temperature and reheated to 800 °C in 5% H2/He of 30 mL min−1 at 2 °C min−1, during which the consumption of H2 was detected by a thermal conductivity detector (TCD). The chemical status of the active phase was determined by X-ray Photoelectron Spectroscopy (XPS, Thermo Fisher Scientific, equipped with a monochromatic Al Kα X-ray source, excitation energy = 1468.6 eV). It was operated under an ultrahigh vacuum of 10−6 torr, before which the samples were successively reduced in 5%H2/N2 flow of 160 mL min−1 at 360 °C for 12 h, carbonized in 40% H2/40% CO/20% N2 flow of 100 mL min−1 for 12 h, and cooled to room temperature in a N2 atmosphere. The binding energies were calibrated via adventitious carbon deposition C (1s) at E = 284.8 eV. MicroRaman analysis was performed on confocal Raman microscope systems (DXR, Thermo Fischer Scientific), equipped with a high-grade Leica microscope and a 532 nm laser source. Position correction was set by monocrystalline silicon at 520.7 cm−1. The samples were exposed for 40 seconds and scanned from 1000 to 1800 cm−1 and the scattered light was collected by a deep-depletion CCD array detector that was thermoelectrically cooled.All the samples used for the post-use test were obtained after 36 h of stable operation under corresponding conditions (almost 50 h on stream in total), after which the samples were swept and cooled to room in a N2 atmosphere.
2.4 Catalytic performance test
The evaluation of FTO catalysts was performed in a fixed bed reactor made of a quartz tube with an internal diameter of 6 mm and a total length of 760 mm. Catalyst powder of 0.5 g (150–180 μm) was diluted by 1.5 g quartz sand. The feed gas consisted of 40% CO, 40% H2 and 20% N2 (mol%). The test was conducted at 1.5 MPa, 345 °C and 12![[thin space (1/6-em)]](https://www.rsc.org/images/entities/char_2009.gif) 000 mL g−1 h−1. The gas hourly space velocity was calculated based on the total flow rate of the feed gas. The catalyst was firstly reduced in a flow of 5% H2/N2 at 360 °C for 12 h under atmospheric pressure, then cooled to 345 °C, after which the feed gas was switched in and the pressure was increased to 1.5 MPa. The post-reactor lines were heated to 170 °C to avoid liquefaction and condensation of the products.
000 mL g−1 h−1. The gas hourly space velocity was calculated based on the total flow rate of the feed gas. The catalyst was firstly reduced in a flow of 5% H2/N2 at 360 °C for 12 h under atmospheric pressure, then cooled to 345 °C, after which the feed gas was switched in and the pressure was increased to 1.5 MPa. The post-reactor lines were heated to 170 °C to avoid liquefaction and condensation of the products.
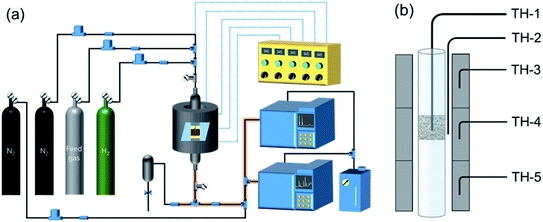
As shown in Fig. 1, two online gas chromatographs were equipped with an HP-PLOT/Q and a PH-PONA chromatography column to analyze C1–C3 and C1–C10 by FID detectors, respectively. The catalytic performance of CMAP at 345 °C, 1.5 MPa and 12![[thin space (1/6-em)]](https://www.rsc.org/images/entities/char_2009.gif) 000 mL g−1 h−1 was taken as an example to show the analysis method in Fig. S4 and S5.† N2, CO, CH4 and CO2 were analyzed by a carbon molecular sieve packed column combined with a TCD detector (shown in Fig. S4†). As shown in Fig. S5,† the hydrocarbon products were separated by a PONA capillary column and detected by an FID-1 detector in GC-1. The peak position corresponding to the individual hydrocarbon has been marked in Fig. S5.† The distribution of hydrocarbon was calculated by the method of area normalization. Because the PONA column could not separate C2 and C3, they were separated by a Plot-Q capillary column and detected by FID-2 in GC-2. The ratio of olefins to paraffin was calculated based on the mole content of individual hydrocarbons, in which C4 and C4+ were detected by FID-1, and both C2 and C3 were detected by FID-2. The product distribution was calculated up to C10 based on carbon atoms excluding CO2. The product obtained for analysis was collected 15 h after the catalyst on stream. Eqn (1)–(3) present the calculation methods of the conversion of CO, the selectivity of CO2, and the product distribution of hydrocarbons, respectively.
000 mL g−1 h−1 was taken as an example to show the analysis method in Fig. S4 and S5.† N2, CO, CH4 and CO2 were analyzed by a carbon molecular sieve packed column combined with a TCD detector (shown in Fig. S4†). As shown in Fig. S5,† the hydrocarbon products were separated by a PONA capillary column and detected by an FID-1 detector in GC-1. The peak position corresponding to the individual hydrocarbon has been marked in Fig. S5.† The distribution of hydrocarbon was calculated by the method of area normalization. Because the PONA column could not separate C2 and C3, they were separated by a Plot-Q capillary column and detected by FID-2 in GC-2. The ratio of olefins to paraffin was calculated based on the mole content of individual hydrocarbons, in which C4 and C4+ were detected by FID-1, and both C2 and C3 were detected by FID-2. The product distribution was calculated up to C10 based on carbon atoms excluding CO2. The product obtained for analysis was collected 15 h after the catalyst on stream. Eqn (1)–(3) present the calculation methods of the conversion of CO, the selectivity of CO2, and the product distribution of hydrocarbons, respectively.
 | (1) |
 | (2) |
 | (3) |
3. Results and discussion
3.1 Characteristics of the as-synthesized supports
 | (4) |
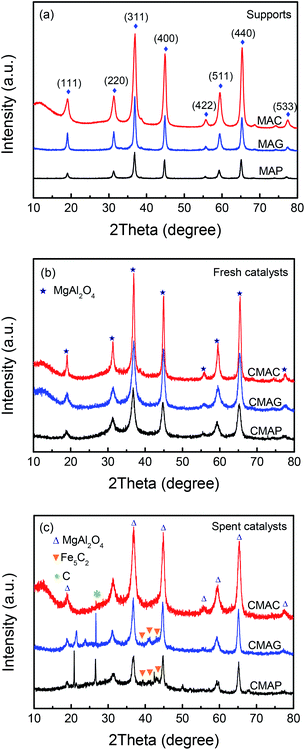
Reflections were assigned based on MgAl2O4 JCPDS #77-1203, Fe5C2 JCPDS #36-1248 and C JCPDS #26-1077.29,36 All the samples exhibited clear XRD patterns matching well with the standard MgAl2O4 spinel phase. The patterns of the samples synthesized by solution combustion and sol–gel methods showed a dramatic increase in intensity, indicating an increase in the crystal size. The citric acid (CA) served as both the combustion fuel and the bridge to link the magnesium ion and aluminum ion without a template agent. It was beneficial to form a citric–metal-nitrate complex that subsequently facilitated the crystallization of the spinel at a relatively lower temperature by the citric combustion method. The average crystallite size was 16.5, 14.0, and 10.6 nm (see facets (311), (400) and (440)) for MAC, MAG and MAP, respectively. It can be seen in Fig. 3b and c that the original MgAl2O4 cubic spinel phase was well retained after loading the active phase (fresh) and after the reaction (spent), indicating that the as-synthesized supports have good stability and corrosion resistance.
| Support | Parent catalyst | Activated catalyst | Spent catalyst | |||||||||
|---|---|---|---|---|---|---|---|---|---|---|---|---|
| SSA (m2 g−1) | PV (cm3 g−1) | PS (nm) | SSA (m2 g−1) | PV (cm3 g−1) | PS (nm) | SSA (m2 g−1) | PV (cm3 g−1) | APS (nm) | SSA (m2 g−1) | PV (cm3 g−1) | PS (nm) | |
| a SSA: specific surface area; PV: pore volume; PS: pore size. | ||||||||||||
| MAC | 31.4 | 0.08 | 10.2 | 33.6 | 0.09 | 9.9 | 35.8 | 0.08 | 8.0 | 33.0 | 0.08 | 6.0 |
| MAG | 38.0 | 0.11 | 11.8 | 34.6 | 0.10 | 10.2 | 33.7 | 0.08 | 9.4 | 35.5 | 0.08 | 8.8 |
| MAP | 107.6 | 0.29 | 11.9 | 112.2 | 0.29 | 9.4 | 91.9 | 0.25 | 9.4 | 83.6 | 0.25 | 9.1 |
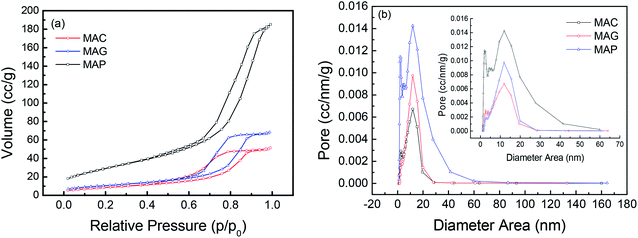
The surface area and pore volume of the fresh catalyst were almost the same as that of the corresponding support, indicating that the textural properties of spinel were retained during the loading and calcination processes. The catalyst, CMAP has a larger surface area than the other two, which facilitates the homogeneous distribution of active components, which favors higher activity and narrower product distribution. Moreover, the pore size decreased significantly after the reactions were performed, especially for CMAG, indicating a blockage of the pores, which may be caused by the formation of heavy hydrocarbons and coking on CMAG.
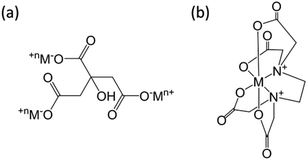
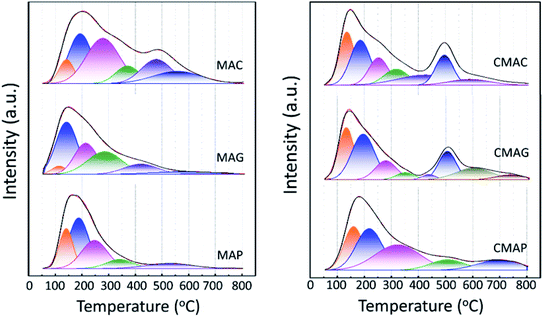
Structure models of the as-synthesized spinel are shown in Fig. 8. It can be seen that CA forms chelates with metal ions, making magnesium and aluminum fully dissolved and randomly distributed. After drying, foaming and calcination, homogeneous spinel structures were formed in the bulk phase, while alumina and magnesium oxides were uniformly distributed on the surface of the spinel due to the random binding of metals to the coordination points of CA. Moreover, due to the presence of surface magnesium oxide, the MAC support had the strongest basicity. Although the process of EDTA complexation with metal ions is essentially the same as CA, EDTA has six-coordinated atoms so that the metal ions could be chelated independently. During crystallization, Mg ions and Al ions are immobilized in the spinel body structure, and limited individual magnesium oxide is exposed on its surface, resulting in a significant weakening of its basicity. On the contrary, during the preparation of the MAP support, since the solubility product of Al(OH)3 is much smaller than that of Mg(OH)2, the precipitation of Al(OH)3 was completed first. For Mg(OH)2 to be completely precipitated, an adequate amount of base (NH3) has to be added; however, under alkaline conditions, Al(OH)3 is partially dissolved back into the solution contributing to the formation of the soluble meta-aluminate. The Mg(OH)2 and Al(OH)3 were uniformly mixed by heating, stirring and aging, while the aluminates were attached to the surface. The meta-aluminate precipitated again after drying to form Al(OH)3 and was then bound to the surface of Mg(OH)2. Thus, after calcination, a layer of magnesium oxide was first formed in the outer layer of the bulk spinel, and then a layer of spinel was formed out of magnesium oxide. Most of the outermost layer was covered by alumina oxide, and some magnesium oxide was exposed on the surface, leading to much weaker basicity as compared to the other two supports. Moreover, after the active component was loaded, the desorption peaks shifted to a higher temperature, indicating that the basic sites were strengthened at both the weak and strong basic sites simultaneously, which was mainly due to the addition of the alkaline promoter, K2O. Interestingly, this phenomenon of basicity enhancement is particularly evident in samples prepared by CA-combustion and EDTA-sol–gel methods.
The results are consistent with the activity performance of the corresponding catalyst, in which CMAP shows a higher selectivity to olefins due to the weaker basic sites as shown in Fig. 7 (right). The average olefin to paraffin ratios are 2.4, 2.5 and 4.3 for CMAC, CMAG and CMAP, respectively. Therefore, for the spinel-supported FTO catalysts, the number of weak basic sites determines the secondary hydrogenation of olefins. Xu31 reported that Fe supported on basic carriers promote the adsorption of CO, therefore giving high selectivity of olefins. Accordingly, the role of the alkaline promoter is mainly to suppress secondary hydrogenation and therefore improve olefin selectivity. The results showed similar behavior in chain growth probability. As is well known, the FTO catalyst requires a certain degree of alkalinity to facilitate the adsorption of activated carbon species to promote carbon chain growth. However, excessive alkalinity leads to a lower dissociation rate of adsorbed carbon monoxide, which not only increases the carbon chain, but also increases the hydrogenation of olefins, leading to a high selectivity toward paraffins. As such, the product distribution on catalysts CMAC and CMAG was broader than that on CMAP.
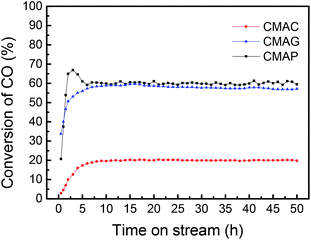
![[thin space (1/6-em)]](https://www.rsc.org/images/entities/char_2009.gif) 000 mL g−1 h−1. As shown in Fig. 10, the CO conversion of CMAP firstly increased from 20% to 65% within the initial 3 h, but decreased to 60% in the following 3 h. In the first 3 h, the increase in the CO conversion was related to the transformation from Fe3O4 to the active carbide iron phase. Similarly, Wang and co-workers20 reported that the CO conversion initially increased to 45% and then decreased a little. In the cases of CMAC and CMAG, CO conversion increased gradually to 20% and 58%, respectively in the initial 10 hours, and remained constant with the further increase in the time on stream. Both deposited carbon and carbonyl species on the catalyst surface were evidenced by XPS. CMAP has a short induction period of reaction and can maintain good stability. It has been widely accepted that χ-Fe5C2 is considered as the active phase for the FT reaction.61 The induction period was shortened by promoting the formation of χ-Fe5C2, which indicates that CO is easier to dissociate on CMAP and CMAG catalysts. It promotes the reduction of catalyst and facilitates the formation of χ-Fe5C2, which is consistent with the XPS results.
000 mL g−1 h−1. As shown in Fig. 10, the CO conversion of CMAP firstly increased from 20% to 65% within the initial 3 h, but decreased to 60% in the following 3 h. In the first 3 h, the increase in the CO conversion was related to the transformation from Fe3O4 to the active carbide iron phase. Similarly, Wang and co-workers20 reported that the CO conversion initially increased to 45% and then decreased a little. In the cases of CMAC and CMAG, CO conversion increased gradually to 20% and 58%, respectively in the initial 10 hours, and remained constant with the further increase in the time on stream. Both deposited carbon and carbonyl species on the catalyst surface were evidenced by XPS. CMAP has a short induction period of reaction and can maintain good stability. It has been widely accepted that χ-Fe5C2 is considered as the active phase for the FT reaction.61 The induction period was shortened by promoting the formation of χ-Fe5C2, which indicates that CO is easier to dissociate on CMAP and CMAG catalysts. It promotes the reduction of catalyst and facilitates the formation of χ-Fe5C2, which is consistent with the XPS results.
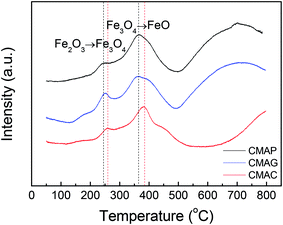
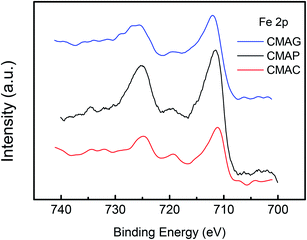
XPS was employed to determine the surface iron species on the spent catalysts. The XPS spectra of Fe 2p for the pretreated catalysts are shown in Fig. 11 and S2.† Peaks at 710.7 eV and 724.6 eV were detected on CMAP as well as MAG for Fe 2p3/2 and 2p1/2, which were identified as Fe3O4 species.62 Moreover, the peak at ∼720 eV can be assigned to metallic, or carbide iron.19 It should be noted that the reduction of magnetite to metallic iron takes place at higher temperatures than the reduction and activation conditions. Pure free Fe and FeO species are unable to exist independently on the activated catalysts, which is also consistent with the TPR results. Therefore, the peak at 719.9 eV is expected to be Fe2C5, revealing the coexistence of Fe2C5 and Fe3O4 on the surface of CMAP. The weak peak of the active iron phase in the XRD pattern of the spent CMAP suggests a good dispersion of Fe2C5. Nevertheless, CMAC exhibited peaks at 711.1 eV and 724.8 eV, corresponding to the Fe 2p3/2 and 2p1/2 levels of Fe3+, respectively, coupled with the satellite peak at 719.0 eV, which clearly indicates the existence of Fe2O3.63,64 Moreover, CMAC showed a much lower activity for FTO reaction, indicating that the Fe3O4 species is more likely to shift into the active iron phase than Fe2O3.65 Considering the reduction behavior, it could be reasonably concluded that during the carburization process, the hematite phase of the fresh catalyst was primarily reduced to Fe3O4 and then carburized into carbide iron in the presence of CO. As a result, Fe3O4 could be considered as the precursor to active iron carbide, consistent with the higher activity of CMAP as compared to the other two catalysts. It could be seen that compared with CMAC, the peaks of Fe 2p on CMAP and CMAG shifted toward lower binding energies, indicating a greater electron density. As is well known, a greater electron density leads to a lower binding energy.66,67 This illustrates the fact that the electron donation effect is enhanced by MAG and MAP, bringing out an electron-rich state of Fe species on catalysts, which facilitates the deposition of CO, then leads to a higher CO conversion on CMAG and CMAP.
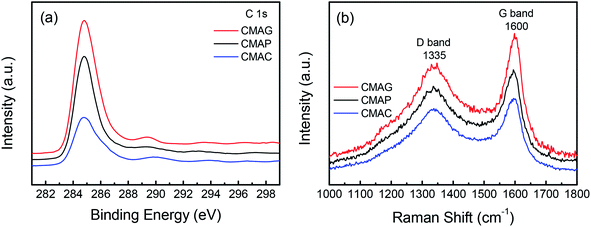
As is well known, the deactivation of iron catalysts in the Fischer–Tropsch (FT) reaction is mainly caused by carbon deposition. Herein, the carbon deposition properties of the spent catalysts were analyzed based on the C 1s XPS and Raman spectra. As shown in Fig. 12a, all the spent catalysts exhibited an XPS peak at the binding energy of 284.8 eV, which indicates the amorphous carbon on the catalyst surface. The peaks at 288.9 and 289.5 eV were attributed to carbonyl species and surface CO2 species, respectively.68 The strongest peak at 284.8 eV of CMAG indicated a great deal of amorphous carbon on CMAG. It was also noted that the peaks at 288.9 eV of CMAC and CMAG were much higher than CMAP, indicating the heavier hydrocarbons and carbonyl compounds generated on CMAC and CMAG.
Fig. 12b and S3† present the Raman spectra of the spent catalysts, in which two bands are shown at 1335 cm−1 and 1600 cm−1, respectively. The Raman spectra of the support and the fresh catalysts are also provided in Fig. S3† but no characteristic peaks appeared at 1335 or 1600 cm−1. These peaks could be divided into D4 (1200 cm−1), D1 (1350 cm−1), D3 (1500 cm−1), G (1600 cm−1) and D2 (1620 cm−1) in the order of the band shift. It is generally accepted that the Raman peak of the D-band at 1335 cm−1 is assigned to the amorphous carbonaceous species, and the G band at 1600 cm−1 is assigned to the ordered graphitic carbon layers.69,70 These results indicate the coexistence of amorphous and graphitic carbon species on the surface of the catalyst, which is consistent with the XPS results.
3.2 Comparison of catalytic performance
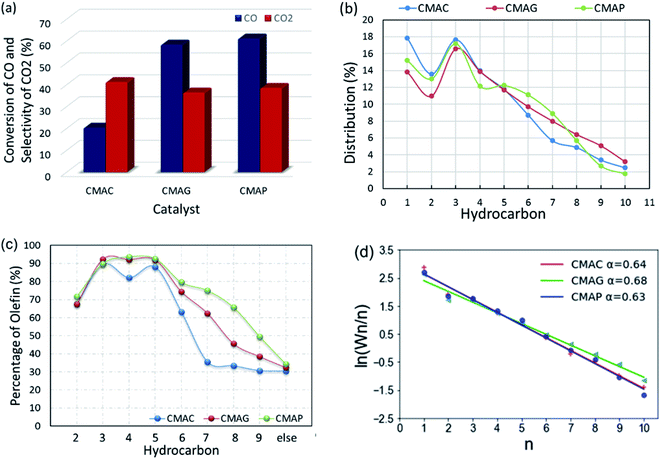
All the as-synthesized catalysts were tested for the FTO reaction at 1.5 MPa, 345 °C and 12![[thin space (1/6-em)]](https://www.rsc.org/images/entities/char_2009.gif) 000 mL g−1 h−1 and the results are shown in Fig. 13. Catalysts supported on MAP and MAG (CMAP and CMAG) showed satisfactory CO conversion of 61% and 58%, and reasonable CO2 selectivity of about 38% and 36%, respectively, in contrast to the unfavorable CO conversion of 19% and CO2 selectivity of 41% on MAC (CMAC). In recent research, Wu and Ying suggested that Fe3O4 played an important role in suppressing the formation of CO2.71 Fe3O4 is widely known as the active phase of the WGS reaction; therefore, the highest CO2 selectivity of CMAC is consistent with the XPS results. As for the CH4 distribution, CMAC is ranked as first with 17.8%, followed by CMAP with 15.2%, and followed by CMAG with 13.8%. With reference to the work by Wang and co-workers,20 a CNT-supported iron catalyst showed a CO conversion of 23% with a CO2 selectivity of 48.6%, and CH4 selectivity of 24% under similar reaction conditions.
000 mL g−1 h−1 and the results are shown in Fig. 13. Catalysts supported on MAP and MAG (CMAP and CMAG) showed satisfactory CO conversion of 61% and 58%, and reasonable CO2 selectivity of about 38% and 36%, respectively, in contrast to the unfavorable CO conversion of 19% and CO2 selectivity of 41% on MAC (CMAC). In recent research, Wu and Ying suggested that Fe3O4 played an important role in suppressing the formation of CO2.71 Fe3O4 is widely known as the active phase of the WGS reaction; therefore, the highest CO2 selectivity of CMAC is consistent with the XPS results. As for the CH4 distribution, CMAC is ranked as first with 17.8%, followed by CMAP with 15.2%, and followed by CMAG with 13.8%. With reference to the work by Wang and co-workers,20 a CNT-supported iron catalyst showed a CO conversion of 23% with a CO2 selectivity of 48.6%, and CH4 selectivity of 24% under similar reaction conditions.
It should be noted that CMAG is more conducive to the growth of carbon chains, showing a higher selectivity toward C8+ products. Most of the “other parts” in the product distribution are alcohols and C10+ hydrocarbons. Nevertheless, the ratios of olefin to paraffin (O/P) for individual compounds obtained on MAC were lowest among these three supports. The highest olefin percentage for the individual C2, C3, C4 and C5 were 71.4%, 89.8%, 93.6% and 92.6%, respectively, and were achieved based on the MAP support.
It is widely accepted that the Fischer–Tropsch reaction proceeds through the insertion of the C1 intermediate, CH2. With the chain growth probability α, the product distribution could be predicted by the Anderson–Schulz–Flory (ASF) model.72 The weight fraction of each product (Wn) with carbon number n and the chain growth probability α can be calculated by eqn (6):
| Wn = n(1 − α)2αn−1 | (6) |
In this work, the value of the chain growth probability α was calculated by the slope of the log(Wn/n) vs. n plot and fitted by the least-squares method. As shown in Fig. 13d, the ASF plot exhibited almost a straight line and the product distribution matches well with the ASF model in the region from C2 to C10 with α estimated as 0.64, 0.7 and 0.63 for CMAC, CMAG and CMAP, respectively. CMAP and CMAC showed a lower and nearly same chain growth probability α, indicating a much narrower product distribution at light hydrocarbons, but a higher selectivity for methane. Although CMAC shifted selectivity to lower hydrocarbons, it showed significantly lower activity as compared with CMAP and CMAG. CMAG showed lower CH4 selectivity, as well as higher selectivity to longer hydrocarbons, especially for C8 and above. CMAP showed the highest activity and selectivity toward olefins. As a result, MAP is recommended as the optimal support for further study.
Based on the ASF model, the increase in the selectivity of lower hydrocarbon products will inevitably lead to an increase in methane. Ying and Ma73 studied the Li-promoted iron-based catalyst and the relatively high loading of Li could significantly improve the selectivity of light olefins. It showed ∼15% of CO conversion, more than 45% of C![[double bond, length as m-dash]](https://www.rsc.org/images/entities/char_e001.gif) 2–C
2–C![[double bond, length as m-dash]](https://www.rsc.org/images/entities/char_e001.gif) 4, more than 20% of CH4 and ∼40% of CO2 emission on FeMnLi catalysts. Park81 studied the linear alpha olefins production behavior on K–Fe5C2/Al2O3, which achieved almost 90% CO conversion, more than 40% CO2 selectivity, ∼8% of CH4, ∼15% of C2–C4 and ∼35% of C5+ in total product. As can be seen, the distribution of CH4 and C2 deviated from the prediction by the ASF model, which means that the pathways for the two species are alternatives to the insertion mechanism; i.e., hydrocarbon formation by the step-wise insertion of C1 species.74 This deviation phenomenon was also reported by De Jong and Sun, and a 3-α-parameter-modified ASF model was proposed.75,76
4, more than 20% of CH4 and ∼40% of CO2 emission on FeMnLi catalysts. Park81 studied the linear alpha olefins production behavior on K–Fe5C2/Al2O3, which achieved almost 90% CO conversion, more than 40% CO2 selectivity, ∼8% of CH4, ∼15% of C2–C4 and ∼35% of C5+ in total product. As can be seen, the distribution of CH4 and C2 deviated from the prediction by the ASF model, which means that the pathways for the two species are alternatives to the insertion mechanism; i.e., hydrocarbon formation by the step-wise insertion of C1 species.74 This deviation phenomenon was also reported by De Jong and Sun, and a 3-α-parameter-modified ASF model was proposed.75,76
4 Further activity tests on the MAP-based catalyst
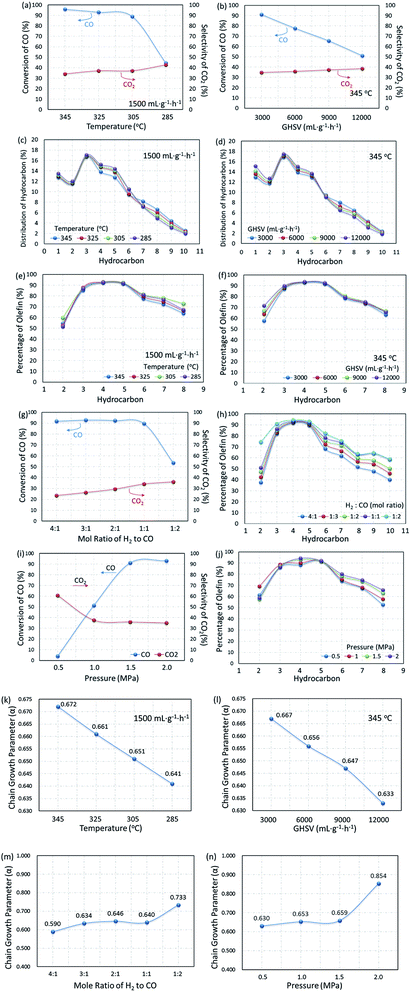
Based on the MAP supported catalyst, the influence of reaction conditions on catalytic performance was also explored. In Fig. 14, the dependence of product distribution on the reaction temperature and gas hourly space velocity is shown with the detailed ASF plots.As the temperature decreased from 345 to 285 °C, the CO conversion decreased from 95.8% to 44.5%, but CO2 selectivity increased a little. The self-regulation of the hydrogen content in reaction feeds can be realized by the water gas shift (WGS) reaction at the expense of an increase in CO2 selectivity. It can also be proved by the decrease in the ratio of olefin to paraffin as shown in Fig. 14e, since the lower CO content in the gas feed leads to higher selectivity for paraffins. Furthermore, the WGS reaction is a reversible exothermic reaction (see eqn (7)), and the lower reaction temperature is favorable for the forward direction. The lower temperature is beneficial for the WGS reaction, leading to an increase in CO2 selectivity.77
| WGS reaction: CO + H2O ⇌ CO2 + H2 | (7) |
Similar phenomena were observed with the variation in the gas hourly space velocity (GHSV). Under the reaction conditions, the selectivity of CO2 reached 35% and above. Furthermore, increasing GHSV led to a significant decrease in the CO conversion but CO2 selectivity slightly increased, indicating a satisfactory WGS reaction. A higher GHSV promotes the selectivity of olefins, resulting in a higher ratio of olefin to paraffin, and indicating that the formation of paraffin through the pathway of olefin hydrogenation could be recognized as the cascade of reaction (8) and (9).
| 2nCO + 2nH2 = CnH2n + nCO2 | (8) |
| CnH2n + H2 = CnH2n+2 | (9) |
The composition of syngas for FTO has a significant effect on the distribution of products. As shown in Fig. 14g and h, with the content of CO in the reaction gas increasing from 20% to 50% (H2/CO mole ratio from 4![[thin space (1/6-em)]](https://www.rsc.org/images/entities/char_2009.gif) :
:![[thin space (1/6-em)]](https://www.rsc.org/images/entities/char_2009.gif) 1 to 1
1 to 1![[thin space (1/6-em)]](https://www.rsc.org/images/entities/char_2009.gif) :
:![[thin space (1/6-em)]](https://www.rsc.org/images/entities/char_2009.gif) 1), the CO conversion changed a little, but the selectivity of CO2 decreased significantly. Due to the decrease in the hydrogen content, the secondary hydrogenation reaction is inhibited, the olefins in the products increase with the increase in the CO content and promote the growth of the carbon chain. Since the FTO is a carbon chain growth reaction, high pressure is conducive to the reaction. Fig. 14i and j show that the reaction activity increased significantly with the reaction pressure increase from 0.5 to 1.5 MPa, and the selectivity of CO2 decreased. In contrast, the olefin content increased gradually, indicating that the increase in the reaction pressure can inhibit the WGS reaction and promote the carbon chain growth at the same time, as shown in Fig. 14n. Based on the results mentioned above, the reaction conditions were optimized with the CO/H2 mole ratio of 1
1), the CO conversion changed a little, but the selectivity of CO2 decreased significantly. Due to the decrease in the hydrogen content, the secondary hydrogenation reaction is inhibited, the olefins in the products increase with the increase in the CO content and promote the growth of the carbon chain. Since the FTO is a carbon chain growth reaction, high pressure is conducive to the reaction. Fig. 14i and j show that the reaction activity increased significantly with the reaction pressure increase from 0.5 to 1.5 MPa, and the selectivity of CO2 decreased. In contrast, the olefin content increased gradually, indicating that the increase in the reaction pressure can inhibit the WGS reaction and promote the carbon chain growth at the same time, as shown in Fig. 14n. Based on the results mentioned above, the reaction conditions were optimized with the CO/H2 mole ratio of 1![[thin space (1/6-em)]](https://www.rsc.org/images/entities/char_2009.gif) :
:![[thin space (1/6-em)]](https://www.rsc.org/images/entities/char_2009.gif) 1 and the total pressure of 1.5 MPa.
1 and the total pressure of 1.5 MPa.
To further substantiate the effect of operation conditions, values of chain growth probability α were also calculated as shown in Fig. 14k–n. With operation temperature decreasing from 345 °C to 285 °C, the value of α decreased from 0.657 to 0.651, resulting in a narrower distribution of products at lower temperatures. CO conversion decreased from 95.8% to 61.1% when the GHSV varied from 1500 to 12![[thin space (1/6-em)]](https://www.rsc.org/images/entities/char_2009.gif) 000 mL g−1 h−1. Moreover, along with the increase in the GHSV, the value of α decreased significantly, indicating a shift in the products toward lower hydrocarbons. At the same time, the CO2 selectivity increased from 34.7% to 38.5%, indicating that the effect of temperature is much more significant than that of GHSV on the WGS reaction. Moreover, increasing both reaction pressure and CO content could effectively promote the increase in the chain growth parameter α. As shown in Fig. 14m and n, when the CO content increased from 20% to 80% (H2/CO mole ratio 4
000 mL g−1 h−1. Moreover, along with the increase in the GHSV, the value of α decreased significantly, indicating a shift in the products toward lower hydrocarbons. At the same time, the CO2 selectivity increased from 34.7% to 38.5%, indicating that the effect of temperature is much more significant than that of GHSV on the WGS reaction. Moreover, increasing both reaction pressure and CO content could effectively promote the increase in the chain growth parameter α. As shown in Fig. 14m and n, when the CO content increased from 20% to 80% (H2/CO mole ratio 4![[thin space (1/6-em)]](https://www.rsc.org/images/entities/char_2009.gif) :
:![[thin space (1/6-em)]](https://www.rsc.org/images/entities/char_2009.gif) 1 to 2
1 to 2![[thin space (1/6-em)]](https://www.rsc.org/images/entities/char_2009.gif) :
:![[thin space (1/6-em)]](https://www.rsc.org/images/entities/char_2009.gif) 1), the α value increased from 0.590 to 0.733, indicating that a lower CO content gave a lighter hydrocarbon distribution. When the operating pressure increased from 0.5 to 2.0 MPa, α significantly increased from 0.630 to 0.854, from which it was concluded that a higher operating pressure is beneficial for the growth of the carbon chain and promotes the product moving to heavy hydrocarbons.
1), the α value increased from 0.590 to 0.733, indicating that a lower CO content gave a lighter hydrocarbon distribution. When the operating pressure increased from 0.5 to 2.0 MPa, α significantly increased from 0.630 to 0.854, from which it was concluded that a higher operating pressure is beneficial for the growth of the carbon chain and promotes the product moving to heavy hydrocarbons.
The effect of temperature on the product distribution is more significant than that of the gas hourly space velocity, and the ASF distribution model is more explicit at a higher reaction temperature and lower gas hourly speed velocity. It is generally accepted that the ASF model is based on the step-wise insertion of the C1 species mechanism, indicating that the step-wise mechanism is dominant at higher reaction temperatures.78 This phenomenon has also been mentioned by Tavakoli and co-workers, when they applied the ASF equation on the slurry phase FTS reaction on an iron catalyst.78
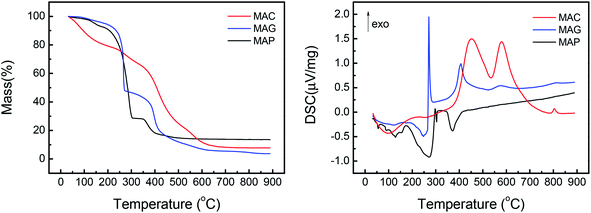
Among the published research works on FTO catalysts, stability tests are mostly carried out at 1000–5000 mL g−1 h−1.65,79 A stability test at 3000 mL g−1 h−1 was conducted on the optimal catalyst, CMAP. It can be seen in Fig. 15 that the reaction approached steady state after 5 h on stream and the CO conversion was maintained at 90% in 200 h on stream. Moreover, the hydrocarbon distribution remained constant during the test, with CH4 of 12.5%, total olefins of 64%, among which light olefins were 58% and C5+ hydrocarbons were 40%. CO conversion decreased by only 1.7% from 80 to 200 h, and the selectivity of C5+ increased slightly in the last 50 h. Nevertheless, the distribution of products changed very little with the variation in CO conversion, indicating that the active phase did not change much at the initial stage of the catalyst deactivation. Sun and Chen80 carried out a 200 h-stability test on an iron-based catalyst that showed a distinguished catalytic performance with 86.7% of CO conversion, with 44.7% and 18.6% of C2–4 olefins and C2–4 paraffins, respectively. They suggested that the addition of Na effectively promoted the carburization of Fe3O4 to the primary active phase χ-Fe5C2 and stabilized the active phase during the reaction. Ma and Ying67 studied the Na and Mn-promoted Fe3O4 microsphere catalyst, which showed 120 hours of stability at 97% of CO conversion and light olefins selectivity of 33%. The addition of the Mn promoter can improve the CO chemisorption, consequently suppressing the second hydrogenation of olefin, leading to a higher O/P ratio. A TGA/DSC was done, with the results depicted in Fig. 15, right. A three-step weight loss was shown at 270, 360 and 450 °C, indicating the formation of heavy hydrocarbon or hydrocarbon derivatives.
 | ||
| Fig. 15 Left: stability test of K–Mn–Fe/MgAl2O4–NH3; right: TGA and DSC curves of the spent catalyst. | ||
5. Conclusion
A series of magnesium aluminate spinels (MgAl2O4) was prepared by citric acid combustion, EDTA sol–gel and NH3 co-precipitation methods. It was found that the structure, surface and pore properties, basicity and reaction behavior of catalysts greatly rely on the synthetic methods. Both citric acid and EDTA are beneficial for the crystallization of spinel at relatively lower temperatures. Complexation facilitates the maintaining of a homogeneous distance between metal ions by the independent chelation. Moreover, a large amount of gas will be released during calcination, preventing the crystal particles from growth and aggregation.With the same amount of active species and promoter loaded on, the influence of the synthesis methods of spinel on CO hydrogenation reaction was investigated in detail. CMAP provided the highest activity and narrower product distribution, and was recommended as the most favorable catalyst due to its facilitation of the reduction and carburization of active iron species. A 200 hour-stability test was conducted on CMAP with no obvious deactivation, during which it exhibited distinguished catalytic performance with CO conversion of ∼90%, CH4 of 12.5%, total olefins of 64% in hydrocarbon product and all over O/P ratio of ∼4.5. Combined with the intrinsically nice thermal and chemical stability and wear resistance, this spinel-based FTO catalyst can satisfy most requirements of various practical reactors.
Conflicts of interest
There are no conflicts to declare.References
- D. X. Martínez-Vargas, L. Sandoval-Rangel, O. Campuzano-Calderon, M. Romero-Flores, F. J. Lozano, K. D. P. Nigam, A. Mendoza and A. Montesinos-Castellanos, Ind. Eng. Chem. Res., 2019, 58, 15872–15901 CrossRef
.
- W. Han, L. Wang, Z. Li, H. Tang, Y. Li, C. Huo, G. Lan, X. Yang and H. Liu, Appl. Catal., A, 2019, 572, 158–167 CrossRef CAS
.
- J. H. B. Hirsa, M. Torres Galvis, C. B. Khare, M. Ruitenbeek, A. Iulian Dugulan and K. P. de Jong, Science, 2012, 335, 835–838 CrossRef
.
- A. C. Koeken, H. M. Torres Galvis, T. Davidian, M. Ruitenbeek and K. P. de Jong, Angew. Chem., Int. Ed., 2012, 51, 7190–7193 CrossRef CAS
.
- H. M. Torres Galvis, J. H. Bitter, T. Davidian, M. Ruitenbeek, A. I. Dugulan and K. P. de Jong, J. Am. Chem. Soc., 2012, 134, 16207–16215 CrossRef CAS
.
- Y. Yuan, S. Huang, H. Wang, Y. Wang, J. Wang, J. Lv, Z. Li and X. Ma, ChemCatChem, 2017, 3144–3152 CrossRef CAS
.
- K. Gong, T. Lin, Y. An, X. Wang, F. Yu, B. Wu, X. Li, S. Li, Y. Lu, L. Zhong and Y. Sun, Appl. Catal., A, 2020, 592, 117414 CrossRef
.
- M. Arsalanfar, A. A. Mirzaei, H. R. Bozorgzadeh, A. Samimi and R. Ghobadi, J. Ind. Eng. Chem., 2014, 20, 1313–1323 CrossRef CAS
.
- W. Ma, G. Jacobs, J. Kang, D. E. Sparks, M. K. Gnanamani, V. R. R. Pendyala, W. D. Shafer, R. A. Keogh, U. M. Graham, G. A. Thomas and B. H. Davis, Catal. Today, 2013, 215, 73–79 CrossRef CAS
.
- S. Yao, C. Yang, H. Zhao, S. Li, L. Lin, W. Wen, J. Liu, G. Hu, W. Li, Y. Hou and D. Ma, J. Phys. Chem. C, 2017, 121, 5154–5160 CrossRef CAS
.
- Q. Wei, X. Gao, G. Liu, R. Yang, H. Zhang, G. Yang, Y. Yoneyama and N. Tsubaki, Fuel, 2018, 211, 1–10 CrossRef CAS
.
- B. Chen, D. Wang, X. Duan, W. Liu, Y. Li, G. Qian, W. Yuan, A. Holmen, X. Zhou and D. Chen, ACS Catal., 2018, 8, 2709–2714 CrossRef CAS
.
- M. Zhang, J. Ren and Y. Yu, ACS Catal., 2020, 10, 689–701 CrossRef CAS
.
- D. Wang, B. Chen, X. Duan, D. Chen and X. Zhou, J. Energy Chem., 2016, 25, 911–916 CrossRef
.
- S.-H. Kang, J. W. Bae, P. S. Sai Prasad, S.-J. Park, K.-J. Woo and K.-W. Jun, Catal. Lett., 2009, 130, 630–636 CrossRef CAS
.
- H. M. Torres Galvis, A. C. J. Koeken, J. H. Bitter, T. Davidian, M. Ruitenbeek, A. I. Dugulan and K. P. de Jong, Catal. Today, 2013, 215, 95–102 CrossRef CAS
.
- X. Chen, D. Deng, X. Pan, Y. Hu and X. Bao, Chem. Commun., 2015, 51, 217–220 RSC
.
- J. D. Xu, K. T. Zhu, X. F. Weng, W. Z. Weng, C. J. Huang and H. L. Wan, Catal. Today, 2013, 215, 86–94 CrossRef CAS
.
- X. Duan, D. Wang, G. Qian, J. C. Walmsley, A. Holmen, D. Chen and X. Zhou, J. Energy Chem., 2016, 25, 311–317 CrossRef
.
- D. Wang, J. Ji, B. Chen, W. Chen, G. Qian, X. Duan, X. Zhou, A. Holmen, D. Chen and J. C. Walmsley, AIChE J., 2017, 63, 154–161 CrossRef CAS
.
- Y. Yang, H.-W. Xiang, L. Tian, H. Wang, C.-H. Zhang, Z.-C. Tao, Y.-Y. Xu, B. Zhong and Y.-W. Li, Appl. Catal., A, 2005, 284, 105–122 CrossRef CAS
.
- K. Asami, K. Komiyama, K. Yoshida and H. Miyahara, Catal. Today, 2018, 303, 117–122 CrossRef CAS
.
- H. Suo, S. Wang, C. Zhang, J. Xu, B. Wu, Y. Yang, H. Xiang and Y.-W. Li, J. Catal., 2012, 286, 111–123 CrossRef CAS
.
- J.-Y. Park, Y.-J. Lee, P. K. Khanna, K.-W. Jun, J. W. Bae and Y. H. Kim, J. Mol. Catal. A: Chem., 2010, 323, 84–90 CrossRef CAS
.
- M. N. Barroso, A. E. Galetti and M. C. Abello, Appl. Catal., A, 2011, 394, 124–131 CrossRef CAS
.
- S. Katheria, G. Deo and D. Kunzru, Appl. Catal., A, 2019, 570, 308–318 CrossRef CAS
.
- H. Li, R. Fu, W. Duan and Z. Jiang, J. Environ. Chem. Eng., 2016, 4, 2187–2195 CrossRef CAS
.
- S. R. de Miguel, I. M. J. Vilella, P. Zgolicz and S. A. Bocanegra, Appl. Catal., A, 2018, 567, 36–44 CrossRef CAS
.
- Y. Jiao, T. Chen, L. Wang, P. Yao, J. Zhang, Y. Chen, Y. Chen and J. Wang, Ind. Eng. Chem. Res., 2020, 59, 4338–4347 CrossRef CAS
.
- M. Abbas, J. Zhang, T. S. Mansour and J. Chen, Int. J. Hydrogen Energy, 2020, 45, 10754–10763 CrossRef CAS
.
- L. Xu and Q. Wang, Catal. Lett., 1994, 24, 177–185 CrossRef CAS
.
- S. Li, S. LÜ, Y. Zhang, J. Li, Z. Liu and L. Wang, J. Fuel Chem. Technol., 2018, 46, 1342–1351 CrossRef CAS
.
- A. A. Mirzaei, S. Vahid and H. O. Torshizi, J. Nat. Gas Sci. Eng., 2013, 15, 106–117 CrossRef CAS
.
- Y. Wang, W. Xiao, J. Chen and K. Pei, Chinses Patent ZL201510670077.4, 2017
.
- Y. Wang, H. X. Li, X. G. Li, D. Chen and W. D. Xiao, Ind. Eng. Chem. Res., 2020, 59, 11462–11474 CrossRef CAS
.
- S. Bocanegra and S. de Miguel, Ind. Eng. Chem. Res., 2010, 49, 4044–4054 CrossRef CAS
.
- N. Habibi, Y. Wang, H. Arandiyan and M. Rezaei, Adv. Powder Technol., 2017, 28, 1249–1257 CrossRef CAS
.
- E. H. Walker, J. W. Owens, M. Etienne and D. Walker, Mater. Res. Bull., 2002, 37, 1041–1050 CrossRef CAS
.
- G. J. Li, Z. R. Sun, C. H. Chen, X. J. Cui and R. M. Ren, Mater. Lett., 2007, 61, 3585–3588 CrossRef CAS
.
- G. D. B. Nuernberg, E. L. Foletto, L. F. D. Probst, C. E. M. Campos, N. L. V. Carreño and M. A. Moreira, Chem. Eng. J., 2012, 193–194, 211–214 CrossRef CAS
.
- H. N. Kim, J. M. Kim, M. J. Kim, J. W. Ko, Y. J. Park, K. Lee and D. H. Choi, Ceram. Int., 2017, 43, 11312–11317 CrossRef CAS
.
- K. Prabhakaran, D. S. Patil, R. Dayal, N. M. Gokhale and S. C. Sharma, Mater. Res. Bull., 2009, 44, 613–618 CrossRef CAS
.
- M. Rubat du Merac, H. J. Kleebe, M. M. Müller and I. E. Reimanis, J. Am. Ceram. Soc., 2013, 96, 3341–3365 CrossRef CAS
.
- A. A. M. D. M. Ibrahima and T. Khalil, Ceram. Int., 1999, 25, 697–704 CrossRef
.
- E. Z. S. Bhaduri and S. B. Bhaduri, Nanostruct. Mater., 1996, 7, 487–496 CrossRef
.
- S. Bhaduri, S. B. Bhaduri and E. Zhou, J. Mater. Res., 1998, 13, 156–165 CrossRef CAS
.
- S. K. Behera, P. Barpanda, S. K. Pratihar and S. Bhattacharyya, Mater. Lett., 2004, 58, 1451–1455 CrossRef CAS
.
- A. Saberi, F. Golestani-Fard, H. Sarpoolaky, M. Willert-Porada, T. Gerdes and R. Simon, J. Alloys Compd., 2008, 462, 142–146 CrossRef CAS
.
- E. M. M. Ewais, A. A. M. El-Amir, D. H. A. Besisa, M. Esmat and B. E. H. El-Anadouli, J. Alloys Compd., 2017, 691, 822–833 CrossRef CAS
.
- M. S. Abdi, T. Ebadzadeh, A. Ghaffari and M. Feli, Adv. Powder Technol., 2015, 26, 175–179 CrossRef CAS
.
- X. Zhang, Mater. Chem. Phys., 2009, 116, 415–420 CrossRef CAS
.
- S. Dash, R. K. Sahoo, A. Das, S. Bajpai, D. Debasish and S. K. Singh, J. Alloys Compd., 2017, 726, 1186–1194 CrossRef CAS
.
- J. C. Groen, L. A. A. Peffer and J. Pérez-Ramirez, Microporous Mesoporous Mater., 2003, 60, 1–17 CrossRef CAS
.
- J. Tan, J. Wang, Z. Zhang, Z. Ma, L. Wang and Y. Liu, Appl. Surf. Sci., 2019, 481, 1538–1548 CrossRef CAS
.
- Q. Pan, J. Peng, T. Sun, S. Wang and S. Wang, Catal. Commun., 2014, 45, 74–78 CrossRef CAS
.
- D. Wang, X. Zhang, J. Ma, H. Yu, J. Shen and W. Wei, Catal. Sci. Technol., 2016, 6, 1530–1545 RSC
.
- Y. Yuan, S. Huang, H. Wang, Y. Wang, J. Wang, J. Lv, Z. Li and X. Ma, ChemCatChem, 2017, 9, 3144–3152 CrossRef CAS
.
- H. Y. Wang, J. Wang, Y. Yuan, Q. Zhao, X. S. Teng, S. Y. Huang and X. B. Ma, Catal. Today, 2018, 314, 101–106 CrossRef CAS
.
- J. F. Li, C. H. Zhang, X. F. Cheng, M. Qing, J. Xu, B. S. Wu, Y. Yang and Y. W. Li, Appl. Catal., A, 2013, 464–465, 10–19 CrossRef CAS
.
- Q. Chang, C. Zhang, C. Liu, Y. Wei, A. V. Cheruvathur, A. I. Dugulan, J. W. Niemantsverdriet, X. Liu, Y. He, M. Qing, L. Zheng, Y. Yun, Y. Yang and Y. Li, ACS Catal., 2018, 8, 3304–3316 CrossRef CAS
.
- E. d. Smit, F. Cinquini, A. M. Beale, O. V. Safonova, W. v. Beek, P. Sautet and B. M. Weckhuysen, J. Am. Chem. Soc., 2010, 132, 14928–14941 CrossRef
.
- C. Yang, H. B. Zhao, Y. L. Hou and D. Ma, J. Am. Chem. Soc., 2012, 134, 15814–15821 CrossRef CAS
.
- Y. Cheng, J. Lin, K. Xu, H. Wang, X. Yao, Y. Pei, S. Yan, M. Qiao and B. Zong, ACS Catal., 2016, 6, 389–399 CrossRef CAS
.
- K. Cheng, V. V. Ordomsky, M. Virginie, B. Legras, P. A. Chernavskii, V. O. Kazak, C. Cordier, S. Paul, Y. Wang and A. Y. Khodakov, Appl. Catal., A, 2014, 488, 66–77 CrossRef CAS
.
- T. Z. Li, H. L. Wang, Y. Yang, H. W. Xiang and Y. W. Li, J. Energy Chem., 2013, 22, 624–632 CrossRef CAS
.
- M. Ding, Y. Yang, B. Wu, J. Xu, C. Zhang, H. Xiang and Y. Li, J. Mol. Catal. A: Chem., 2009, 303, 65–71 CrossRef CAS
.
- H. Zhang, H. Zhang, W. Qian, X. Wu, H. Ma, Q. Sun and W. Ying, Catal. Today, 2020 DOI:10.1016/j.cattod.2020.07.040
.
- B. S. Liu, L. Jiang, H. Sun and C. T. Au, Appl. Surf. Sci., 2007, 253, 5092–5100 CrossRef CAS
.
- B. F. Shi, Z. P. Zhang, Y. Liu, J. J. Su, X. L. Liu, X. N. Li, J. H. Wang, M. H. Zhu, Z. Yang, J. Xu and Y. F. Han, J. Catal., 2020, 381, 150–162 CrossRef CAS
.
- R. Zafari, M. Abdouss and Y. Zamani, Fuel, 2019, 237, 1262–1273 CrossRef CAS
.
- X. Wu, H. Ma, H. Zhang, W. Qian, D. Liu, Q. Sun and W. Ying, Ind. Eng. Chem. Res., 2019, 58, 21350–21362 CrossRef CAS
.
- W. Zhou, K. Cheng, J. Kang, C. Zhou, S. Vijayanand, Q. Zhang and Y. Wang, Chem. Soc. Rev., 2019, 48, 3193–3228 RSC
.
- Q. Chen, W. Qian, H. Zhang, H. Ma, Q. Sun and W. Ying, Catal. Commun., 2019, 124, 92–96 CrossRef CAS
.
- J. Yang, W. Ma, D. Chen, A. Holmen and B. H. Davis, Appl. Catal., A, 2014, 470, 250–260 CrossRef CAS
.
- H. M. Torres Galvis, A. C. J. Koeken, J. H. Bitter, T. Davidian, M. Ruitenbeek, A. I. Dugulan and K. P. de Jong, J. Catal., 2013, 303, 22–30 CrossRef CAS
.
- Y. Fei, T. Lin, X. Wang, S. Li, Y. Lu, H. Wang, L. Zhong and Y. Sun, Appl. Catal., A, 2018, 563, 146–153 CrossRef
.
- D. B. Bukur, B. Todic and N. Elbashir, Catal. Today, 2016, 275, 66–75 CrossRef CAS
.
- A. Tavakoli, M. Sohrabi and A. Kargari, Chem. Eng. J., 2008, 136, 358–363 CrossRef CAS
.
- J. B. Li, H. F. Ma, H. T. Zhang, Q. W. Sun, W. Y. Ying and D. Y. Fang, Fuel Process. Technol., 2014, 125, 119–124 CrossRef CAS
.
- J. Sun, Y. Chen and J. Chen, Catal. Commun., 2017, 91, 34–37 CrossRef CAS
.
- J. C. Park, S. Jang, G. B. Rhim, J. H. Lee, H. Choi, H.-D. Jeong, M. H. Youn, D.-W. Lee, K. Y. Koo, S. W. Kang, J.-I. Yang, H.-T. Lee, H. Jung, C. S. Kim and D. H. Chun, Appl. Catal., A, 2018, 564, 190–198 CrossRef CAS
.
Footnote |
| † Electronic supplementary information (ESI) available: Amount of precursor used in support and catalyst preparation; element content; CO2-TPD of support and fresh catalysts; Fe 2p and C 1s XPS spectra of activated catalysts; Raman spectra of supports and fresh catalysts; an example of catalytic performance data analysis. See DOI: 10.1039/d0ra08387a |
| This journal is © The Royal Society of Chemistry 2020 |

