 Open Access Article
Creative Commons Attribution 3.0 Unported Licence
Transformation of novel TiOF2 nanoparticles to cluster TiO2-{001/101} and its degradation of tetracycline hydrochloride under simulated sunlight
Yue Jianac,
Huayang Liub,
Jiaming Zhuac,
Yaqiong Zengac,
Zuohua Liua,
Chentao Hou *b and
Shihua Pu*ac
aChongqing Academy of Animal Sciences, Chongqing 402460, China. E-mail: pu88962@126.com
bCollege of Geology and Environment, Xi'an University of Science and Technology, Xi'an 710054, China. E-mail: 807484470@qq.com
cScientific Observation and Experiment Station of Livestock Equipment Engineering in Southwest, Ministry of Agriculture and Rural Affairs, Chongqing 402460, China
First published on 24th November 2020
Abstract
The anatase type cluster TiO2-{001/101} was rapidly generated by a one-step hydrothermal method. The transformation process of coral-like TiOF2 nanoparticles to cluster TiO2-{001/101} was investigated for the first time, and the sensitization between cluster TiO2-{001/101} and tetracycline hydrochloride (TCH) was also discussed. The degradation rate of TCH by cluster TiO2-{001/101} under simulated sunlight was 92.3%, and the total removal rate was 1.76 times that of P25. Besides, cluster TiO2-{001/101} settles more easily than P25 in deionized water. The study showed that cluster TiO2-{001/101} derived from coral-like TiOF2 nanoparticles had a strong adsorption effect on TCH, which was attributed to the oxygen vacancy (Ov) and {001} facets of cluster TiO2-{001/101}. The strong adsorption effect promoted the sensitization between cluster TiO2-{001/101} and TCH, and widened the visible light absorption range of cluster TiO2-{001/101}. In addition, the fluorescence emission spectrum showed that cluster TiO2-{001/101} had a lower luminous intensity, which was attributed to the heterojunction formed by {001} facets and {101} facets that reduces the recombination rate of carriers. It should be noted that cluster TiO2-{001/101} still has good degradation performance for TCH after five cycles of degradation. This study provides a new idea for the synthesis of cluster TiO2-{001/101} with high photocatalytic performance for the treatment of TCH wastewater.
1. Introduction
Antibiotics are widely used around the world. TCH is a typical broad-spectrum tetracycline antibiotic, which is produced by actinomycetes and widely used as a growth promoter in the treatment of human diseases and animal feeding.1 However, because the naphthol ring in the TCH structure can't be completely metabolized by humans and animals, a large amount of TCH absorbed is excreted into various water bodies through feces and urine.2 Drinking water containing TCH for a long time will cause a series of diseases such as bacterial disorders, gastrointestinal reactions and mycoplasma pneumonia, and affect the growth of teeth and bones.3–5In recent years, some methods have been used to treat TCH wastewater, such as microbial degradation,6,7 adsorption,8,9 electrochemical method,10 membrane separation method,11,12 photocatalytic degradation.13–16 Among these methods, photocatalytic water purification technology is considered to be the most promising water treatment technology due to its economic, efficient and clean environment.17–20
TiO2 is widely used in environmental protection,18 biomedicine,21 solar cells22 and many other fields due to its advantages of simple control, low cost and non-toxic.23 Especially in the photocatalytic treatment of pollutants showed excellent performance. However, it has a wide energy band gap (3.0–3.2 eV, which means it only reacts to UV) and a high carrier recombination rate, which hinders its application in sunlight.24,25 So far, many efforts have been made to make up for these shortcomings, such as metal doping,26–28 non-metal doping,29–31 dye sensitization,32–34 and building heterogeneous semiconductor composite.35–38 Among these methods, the construction of semiconductor heterojunction seems to be an effective method to improve charge separation. However, the high-quality tight interface requirements required by heterojunction make the construction more difficult.39 Although dye sensitization can improve the response of TiO2 to visible light and enhance the photocatalytic activity. However, due to the weak binding force between organic dyes and TiO2, if the dyes can not timely supplement the lost electrons in the system, the dyes will fall off from the TiO2 and form competitive degradation with the target pollutants, which will reduce the degradation efficiency of the target pollutants.40 Doping is the most commonly used method to enhance the photocatalytic activity of TiO2 because of its simple method.41–44
It is worth noting that fluorine (F) is a special anionic dopant. The existence of fluorine forms –Ti–F–Ti– and Ti3+ species to replace lattice oxygen to form Ovs.45 The formation of Ti3+/Ovs is an effective and environmentally friendly strategy to improve visible light absorption and pollutant adsorption. Moreover, the existence of Ov can form an electron trap, which greatly reduces the composite rate of electrons and holes, thus effectively enhancing the photocatalytic activity of TiO2.46,47 Furthermore, F, as an end-capping agent, promotes the growth of TiO2-{001} facet.48 For instance, Han et al.49 using tetrabutyl titanate and hydrofluoric acid as precursors, the F–TiO2 nanosheets with 89% TiO2-{001} facets were obtained by hydrothermal treatment. Its photocatalytic activity is much higher than that of Degussa P25. Up to now, extensive experimental and theoretical studies have shown that the {001} facet with high surface energy has higher catalytic activity than the {101} facet with thermodynamic stability.50,51 This is because a low coordination number of exposed atoms and a high density of unsaturated Ti atoms on the {001} facet are in favor of the dissociation and adsorption of reactants.52 Lu et al.53 demonstrated that the {001} facets of anatase TiO2 nanocrystals exhibited much better photocatalytic activity than that of {101} facets of anatase TiO2 nanocrystals toward photocatalytic oxidation of water and organic compounds with different functional groups (e.g., –OH, –CHO, –COOH). Besides, Chen et al.54 found that anatase TiO2 microcrystals with highly exposed {001} facets have strong photocatalytic decomposition ability for gaseous styrene. Although the surface has very high surface energy, maximizing the percentage of exposed {001} area might not be a good direction. Khalil et al.55 demonstrated that an appropriate proportion of exposed {001} and {101} facet, which forms a “surface heterojunction”. In the photocatalytic reactions, photogenerated electrons tend to transfer to the {101} facet with lower energy, and thus accumulating on the {101} facet, while photogenerated holes tend to accumulate on the {001} facet with high energy. This feature can effectively promote the separation of photogenerated electron–hole pairs, thereby improving their photocatalytic performance.56 Therefore, it is necessary to explore how to synthesize TiO2 with {001} and {101} facet.
In many methods of synthesing TiO2, solvothermal reaction conditions are relatively mild, and it can control the morphology of materials well.22,28,57 In the typical synthesis methods, tetrabutyl titanate was used as titanium source, ethanol as an inhibitor and hydrofluoric acid as end-capping agent. After hydrothermal treatment, TiO2 nanosheets with {001} and {101} facets co-exposed could be synthesized. Interestingly, TiOF2 is sometimes formed during the formation of TiO2-{001}. In the previously reported X-ray diffraction characterization, it can be seen that TiOF2 has two crystal forms, corresponding to no. 08-0060 and no. 01-0490 in JCPDS database.25,58 The TiOF2 corresponding to JCPDS no. 08-0060 shows regular cubic morphology, while the TiOF2 corresponding to JCPDS no. 01-0490 shows irregular morphology of nanoparticles. Over the past ten years, some researchers have carried out extensive research on cubic TiOF2. For instance, Zhang et al.59 synthesized 3D hollow nanospheres with {001} main exposure facet using cubic TiOF2 as a template, which improved the response of TiO2 to visible light. Zhang et al.58,60,61 controlled the formation process of TiO2-{001} nanosheets under different hydrofluoric acid dosage, reaction time and reaction temperature. It is found that cubic TiOF2 is an important intermediate in the hydrothermal synthesis of TiO2-{001} nanosheets. Shi et al.62 studied the transformation process of cubic TiOF2 to TiO2-{001/101} at different calcination temperatures and proposed the possible transformation mechanism of TiOF2 to TiO2-{001/101}. However, anatase TiO2 nanosheets derived from cubic TiOF2 are relatively large and easy to aggregate, which undoubtedly reduces the exposure area of TiO2-{001} and leads to a low density of active sites, which inevitably increases the possibility of carrier recombination. Therefore, to further improve the photocatalytic activity of anatase TiO2, it is necessary to synthesize small-sized TiO2 with {001} and {101} facet co-exposed. Compared with cubic TiOF2, few researchers pay attention to the TiOF2 nanoparticles corresponding to JCPDS no. 01-0490. In our previous research,25 this crystal type of TiOF2 nanoparticles were successfully synthesized, and found that it can also transform into anatase TiO2-{001} in hydrothermal reaction, and the obtained TiO2/TiOF2 hybrid has close interface contact and layered structure. Compared with cubic TiOF2, this kind of TiOF2 nanoparticles has a large number of mesoporous structures and smaller size. To enrich the research system of TiOF2, it is necessary to explore the transition process of novel TiOF2 in hydrothermal reaction. Moreover, this kind of TiOF2 will be expected to transform into smaller TiO2-(001/101) nanosheets under certain conditions.
In this study, the transition process of novel TiOF2 nanoparticles to cluster TiO2-{001/101} in the hydrothermal reaction was discussed for the first time. Under the irradiation of simulated sunlight, the degradation rate of TCH by TiO2-{001/101} was 92.3%. Besides, the sedimentation performance of TiO2-{001/101} was investigated and compared with that of Degussa P25. Furthermore, the sensitization between TCH and TiO2-{001/101} was proposed for the first time, and the possible degradation pathway of TCH was discussed. This study provides an idea for the treatment of TCH wastewater.
2. Experimental
2.1. Chemicals
Tetrabutyl titanate (TBOT, A. R.), anhydrous ethanol (C2H5OH, A. R.), hydrofluoric acid (HF, A. R.) was purchased from Fuchen Chemical Reagent Factory, Tianjin, China. Degussa P25 (P25) was purchased from Beijing JiaHeng Technology Co., Ltd. Tetracycline hydrochloride (TCH) was provided by Aladdin Industrial Corporation (Shanghai, China), benzoquinone (BQ), methanol (MT), tert-butyl alcohol (t-BuOH) were purchased from Fuchen Chemical Reagent Factory, Tianjin, China. All reagents were used without further purification.2.2. Synthesis of the photocatalysts
The experimental water is ultra-pure water. TiO2-{001/101} were synthesized by a one-step hydrothermal method. Add 30 mL anhydrous ethanol and 8 mL hydrofluoric acid into 100 mL polytetrafluoroethylene liner (Shanghai Qiuzuo Scientific Instrument Co., Ltd), stir for 10 min at 25 °C, and record the mixture as solution A. Take 30 mL tetrabutyl titanate, add it to solution A under stirring at the rate of 2 drops per second to form a white suspension, and stir the mixture at 25 °C for 2 h. Then, the polytetrafluoroethylene was placed in a high-pressure reactor (Shanghai Qiuzuo Scientific Instrument Co., Ltd) and reacted at 150 °C for 4 h. After the system is naturally cooled to room temperature, the solid products are collected by centrifugation and washed with ethanol and ultra-pure water three times. The samples were dried at 60 °C and named T-4h. The above steps remained unchanged and the reaction time varied between 0.5 h, 1 h and 3 h to study the transition process of novel TiOF2 to TiO2-{001/101}. These products were recorded as T-0.5h, T-1h, T-3h. Besides, we put the photocatalyst (30 mg) into 100 mL TCH (10 mg L−1), stirred for 60 min under dark conditions, and then centrifuged and dried at 60 °C. The obtained samples were recorded as T-0.5h/TCH, T-1h/TCH, T-3h/TCH, T-4h/TCH and P25/TCH.2.3. Characterization of the samples
The crystal structure of the samples was observed using X-ray diffraction (XRD; Bruker D8 Advance X-ray diffractometer) at 36 kV, 20 mA equipped with a Cu anode X-ray tube (Cu Kα X-rays, λ = 1.54056 Å). SEM and EDS (JSM7500F, Japan) were used to record the surface morphology and element distribution of the samples. Transmission electron microscopy (TEM) images were achieved with a JEOL JEM-2100 high-resolution transmission electron microscope. The specific surface area (SBET) and pore size analysis were performed by Brunauer–Emmett–Teller (BET) and Barrett–Joyner–Halenda (BJH) methods through a micromeritics JW-BK122W. The absorption characteristics of the samples were determined by UV-visible diffuse absorption spectroscopy (UV-Vis DRS, Shimadzu UV-2600, Japan). Fourier transform infrared spectrum (FT-IR) measurements, recorded in the range of 4000–400 cm−1, were performed in KBr pellet by Nicolet IS5 Spectrometer, USA. The photoluminescence spectrum of the photocatalyst was measured by a fluorescence spectrometer (Shimadzu-RF-6000, Japan) with the excitation wavelength was 300 nm. The chemical valence states of the samples were analyzed by X-ray photoelectron spectroscopy (XPS, ThermoFisher K-Alpha). Electron paramagnetic resonance (EPR) was implemented by the BrukerA 300 spectrometer operating at room temperature.2.4. Photocatalytic activity measurement
The photocatalytic activity of the catalyst was tested by the degradation of TCH. First, at the maximum absorption wavelength of 357 nm, the initial absorbance of TCH solution (10 mg L−1) was measured by a UV-Vis spectrophotometer (Hitachi, UV-3900, Japan). After that, take 100 mL of TCH solution (10 mg L−1) in a measuring cylinder and put it into a 150 mL photocatalytic reaction tube (Ghx-1, Shanghai Qiaofeng Industrial Co., Ltd), weigh 30 mg of photocatalyst and add it into the TCH solution. The photocatalytic reaction tube was placed in the photocatalytic reactor (Ghx-1, Shanghai Qiaofeng Industrial Co., Ltd), and a 500 W xenon lamp (GXZ-500, Shanghai Jiguang Special Lighting Appliance actory) was used to simulate the degradation of TCH by sunlight. Before the xenon lamp is turned on, the solution is magnetically stirred in the dark for 60 min to ensure the adsorption balance, then turn on the xenon lamp to start the photodegradation test, take out 7 mL suspension every 10 min, and centrifugate at high speed to remove the catalyst, then analyze the remaining TCH concentration with UV-Vis spectrophotometer at the maximum absorption wavelength of 357 nm. After each photodegradation experiment, the sample was separated by a high-speed centrifuge (Tgl-16c, Shanghai Anting Scientific Instrument Factory), washed with distilled water, and ultimately dried at 60 °C for the next test. The initial concentration of TCH was changed from 10 mg L−1 to 20 mg L−1, 30 mg L−1 and 40 mg L−1 to explore the effect of different TCH concentrations on photocatalytic degradation. The dosage of the photocatalyst was changed from 30 mg to 10 mg, 20 mg and 40 mg to explore the effect of photocatalyst dosage on the degradation of TCH. Different scavengers (BQ, MT and t-BuOH) were used to trap the active components (·O2−, h+, ·OH) in the photocatalytic process. This test is similar to the photocatalytic degradation test, except that a certain amount of scavenger was added to the TCH solution, and then photocatalyst was added.2.5. Sedimentation experiment
The settling behavior of T-4h and P25 in deionized water were studied in glass cylinders (100 mL, diameter 2.8 cm, height 24 cm Fuchen Chemical Reagent Factory, Tianjin, China). T-4h suspension (1 g L−1) was prepared with deionized water. The obtained T-4h suspension was homogenized by violent shaking and then poured into the cylinder. The settlement behavior of T-4h was observed by standing for 2 h, 10 h, 24 h. The settlement behavior of P25 was studied under the same conditions.3. Results and discussion
3.1. Crystal structure analysis
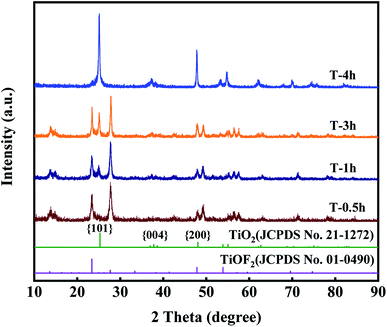
Fig. 1 clearly shows the crystal structure of the prepared samples. For T-0.5h, the diffraction peaks at 2θ = 13.61°, 23.39°, 27.68°, 47.8°, 53.88°, 59.6°, 69.6°, 74.7° match with TiOF2 (JCPDS no. 01-0490), indicating that the novel TiOF2 was successfully prepared.25For T-4h, the diffraction peaks at 2θ = 25°, 37.76°, 47.8°, 54.86°, 56.6°, 70.3°, 75°, 82.22° are attributed to the {101}, {004}, {200}, {105}, {211}, {220}, {215}, {224} planes of anatase TiO2 (JCPDS no. 21-1272), respectively.30,32,38 It can be seen that with the reaction time from 0.5 h to 4 h, the diffraction peak intensity of TiO2 {101} facet increases gradually, while the diffraction peak of TiOF2 completely disappears at 4 h, which indicates that TiOF2 has completely evolved into anatase TiO2. It should be noted that there is an obvious diffraction peak of {004} facet in T-4h, which is often referred to as the existence of {001} facet.25,39
In summary, the chemical reactions of the formation of TiO2-{001/101} nanosheets can be proposed. The first step is the hydrolysis of TBOT. The reaction of TBOT to form Ti(OH)4 is shown in eqn (1).54 Secondly, Ti(OH)4 can react with HF to produce TiOF2 eqn (2).25 Finally, with the hydrothermal reaction, TiOF2 was hydrolyzed to anatase TiO2-{001/101}, as shown in eqn (3).47
| Ti(OC4H9)4 + 4H2O → Ti(OH)4 + 4C4H9OH | (1) |
| Ti(OH)4 + 2HF → TiOF2↓ + 3H2O | (2) |
| TiOF2 + H2O → TiO2↓ + 2HF | (3) |
3.2. Morphology analysis of photocatalyst
Field emission scanning electron microscopy (FE-SEM) images of T-0.5h, T-1h, T-3h, T-4h are shown in Fig. 2. Fig. 2a shows the T-0.5h image. The novel of TiOF2 shows coral-like structure formed by the accumulation of spherical TiOF2 nanoparticles, which is completely different from the cubic TiOF2 that researchers have focused on before.58–61 The novel TiOF2 has many macroporous structures, which is consistent with the pore size analysis. With the extension of reaction time, the spherical TiOF2 nanoparticles tend to be flat, which may be due to the conversion of some TiOF2 to TiO2 (Fig. 2b). With the further hydrothermal reaction, it can be seen that the TiO2 nanosheets derived from the surface of TiOF2 are closely interlaced (Fig. 2c). By XRD analysis, most of the {101} and a few {001} facets of TiO2 have been co-exposed, and a close interface contact is formed between the TiO2-{001/101} and the untransformed TiOF2. When the reaction was further extended to 4 h, only TiO2-{001/101} nanosheets were formed (Fig. 2d). TiO2 nanosheets with an average diameter of about 200 nm are interlaced with each other to form clusters, which is conducive to the migration and transformation of electrons and holes between {001} and {101} facets. To further describe the element distribution of T-4h, elemental mapping analysis (Fig. 2e–g) of T-4h was performed. It is proved the existence of Ti, O, F elements and the mapping image matches well with the SEM image.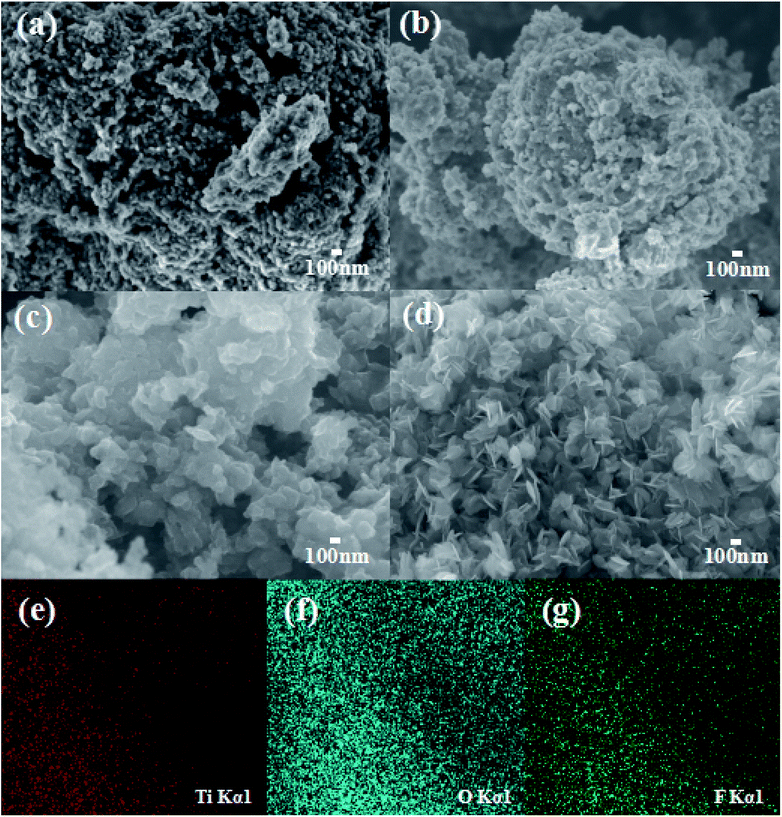 | ||
| Fig. 2 The high-magnification FE-SEM images of (a) T-0.5h, (b) T-1h, (c) T-3h, (d) T-4h; the element mapping of (e) Ti, (f) O, (g) F in T-4h. | ||
More morphological details on prepared samples were further obtained using transmission electron microscopy (TEM) images. It can be seen from Fig. 3a that the TiOF2 nanoparticles are tightly packed together, which is consistent with the results observed by SEM. With the hydrothermal reaction, a small part of TiOF2 was transformed into TiO2, showing a loose stacking structure (Fig. 3b). With further reaction, it can be seen that TiOF2 nanoparticles are more dispersed, and more TiO2 nanosheets with the size of 100–200 nm are closely linked with TiOF2 (Fig. 3c). In Fig. 4d, it can be seen that the TiOF2 nanoparticles have been completely transformed in TiO2 nanosheets with {001} and {101} facets interlaced, with an average size of 200 nm. High-resolution TEM (HRTEM) image of T-4h (Fig. 3e) shows that the clear lattice fringes with a spacing of 0.352 nm correspond to the {101} facets, indicating that {101} facet is exposed on the surface of T-4h.41 The T-4h with a lattice spacing of 0.235 nm is indexed to the {004} planed (Fig. 3f), demonstrating the exposure of {001} facet on the surface of T-4h.45,49 Compared with the TiO2 with {001} facet exposure reported by most studies,48,54 the size of TiO2-{001/101} derived from coral-like TiOF2 is smaller. All the above results indicate that the coral-like TiOF2 can be transformed into cluster TiO2-{001/101}.
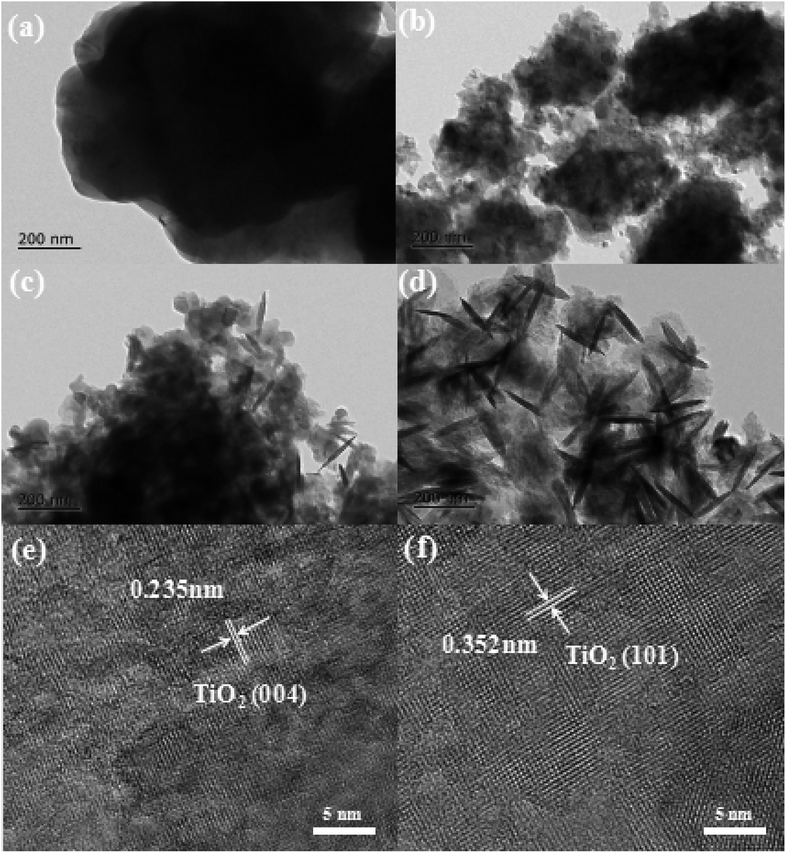 | ||
| Fig. 3 TEM images of as-prepared samples (a) T-0.5h, (b) T-1h, (c) T-3h, (d) T-4h, and HRTEM images of (e and f) T-4h. | ||
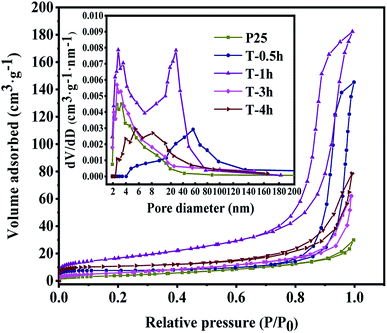 | ||
| Fig. 4 Nitrogen adsorption and desorption isotherms of T-0.5h, T-1h, T-3h, T-4h and P25. The inset is the corresponding pore size distribution. | ||
3.3. BET specific surface area and pore structure
The specific surface area and pore size distribution of T-0.5h, T-1h, T-3h, T-4h were analyzed by nitrogen adsorption–desorption technology. As shown in Fig. 4, according to the classification of IUPAC, T-0.5h and T-1h show a typical IV type adsorption–desorption isotherm with H1 type hysteresis ring, which represents that the samples have a mesoporous structure with close-packed spherical particles and matches the image presented by SEM. T-3h, T-4h and P25 show a typical IV type adsorption–desorption isotherm with H3 type hysteresis ring, which represents that the samples have a mesoporous structure with cracks.22 Table 1 shows the specific surface area, pore volume and average pore size of all samples.| Samples | Surface area (m2 g−1) | Pore volume (cm3 g−1) | Average pore size (nm) |
|---|---|---|---|
| T-0.5h | 33.44 | 0.22477 | 37.39 |
| T-1h | 92.40 | 0.28203 | 18.88 |
| T-3h | 31.75 | 0.09572 | 17.78 |
| T-4h | 50.06 | 0.12127 | 13.82 |
| P25 | 21.98 | 0.04630 | 12.67 |
The specific surface areas of T-0.5h, T-1h, T-3h, T-4h are 33.44, 92.4, 31.75, 50.06 m2 g−1, respectively. The specific surface area of these samples is larger than that of P25 (21.98 m2 g−1). According to the corresponding BJH pore size distribution diagram (Fig. 4 inset), the average pore size of T-4h is 13.82 nm, which is well-matched with the size of TC (1.41 nm in length, 0.46 nm in width and 0.82 nm in height).
This is consistent with the strong removal rate of the dark reaction stage in the subsequent photocatalytic degradation experiment. Besides, these uniform and small pore size mesopores are conducive to the absorption of light and multiple reflections inside the material and provide an effective transmission path for photogenerated carriers.3
3.4. FT-IR and EPR analysis
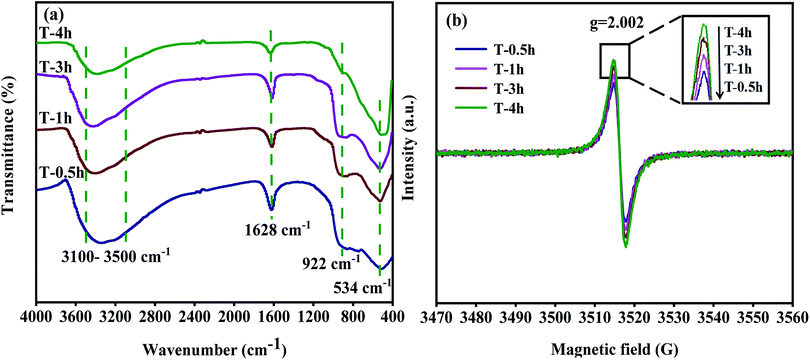
Fig. 5a shows the FT-IR spectra of photocatalysts prepared at different hydrothermal reaction times. The stretching and bending vibrations due to absorption by H2O and the Ti–OH group on the sample surface are found at 3100–3500 cm−1 and 1628 cm−1.25,47 T-0.5h, T-1h, T-3h have strong peaks at 922 cm−1, which is attributed to Ti–F vibration in TiOF2. T-4h has an only a slight peak at 922 cm−1, which can be attributed to the Ti–F vibration formed by adsorbed F and TiO2.50 The peak at 534 cm−1 is attributed to Ti–O vibration or Ti–O–Ti vibration.52 It should be noted that the peak of T-4h shifts negatively from 534 cm−1, which may be attributed to the formation of Ti3+ and Ov. The increased number of Ov in the lattice structure changes the number of Ti atom surrounding the O atom, and the electron cloud density around a Ti atom decreased.59 This causes the stretching vibration absorption peak of a Ti–O bond to shift. Additional information on oxygen vacancy (Ov) was provided by EPR spectra collected at room temperature. As displayed in Fig. 5b, the signal at g = 2.002 corresponds to Ov.63 It can be seen that all samples show the signal of Ov, and with the transformation of TiOF2 to TiO2-{001/101}, the signal of Ov in T-4h is the strongest, which indicates that there is a lot of Ov in T-4h, which will effectively inhibit the recombination of electrons and holes, and improve the photocatalytic activity.3.5. XPS analysis
The surface compositions and chemical states of pure T-0.5h, T-1h, T-3h and T-4h are displayed in Fig. 6. The survey spectra reveal signals of Ti, O, F, and C on all samples that match their respective signals from the individual spectra of TiOF2 and TiO2 (Fig. 6a), which is in accordance with the element mapping results. The existence of the peaks of element C at 284.8 eV can ascribe to surface adventitious reference carbon, which is unavoidable during the XPS measurement.25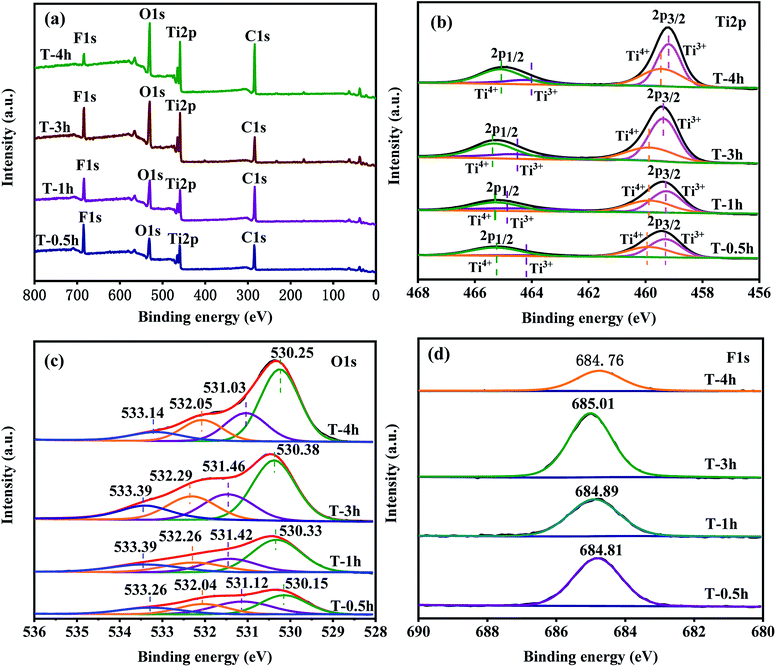 | ||
| Fig. 6 (a) Survey XPS spectra of the samples; (b, c and d) high-resolution XPS data of Ti2p, O1s and F1s for samples respectively. | ||
From the high-resolution XPS spectrum of Ti2p in the samples (Fig. 6b). The binding energies of both Ti2p3/2 (from 459.48 to 459.18 eV) and Ti2p1/2 (from 465.28 to 464.88 eV) decreased slightly from TiOF2 nanoparticles to cluster TiO2-{001/101}. This could be attributed to the decreased bond strength of the Ti–O bond in TiO2 compared with the Ti–F bond in TiOF2 nanoparticles.58 Through Gauss fitting, these peaks centered at 459.31 and 464.21 eV were ascribed to Ti3+ species, while peaks at 459.88 and 465.26 eV were ascribed to Ti4+ which indicate that the Ti3+ has formed in the reduction process.25 The relative content of Ti3+ increases gradually with the increase of hydrothermal reaction time. The asymmetric O1s spectra were fitted to four different types of O, as shown in Fig. 6c. After Gauss fitting of all samples, the peak of the binding energy of each sample from small to large corresponds to lattice oxygen, hydroxyl oxygen, Ov and oxygen in adsorbed water, which can be considered as convincing evidence for the existence of Ov.58,63,64
Fig. 6d shows the core-level F1s XPS spectra. The binding energy of F1s electrons shifted from 684.81 eV for T-0.5h to 684.76 eV for T-4h. The slight decrease in the F1s binding energy indicated the shifting of the Ti–F bond in the bulk TiOF2 nanoparticles to the surface Ti–F bonds on the TiO2 nanosheets.2
3.6. The optical absorption and PL analysis
Fig. 7a shows the light absorption performance of different photocatalysts and complexes after the adsorption of TCH. All samples show different absorption in the UV region without adsorption of TCH. The amount of light absorbed in the UV region increased in the order T-1h < P25 < T-0.5h < T-3h < T-4h. However, in the visible region, only T-0.5h shows visible light response, which is attributed to the narrow band gap energy of TiOF2 (2.91 eV), as shown in Fig. 7b. Many researchers22,34 have studied the sensitization between TiO2 and dyes, but only a few researchers focus on the sensitization between TiO2 and antibiotics. Hasan et al.65 believed that the LMCT effect formed between sulfonamides and TiO2, because sulfonamides did not absorb visible light. Interestingly, TCH has strong absorption in the visible and UV regions as shown in Fig. 7b, which is attributed to TCH molecule possesses a delocalized π bond connected with –OH group, leading to a small energy gap between highest occupied molecular orbital (HOMO) and lowest unoccupied molecular orbital (LUMO) and thus availability for visible light absorption.66 When the photocatalyst adsorbs TCH, it shows different degrees of absorption in the visible light region. Wu et al.66 believed that the electron excited by visible light from HOMO to LUMO of TCH and further transferred to the conduction band of TiO2 was a kind of sensitization. P25/TCH has only weak light absorption in the UV and visible light region. The amount of light absorbed in the visible light region increased in the order P25/TCH < T-4h/TCH < T-3h/TCH < T-1h/TCH < T-0.5h/TCH. The novel TiOF2 seems to be more easily sensitized with TCH, showing the strongest absorption in the visible region, which may be attributed to the formation of intermolecular hydroxyl groups, which makes the π orbitals of TCH more easily form electronic coupling with the 3d orbitals of Ti4+ and Ti3+, resulting in the formation of tight surface complexes between TCH and TiOF2. Although the T-0.5h/TCH has a strong response to visible light, T-0.5h does not show the best photocatalytic activity in the degradation test of TCH, which shows that the response-ability of photocatalyst to visible light is not the only factor to evaluate the photocatalytic activity. The band gap energy (Eg) of T-0.5h, T-1h, T-3h, T-4h and P25 was calculated according to the Tauc curve. The results are shown in Fig. 7b. The band gap energies of T-0.5h, T-1h, T-3h, T-4h and P25 are 2.91 eV, 3.00 eV, 3.00 eV, 2.97 eV and 3.05 eV.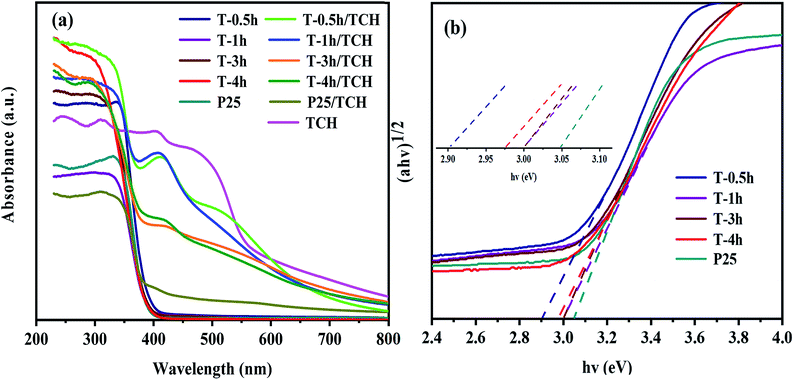 | ||
| Fig. 7 (a) UV-Vis absorbance spectra of the samples and (b) the corresponding plots of (αhv)1/2 versus hv. | ||
PL measurements are effective to examine the separation efficiency and recombination processes of photo-generated carriers because increased photo-generated electron–hole pair recombination results in stronger luminescence intensity. Three peaks were observed in the spectra.
Fig. 8 representatively shows the PL spectra of the T-0.5h, T-1h, T-3h, T-4h and P25 samples. Three peaks were observed in the spectra. The broad emission bands centered at 390 nm were ascribed to the interband transition of TiO2.55 The two peaks at 454 and 469 nm are attributed to the Ov and two trapped electrons. The peak of Ov also appears in P25, which is attributed to the mixture of rutile and anatase phases, which increases the defect density in TiO2 lattice.25 It is worth noting that the luminescence intensity of T-3h is significantly lower than that of T-0.5h and T-1h, which can be attributed to the formation of suitable heterojunction between residual TiOF2 and TiO2, which greatly reduces the recombination rate of electrons and holes. T-4h shows the lowest luminescence intensity, much lower than that of P25, this may be due to the surface heterojunction formed on {001} and {101} facets and the highest Ov concentration.56,59
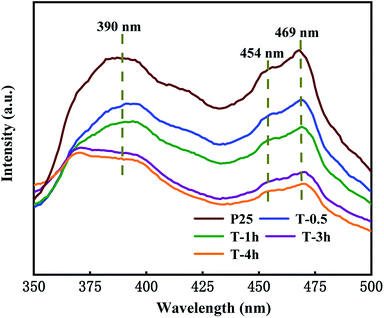 | ||
| Fig. 8 The photoluminescence spectra with the excitation wavelength λex = 300 nm for T-0.5h, T-1h, T-3h, T-4h and P25. | ||
3.7. Photocatalytic activity
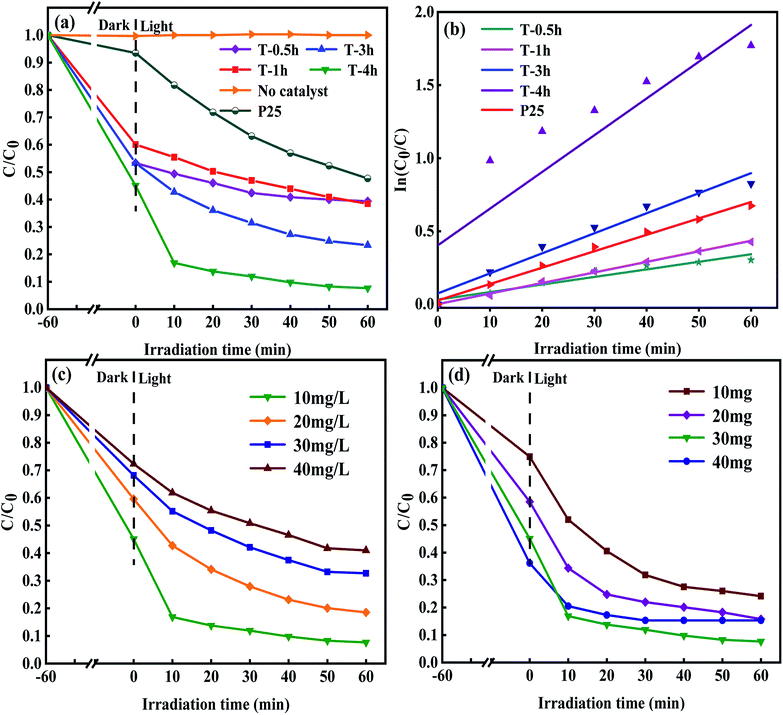
To study the photocatalytic performance of samples, TCH solution was used as a typical antibiotic pollutant in water to simulate the solar photocatalytic degradation test. The results are shown in Fig. 9a. The photocatalysis system reacts in the dark for 60 minutes to reach the adsorption–desorption equilibrium before the sunlight. TCH has little self-degradation under sunlight. It can be seen that the samples of T-0.5h, T-1h, T-3h and T-4h have good adsorption properties. When the adsorption–desorption equilibrium was reached, the removal rates of TCH were 40%, 47%, 47% and 55%, respectively. T-4h sample has the strongest adsorption capacity for TCH. Large specific surface area, suitable pore structure and high exposure {001} facets make TCH easy to adsorb on the surface of T-4h, which lays a foundation for the subsequent photocatalytic degradation. Although the adsorption capacity of T-0.5h for TCH is stronger than that of T-1h, the total removal rate (60%) is not higher than that of T-1h (62%). This shows that the adsorption performance of photocatalyst for TCH can not dominate its ability to degrade TCH. Surprisingly, the total degradation rate of TCH by T-4h reached 83.2% only after 10 min irradiation under simulated sunlight, and 92.3% after 60 min irradiation, which was much higher than that of P25 (52%).The degradation kinetic model was studied and the photocatalytic properties of the samples were further analyzed. Fig. 9b shows that the linear relationship between degradation time (t) and ln(C0/C) is almost a straight line, which proves that the degradation process of TCH conforms to pseudo-first-order reaction. The rate constants k of T-0.5h, T-1h, T-3h, T-4h and P25 were 0.00518, 0.00722, 0.01372, 0.02514 and 0.01123 min−1, respectively. The results showed that the degradation rate of TCH by T-3h photocatalyst was significantly higher than that of T-0.5h and T-1h, which may be due to the appropriate ratio of residual TiOF2 and TiO2 in T-3h sample, and the synergistic effect of the two substances promoted the photodegradation.
The maximum rate constant of T-4h was 2.24 times that of P25. Besides, the effects of different concentrations of TCH solution on the photocatalytic performance of the T-4h sample were studied (Fig. 9c). T-4h had the best degradation effect on the TCH solution of 10 mg L−1. With the increase of TCH solution concentration, the photocatalytic performance of T-4h gradually decreased. It may be that the photocatalyst is not to provide enough active reaction sites to deal with so many TCH molecules. Fig. 9d shows the degradation curve of TCH solution with different T-4h dosage (0.1 g L−1, 0.2 g L−1, 0.3 g L−1, 0.4 g L−1). When the amount of catalyst is 0.3 g L−1, the degradation effect of TCH is the best.
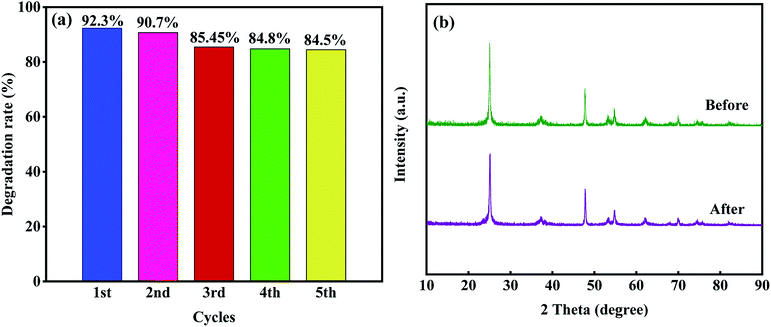
However, when the dosage of T-4h reached 0.4 g L−1, the photocatalytic effect decreased which may be due to the aggregation of excessive catalysts, which makes the solution turbid and leads to photon scattering, thus reducing the photocatalytic rate.16 The stability and reusability of photocatalyst are important factors affecting its practical application. Five consecutive cyclic photodegradation tests were carried out on sample T-4h, and the results are shown in Fig. 10a. After five cycles, the degradation rate of sample T-4h in simulated sunlight decreased from 92.3% to 84.5%, indicating that sample T-4h has a high reuse rate and photocatalytic performance.
As shown in Fig. 10b, after five cycles, the peak intensity of T-4h photocatalyst decreased, but the position of diffraction peak was the same as that before reaction, indicating that T-4h has high chemical stability.
Besides, the settlement performance of T-4h and P25 were further studied. The digital images of P25 and T-4h suspensions in deionized water at pH 7.0 were taken at different sedimentation times, as shown in Fig. 11. P25 nanoparticles were well dispersed in water and settled very slowly. The supernatant was still very turbid after 24 h of sedimentation. The settling behavior of T-4h was distinctly different from that of P25. Most of the composites was settled in 4 h leaving a small fraction of T-4h suspended in the supernatant, which became clear after 24 h of sedimentation. This shows that T-4h is more conducive to the practical application of wastewater treatment than P25.
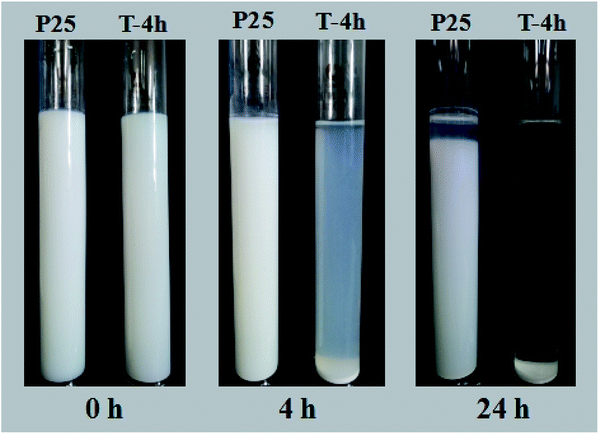 | ||
| Fig. 11 Photographs of P25 suspension and T-4h suspension in deionized water at pH 7.0 at different settling times. | ||
3.8. Photocatalysis mechanism
In general, hydroxyl radicals (·OH), superoxide radicals (·O2−) and holes (h+) can be found in the photocatalytic degradation process. For this reason, many scavengers, such as benzoquinone (BQ, ·O2−), tert-butyl alcohol (t-BuOH, ·OH), methanol (MT, h+) and so on, were introduced to carry out free radical trapping experiments.It can be seen from Fig. 12 that under simulated sunlight irradiation, the introduction of BQ drastically decreased photodegradation efficiency of TCH from 92.3 to 67.4%, suggesting that ·O2− played a key role in the photodegradation. When MT was added, the total degradation rate decreased by 5.65%, indicating that h+ was the secondary substance affecting the photocatalytic degradation. After adding t-BuOH, the photocatalytic degradation was almost not inhibited, and the total removal rate decreased by 2%, indicating that ·OH did not play a major role in the degradation. Based on the experimental results, the possible mechanism of outstanding photocatalytic activity of T-4h was proposed (Fig. 13). Firstly, the {001} facets of TiO2-{001/101} has a strong adsorption capacity for TCH.
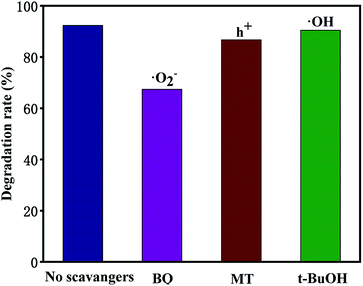 | ||
| Fig. 12 Effect of different scavengers on the degradation of TCH (10 mg L−1, 100 mL) efficiencies over T-4h. | ||
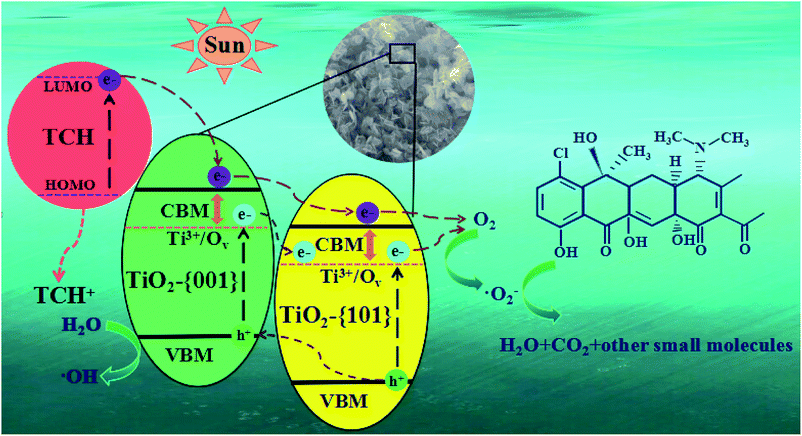 | ||
| Fig. 13 Schematic illustration of the photocatalytic mechanism for TCH removal over the T-4h photocatalyst. | ||
Furthermore, the π orbital of TCH may form electronic coupling with the 3d orbital of Ti4+, resulting in a surface complex between TCH and TiO2-{001/101}.67
TCH was degraded simultaneously in two pathways. In the first path, electrons are excited from the HOMO level of TCH to LUMO level under simulated sunlight, and then rapidly injected into the conduction band maximum (CBM) position of TiO2-{001} facets.39 However, TCH lost its electrons and remained a stable product (TCH+). Because the CBM of TiO2-{001} facets is more negative than that of TiO2-{101} facets. The electrons on CBM of TiO2-{001} facets can migrate to CBM of TiO2-{101} facets, and eventually react with O2 adsorbed on the TiO2-{101} facet to form ·O2− to oxidize TCH and TCH+.
In the second path, the doping of Ti3+/Ov can form new states at the bottom of the TiO2-{001/101} CBM. Under simulated sunlight irradiation, the {001} and {101} facets of TiO2 produce electron–hole pairs respectively. The CBM and Ti3+/Ov state potentials of TiO2-{001} facets are negative than that of TiO2-{101} facets, respectively, allowing the holes of TiO2-{101} CBM partly transfer to that of TiO2-{001} CBM, and the electrons in Ti3+/Ov states of TiO2-{001} facets transfer to the Ti3+/Ov states of TiO2-{101} facets.67 This process resulted in efficient space separation of photo-induced charge carriers to suppress recombination. Similar to the first pathway, electrons in the Ti3+/Ov states can interact with O2 to form ·O2− which can oxidize TCH and TCH+. The remaining holes can react with H2O to form ·OH and oxidize TCH with ·O2−.
4. Conclusions
In summary, coral-like TiOF2 can be synthesized by a one-step hydrothermal method, and with the extension of hydrothermal reaction time, cluster TiO2-{001/101} with the smaller size can be obtained. The prepared cluster TiO2-{001/101} exhibits excellent TCH degradation activity under simulated sunlight. The sensitization between TCH and cluster TiO2-{001/101} can induce strong visible light absorption. It is worth noting that the photocatalyst has good stability, repeatability, and sedimentation, which is very important in practical application. This work opens up a new way to explore the TiOF2 and provides a new idea for the degradation of TCH.Conflicts of interest
There is no conflict of interests exiting in the manuscript submission, and it is approved by all of the authors for publication. All the authors listed have approved the manuscript to be enclosed.Acknowledgements
This work was supported by Special Project for Performance Guidance of Scientific Research Institution in Chongqing (19237), Chongqing Special Financial Funds Project (19511), the Earmarked Fund for Modern Agro-industry Technology Research System (CARS-35) and Scientific Observation and Experiment Station of Livestock Equipment Engineering in Southwest, Ministry of Agriculture and Rural Affairs.References
- D. Wan, L. Wu, Y. Liu, J. Chen, H. Zhao and S. Xiao, Langmuir, 2019, 35, 3925–3936 CrossRef CAS.
- C. Lv, X. Lan, L. Wang, X. Dai, M. Zhang, J. Cui, S. Yuan, S. Wang and J. Shi, Environ. Technol., 2019, 11 Search PubMed.
- Q. Zhu, Y. Sun, F. Na, J. Wei, S. Xu, Y. Li and F. Guo, Appl. Catal., B, 2019, 254, 541–550 CrossRef CAS.
- W. Yang, Y. Han, C. Li, L. Zhu, L. Shi, W. Tang, J. Wang, T. Yue and Z. Li, Chem. Eng. J., 2019, 375, 122076 CrossRef CAS.
- J. Miao, F. Wang, Y. Chen, Y. Zhu, Y. Zhou and S. Zhang, Appl. Surf. Sci., 2019, 475, 549–558 CrossRef CAS.
- Y. Ma, H. Xiong, Z. Zhao, Y. Yu, D. Zhou and S. Dong, Chem. Eng. J., 2018, 351, 967–975 CrossRef CAS.
- H. Xiong, D. Zou, D. Zhou, S. Dong, J. Wang and B. E. Rittmann, Chem. Eng. J., 2017, 316, 7–14 CrossRef CAS.
- L. Feng, X. Li, X. Chen, Y. Huang, K. Peng, Y. Huang, Y. Yan and Y. Chen, Sci. Total Environ., 2020, 708, 135071 CrossRef CAS.
- X. Chen, X. Jiang, C. Yin, B. Zhang and Q. Zhang, J. Hazard. Mater., 2019, 367, 194–204 CrossRef CAS.
- H. Song, L. Yan, J. Jiang, J. Ma, S. Pang, X. Zhai, W. Zhang and D. Li, Chem. Eng. J., 2018, 344, 12–20 CrossRef CAS.
- G. Yang, D. Bao, D. Zhang, C. Wang, L. Qu and H. Li, Nanoscale Res. Lett., 2018, 13, 146 CrossRef.
- M. Liu, Y. Liu, D. Bao, G. Zhu, G. Yang, J. Geng and H. Li, Sci. Rep., 2017, 7, 43717 CrossRef.
- Y. Wang, L. Rao, P. Wang, Z. Shi and L. Zhang, Appl. Catal., B, 2020, 262, 118308 CrossRef CAS.
- C. Hou, J. Xie, H. Yang, S. Chen and H. Liu, RSC Adv., 2019, 9, 37911–37918 RSC.
- J. Xu, C. Liu, J. Niu and M. Chen, Sep. Purif. Technol., 2020, 230, 115861 CrossRef CAS.
- W. Li, Q. Chen, X. Lei and S. Gong, RSC Adv., 2019, 9, 5100–5109 RSC.
- Q. Zhang, J. Bai, G. Li and C. Li, J. Solid State Chem., 2019, 270, 129–134 CrossRef CAS.
- C. Hou, B. Hu and J. Zhu, Catalysts, 2018, 8, 575 CrossRef.
- Z. Yu, H. Moussa, B. Chouchene, M. Liu, R. Schneider, W. Wang, M. Moliere and H. Liao, Nanotechnology, 2019, 30, 045707 CrossRef CAS.
- S. Zhong, C. Lv, M. Shen, L. Wu and C. Li, J. Mater. Sci.: Mater. Electron., 2019, 30, 4152–4163 CrossRef CAS.
- V. Madhubala, A. Pugazhendhi and K. Thirunavukarasu, Process Biochem., 2019, 86, 186–195 CrossRef CAS.
- V. M. Ramakrishnan, N. Muthukumarasamy, P. Balraju, S. Pitchaiya, D. Velauthapillai and A. Pugazhendhi, Int. J. Hydrogen Energy, 2020, 45, 15441–15452 CrossRef.
- M. Srinivasan, M. Venkatesan, V. Arumugam, G. Natesan, N. Saravanan, S. Murugesan, S. Ramachandran, R. Ayyasamy and A. Pugazhendhi, Process Biochem., 2019, 80, 197–202 CrossRef CAS.
- Y. Wang, L. Rao, P. Wang, Z. Shi and L. Zhang, Appl. Catal., B, 2020, 262, 118308 CrossRef CAS.
- C. Hou and W. Liu, R. Soc. Open Sci., 2018, 5, 172005 CrossRef.
- X. Wei, H. Cai, Q. Feng, Z. Liu, D. Ma, K. Chen and Y. Huang, Mater. Lett., 2018, 228, 379–383 CrossRef CAS.
- M. Malakootian, N. Olama and A. Nasiri, Int. J. Environ. Sci. Technol., 2019, 16, 4275–4284 CrossRef CAS.
- D. Hariharan, P. Thangamuniyandi, A. J. Christy, R. Vasantharaja, P. Selvakumar, S. Sagadevan, A. Pugazhendhi and L. C. Nehru, J. Photochem. Photobiol., B, 2020, 202, 111636 CrossRef CAS.
- H. L. Shindume, Z. Zhao, N. Wang, H. Liu, A. Umar, J. Zhang, T. Wu and Z. Guo, J. Nanosci. Nanotechnol., 2019, 19, 839–849 CrossRef CAS.
- E. O. Oseghe and A. E. Ofomaja, J. Environ. Manage., 2018, 223, 860–867 CrossRef CAS.
- Y. Chen and K. Liu, Chem. Eng. J., 2016, 302, 682–696 CrossRef CAS.
- G. Guo, H. Guo, F. Wang, L. J. France, W. Yang, Z. Mei and Y. Yu, Green Energy Environ., 2020, 5, 114–120 CrossRef.
- J. J. Murcia, E. G. Avila-Martinez, H. Rojas, J. Cubillos, S. Ivanova, A. Penkova and O. H. Laguna, Nanomaterials, 2019, 9, 517 CrossRef CAS.
- V. M. Ramakrishnan, N. Muthukumarasamy, S. Pitchaiya, S. Agilan, A. Pugazhendhi and D. Velauthapillai, Int. J. Energy Res., 2020 DOI:10.1002/er.5806.
- G. Liu, G. Wang, Z. Hu, Y. Su and L. Zhao, Appl. Surf. Sci., 2019, 465, 902–910 CrossRef CAS.
- A. Bathla, R. A. Rather, T. Poonia and B. Pal, J. Nanosci. Nanotechnol., 2020, 20, 3123–3130 CrossRef CAS.
- X. Du, X. Bai, L. Xu, L. Yang and P. Jin, Chem. Eng. J., 2020, 384, 123245 CrossRef CAS.
- T. An, J. Chen, X. Nie, G. Li, H. Zhang, X. Liu and H. Zhao, ACS Appl. Mater. Interfaces, 2012, 4, 5988–5996 CrossRef CAS.
- S. Zhang, Z. Yin, L. Xie, J. Yi, W. Tang, T. Tang, J. Chen and S. Cao, Ceram. Int., 2020, 46, 8949–8957 CrossRef CAS.
- X. Zhang, Y. Chen, Q. Shang and Y. Guo, Sci. Total Environ., 2020, 716, 137144 CrossRef CAS.
- M. Sun, W. Kong, Y. Zhao, X. Liu, J. Xuan, Y. Liu, F. Jia, G. Yin, J. Wang and J. Zhang, Nanomaterials, 2019, 9, 1603 CrossRef CAS.
- X. Gao, J. Tao, X. Xiao and J. Nan, J. Photochem. Photobiol., A, 2018, 364, 202–207 CrossRef.
- A. Kumar, M. Khan, L. Fang and I. M. C. Lo, J. Hazard. Mater., 2019, 370, 108–116 CrossRef CAS.
- V. M. Ramakrishnan, N. Muthukumarasamy, S. Pitchaiya, S. Agilan, D. Velauthapillai and A. Pugazhendhi, Int. J. Energy Res., 2020 DOI:10.1002/er.5882.
- M. Bellardita, C. Garlisi, L. Y. Ozer, A. M. Venezia, J. Sa, F. Mamedov, L. Palmisano and G. Palmisano, Appl. Surf. Sci., 2020, 510, 145419 CrossRef CAS.
- B. G. Anitha and L. G. Devi, Chem. Phys. Lett., 2020, 742, 137138 CrossRef CAS.
- C. Zhang, L. Tian, L. Chen, X. Li, K. Lv and K. Deng, Chin. J. Catal., 2018, 39, 1373–1383 CrossRef CAS.
- H. Zhang, X. Liu, Y. B. Li, Y. Li and H. Zhao, Sci. China: Chem., 2012, 56, 402–417 CrossRef.
- X. Han, Q. Kuang, M. Jin, Z. Xie and L. Zheng, J. Am. Chem. Soc., 2009, 131, 3152–3153 CrossRef CAS.
- Y. Zheng, X. Hu and P. Yang, CrystEngComm, 2018, 20, 4485–4491 RSC.
- L. Wang, J. Liu, Y. Min and K. Zhang, Appl. Surf. Sci., 2019, 473, 738–745 CrossRef CAS.
- X.-Y. Sun, X. Zhang, X. Sun, N.-X. Qian, M. Wang and Y.-Q. Ma, Beilstein J. Nanotechnol., 2019, 10, 2116–2127 CrossRef CAS.
- Y. Lu, Y. Zang, H. Zhang, Y. Zhang, G. Wang and H. Zhao, Sci. Bull., 2016, 61, 1003–1012 CrossRef CAS.
- J. Chen, G. Li, H. Zhang, P. Liu, H. Zhao and T. An, Catal. Today, 2014, 224, 216–224 CrossRef CAS.
- M. Khalil, T. H. Rangkuti, F. Naumi, J. Gunlazuardi, T. A. Ivandini, G. T. M. Kadja and J. Y. Mulyana, Inorg. Chem. Commun., 2020, 118, 107992 CrossRef CAS.
- L.-Y. Zhang, J. You, Q.-W. Li, Z.-H. Dong, Y.-J. Zhong, Y.-L. Han and Y.-H. You, Coatings, 2020, 10, 27 CrossRef CAS.
- V. M. Ramakrishnan, N. Muthukumarasamy, P. Balraju, S. Pitchalya, D. Velauthapillai and A. Pugazhendhi, Int. J. Hydrogen Energy, 2020, 45, 15441–15452 CrossRef.
- Y. Zhang, M. Shang, Y. Mi, T. Xia, P. Wallenmeyer, J. Murowchick, L. Dong, Q. Zhang and X. Chen, ChemPlusChem, 2014, 79, 1159–1166 CrossRef CAS.
- C. Zhang, L. Tian, L. Chen, X. Li, K. Lv and K. Deng, Chin. J. Catal., 2018, 39, 1373–1383 CrossRef CAS.
- Y. Zhang, T. Xia, M. Shang, P. Wallenmeyer, D. Katelyn, A. Peterson, J. Murowchick, L. Dong and X. Chen, RSC Adv., 2014, 4, 16146–16152 RSC.
- Y. Zhang, Q. Zhang, T. Xia, D. Zhu, Y. Chen and X. Chen, ChemNanoMat, 2015, 1, 270–275 CrossRef CAS.
- T. Shi, Y. Duan, K. Lv, Z. Hu, Q. Li, M. Li and X. Li, Front. Chem., 2018, 6, 175 CrossRef.
- Z. Liu, X. Liu, Q. Lu, Q. Wang and Z. Ma, J. Taiwan Inst. Chem. Eng., 2019, 96, 214–222 CrossRef CAS.
- J. Wu, X. Ma, L. Xu, B. Zhao and F. Chen, Appl. Surf. Sci., 2019, 489, 510–518 CrossRef CAS.
- N. Hasan, G. H. Moon, J. Park and J. Kim, Sep. Purif. Technol., 2018, 203, 242–250 CrossRef CAS.
- S. Wu, H. Hu, Y. Lin, J. Zhang and Y. Hu, Chem. Eng. J., 2020, 382, 122842 CrossRef CAS.
- M. Khalil, T. H. Rangkuti, F. Naumi, J. Gunlazuardi, T. A. Ivandini, G. T. M. Kadja and J. Y. Mulyana, Inorg. Chem. Commun., 2020, 118, 107992 CrossRef CAS.
| This journal is © The Royal Society of Chemistry 2020 |

