 Open Access Article
Creative Commons Attribution 3.0 Unported Licence
The thermo-optic relevance of Ho3+ in fluoride microcrystals embedded in electrospun fibers
Yan Zhanga,
Zelin Gaoa,
Yue Lib,
Edwin Yue Bun Punb and
Hai Lin *ab
*ab
aSchool of Textile and Material Engineering, Dalian Polytechnic University, Dalian 116034, China. E-mail: lhai8686@yahoo.com
bDepartment of Electrical Engineering and State Key Laboratory of Terahertz and Millimeter Waves, City University of Hong Kong, Tat Chee Avenue, Kowloon, Hong Kong, China
First published on 11th November 2020
Abstract
Na(Y1−x−yHoxYby)F4/PAN (NYF-HY/PAN) composite fibers were synthesized using an electrospinning method, and the sub-micron crystals embedded in the fibers had complete hexagonal crystal structures. Under 977 nm laser excitation, strong green and red up-conversion (UC) emission that originated from flexible fibers were due to the radiative transitions (5F4, 5S2) → 5I8 and 5F5 → 5I8 of Ho3+, respectively. The effective green fluorescence emission (539 and 548 nm) can be applied to micro-domain non-contact temperature measurements, realizing rapid and dynamic temperature acquisition in a complex environment without destroying the temperature field. In the temperature range of 313–393 K, the absolute and relative sensitivity of the fibers are 0.00373 K−1 and 0.723% K−1, respectively, which indicates that the NYF-HY/PAN composite fibers have good thermal sensitivity. Composite fibers in which crystallites are embedded have superior properties, with great stability, high sensitivity, and excellent flexibility, providing a reliable reference for developing temperature-sensing materials for the biomedical field.
1. Introduction
It is generally known that temperature sensors play a crucial role in most applications, such as biology, agriculture, military and medicine.1,2 Recently, non-contact temperature measurement has received widespread attention because it is able to meet the requirements for use in dangerous applications such as strong electromagnetic, high voltage and non-contact environments.3–7 A suitable choice for non-contact temperature measurement is the temperature measurement feedback method based on the fluorescence intensity ratio (FIR), which avoids spectral loss and excitation source fluctuation, and its sensitivity and accuracy are higher than traditional ways of measuring temperature.8–15 Rare Earth (RE) ion doped materials are widely applied in non-contact temperature control measurement because their thermal coupling energy levels respond to changes in laser power and temperature.16–23 By measuring the fluorescence intensity ratio of the thermal coupling energy levels of the RE doped materials, the temperature changes around the fluorescent probe can be monitored.24–31 Therefore, RE ion doped temperature sensing materials are considered to be a very promising for temperature detection materials.32–40Among the trivalent RE ions, Ho3+ has plentiful energy levels and obvious luminescence characteristics in the visible light region,41,42 and it has the ability to obtain intense optical light by the sensitization of other RE ions.43–45 Meanwhile, the use of Ho3+ as a potential candidate for temperature sensing has been confirmed in RE, and thermal-coupled levels of Ho3+ ions, 5F4 and 5S2, 5S2 and 5F5, 5F3 and 3K8, and 5F2,3/3K8 and 5G6/5F1 have all been investigated in temperature measurement applications.44–48 When Yb3+ is introduced, the effective luminescence originated by the previously mentioned thermal-coupled energy levels of Ho3+ can be applied for temperature sensing.49,50 Among the numerous forms of matrix materials, powder, single crystals, and glass have the disadvantages of requiring molding materials and having a constant shape when used as temperature sensing materials. Therefore, flexible materials for microdomain complexity thermal reaction could be adopted. Flexibility is a characteristic of polymer materials,51 however its rich hydroxyl structure is fatal to fluorescence emission from thermally coupled energy levels. Fortunately, composite fibers of organic–inorganic combination can perfectly solve this defect, and realize effective fluorescence emission for thermal reaction measurement.
In the present study, a series of Ho3+/Yb3+ co-doped NaYF4/PAN composite fibers were prepared by an electrospinning technique. It is confirmed that the microcrystals (MCs) of the hexagonal stable crystal phase are intact in the fibers and have complete crystalline functions. The UC performance of the samples is explored in detail, and the influence of Yb3+ concentration co-doping on its UC performance is investigated and the energy transfer processes between Ho3+ and Yb3+ ions are determined. Furthermore, the green UC emission intensity ratio from thermal correlation levels 5F4 and 5S2 is studied by a FIR technique, which is a function of temperature in the range of 313–393 K. It is found that the flexible fibers have great thermal sensitivity, which indicates that the NYF-HY/PAN fiber has prospects for a broad application in the field of temperature sensors.
2. Experimental
2.1 Materials and methods
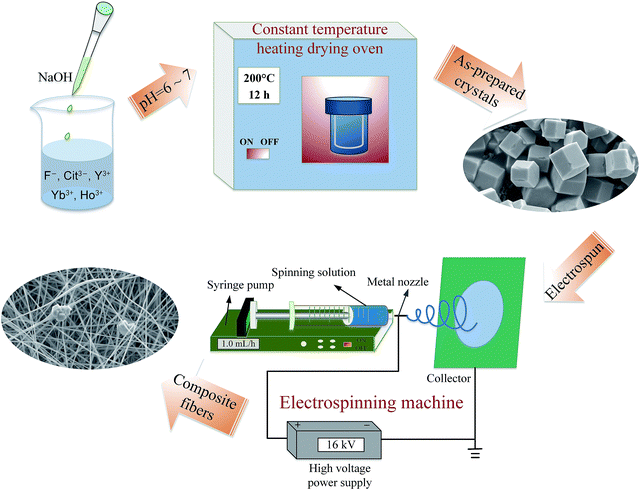
![[thin space (1/6-em)]](https://www.rsc.org/images/entities/char_2009.gif) 000) was slowly added into the solution with stirring for overnight to obtain a viscous spinning solution. The electrospinning instrument mainly includes a high voltage power supply, a collection device, a syringe pump and a syringe equipped with a metal nozzle, as shown in the electrospinning process illustrated in Fig. 1. In the electrospinning, the spinning sol was sprayed at a speed of 1.0 mL h−1 under a voltage of 16 kV. The distance between the tip of spinneret and the collector of aluminum foil was about 18 cm. A diagram of the process is shown in Fig. 1.
000) was slowly added into the solution with stirring for overnight to obtain a viscous spinning solution. The electrospinning instrument mainly includes a high voltage power supply, a collection device, a syringe pump and a syringe equipped with a metal nozzle, as shown in the electrospinning process illustrated in Fig. 1. In the electrospinning, the spinning sol was sprayed at a speed of 1.0 mL h−1 under a voltage of 16 kV. The distance between the tip of spinneret and the collector of aluminum foil was about 18 cm. A diagram of the process is shown in Fig. 1.
2.2 Characterization techniques
The crystal structure of the Yb3+/Ho3+ co-doped NaYF4 MCs was confirmed by X-ray diffraction (XRD) using a Shimadzu XRD-7000 diffractometer with Cu-Kα radiation operated at 40 kV and 30 mA. The morphology and the composition element analysis of the synthesized MCs and fibers were determined by using a Jeol JSM-7800F field-emission scanning electron microscope (SEM) and energy dispersive spectroscopy (EDS), respectively. The visible fluorescence spectra were captured on a Hitachi F-7000 fluorescence spectrophotometer using a 977 nm laser as the pumping source. When measuring the fluorescence, the excitation slit of the MCs was 1 nm, and the excitation slit of the composite fibers was 5 nm. The temperature-dependent UC luminescent spectra were measured with a Hitachi F-4600 fluorescence spectrofluorometer equipped with a 980 nm laser.3. Results and discussion
3.1 Structural and morphological analysis
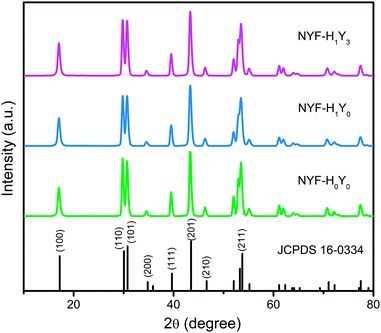
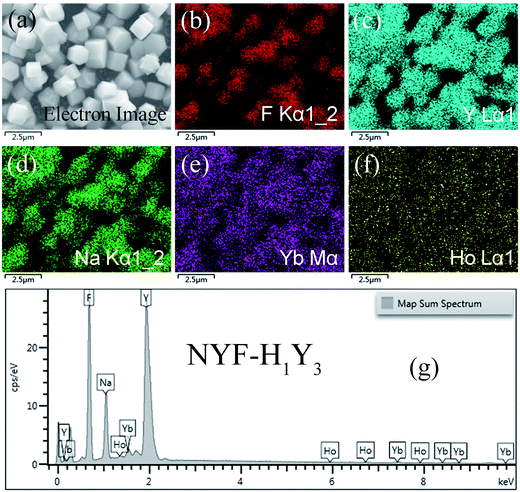
The phase of the MCs was determined by XRD, as shown in Fig. 2. The data reported in JCPDS card no. 16–0334 (standard pattern of hexagonal NaYF4) and displayed in Fig. 2 (bottom part) was used to make a comparison with the XRD data of the prepared sample. It was seen that the diffraction peaks were sharp and clear indicating that the MCs were highly crystalline, and the diffraction peak of the MCs matched the NaYF4 standard card very well (space group F63m), demonstrating that the crystal structure and crystallinity after introducing Ho3+ and Yb3+/Ho3+ ions had not obviously changed. Fig. 3(a–f) show the elemental mapping spectra of the MCs, in which the elements of F, Ho, Na, Y, and Yb were clearly detectable and uniformly distributed. Furthermore, as shown in Fig. 3(g), in the representative EDS spectra of the corresponding region of Fig. 3(a), the F, Ho, Na, Y, and Yb peaks appeared. These results were consistent with the XRD results, indicating that Ho3+/Yb3+ co-doped NaYF4 MCs were successfully prepared by the hydrothermal method.As shown in Fig. 4, the morphologies of the MCs and nanofibers obtained were observed with SEM. Fig. 4(a) shows the morphological structure of the MCs as a hexagonal prism with a length and diameter of about 1 μm. Meanwhile, the size distributions of the MCs were counted, and the histogram of the particle size distribution is shown in the inset of Fig. 4(a). Moreover, a small number of crystals formed a mosaic structure, which might be because of the fact that twin crystals were connected to each other in order to reduce the surface energy in the process of crystal growth. Furthermore, Fig. 4(b–d) show the micrographs of the composite fibers at different magnifications, in which, fibers with a diameter of 300–500 nm and a smooth surface were arranged at random and overlapped with each other, in addition, several MCs were piled together to form a string of 3–4 μm beads and penetrated the fibers. The, crystals dispersed in the fibers had a larger surface area compared with the agglomerated MCs and the increased exposure area contributed to the full absorption of the infrared radiation.
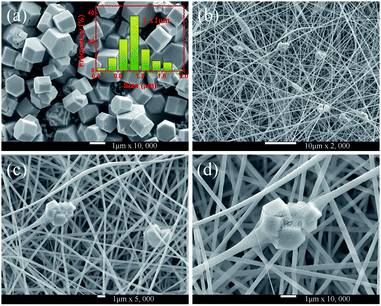 | ||
| Fig. 4 (a) SEM micrographs of NYF-H1Y3 MCs; the inset shows the corresponding size distribution. (b–d) SEM micrographs of NYF-H1Y3/PAN composite fibers at different magnifications. | ||
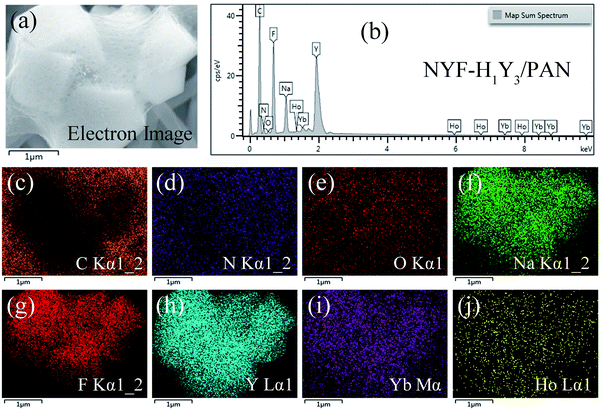
The composition element analysis of the NYF-H1Y3/PAN composite fibers was also carried out by EDS and the results are shown in Fig. 5. In the scanning area, a uniform distribution of the C, N and O elements derived from the polymer PAN and the solvent DMF can be found in the composite fibers. Furthermore, the distribution of F, Na, and Y elements was characterized by overall uniformity and local aggregation. The distribution of the Y element represented the location of Ho and Yb because of the integrity of the MC structure, therefore the distribution of Ho and Yb elements was in the same location as Y. The previous results were consistent with the results of the SEM analysis of the composite fibers, which proved that the hydrothermally synthesized MCs had been doped into the PAN fibers, and the composite fibers embedded with MCs had been prepared by electrospinning.
3.2 The UC luminescence properties of MCs and fibers
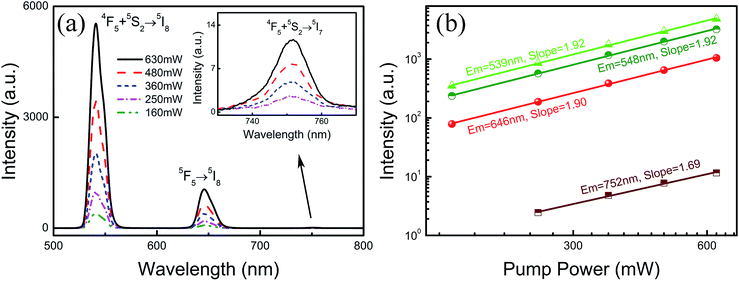
To investigate the effect of doping concentration on the UC emission fluorescence of the samples, the emission spectra of the MCs and composite fibers with different doping concentrations of Ho3+/Yb3+ were examined under the excitation of a 977 nm laser with 630 mW power, as shown in Fig. 6. The UC spectra of the MCs and composite fibers showed the same trends for the changes of the spectra. Under 977 nm excitation, a green emission band at 541 nm and two red emission bands at 646 and 752 nm were observed, which were attributed to (5F4, 5S2) → 5I8, 5F5 → 5I8, and (5F4, 5S2) → 5I7 transitions of Ho3+ ions, respectively. In addition, the co-doped concentration of Ho3+/Yb3+ ions has a great influence on the UC emission intensity, when the Yb3+ content is null (NYF–H1Y0 and NYF-H1Y0/PAN), and the photon energy of the 977 nm laser cannot effectively excite the Ho3+ ions, resulting in weak UC luminescence intensity. As the Yb3+ content increases, the intensity of each emission center increases significantly, and the bright UC luminescence can be observed, which demonstrated that there was an effective energy transfer between the Yb3+ and Ho3+ ions.In order to investigate the frequency conversion emission of NYF-H1Y3/PAN flexible fibers, the dependence of the UC spectra on the pump power was determined, and the results are shown in Fig. 7(a), which demonstrated that the green and red UC emissions of Ho3+ could be effectively excited by 977 nm lasers. To further explain the UC multi-photon excitation mechanism of the composite fibers, the excitation power dependence of the green and red UC emission fluorescence is shown in Fig. 7(b). It is well known that UC emission intensity (I) relies on the pump power (P), which follows I ∝ Pa, where a is the number of pump photons participating in the UC process.52–54 Using linear fitting, the a values of the emission peaks at 539, 548, 646 and 752 nm were 1.92, 1.92, 1.90 and 1.69, respectively, which indicated their participation in the two-photon process.
The energy transfer mechanism of the NYF-HY/PAN composite fibers is shown in Fig. 8. First and foremost, under the excitation of 977 nm, the Ho3+ ions in the ground state 5I8 level are used to fill the excited state 5I6 level by energy transfer (ET) from the adjacent Yb3+ ions in excited state 2F5/2 energy level. Some Ho3+ ions at the 5I6 level relaxed to the excited state 5I7 by non-radiative relaxation processes (NRP). Subsequently, the excited state of Ho3+ further absorbed energy to the 5F4 and 5F5 levels by excited state absorption (ESA) or ET processes, and then returned to the ground state to form 539 and 646 nm emission, respectively. Meanwhile, a part of Ho3+ at the 5F4 level by NRP relaxed to 5S2 and 5F5, and then transited to the ground state, producing emission bands of 548 and 646 nm. Therefore, there were two transition pathways for the red emission at 646 nm. In addition, the transition from the 5F4/5S2 energy level to the 5I7 energy level produced an emission band of 752 nm. Hence, the emission bands of the composite fibers are both two-photon processes, which was consistent with the dependence of the UC luminescence spectrum on pump power.
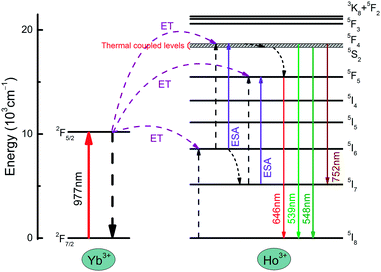 | ||
| Fig. 8 A schematic energy level diagram of the luminescence mechanism of NYF-HY/PAN fibers under laser excitation at 977 nm. | ||
3.3 Optical thermosensitive properties of MCs and fibers
The green UC spectra of NYF-H1Y3 MCs and NYF-H1Y3/PAN composite fibers were excited by a 980 nm laser with a power of 400 mW at different temperatures, as shown in Fig. 9. With the increase of temperature, whether it is MCs or fibers, the peak positions of the green UC emission at 539 and 548 nm had not changed, but their UC intensities and FIR value had changed. The thermally coupled 5F4 and 5S2 energy levels of Ho3+ were near to each other, and their overall distribution agrees with the Boltzmann distribution law.55 The FIR of the green UC emission at 539 and 548 nm can be expressed as:56,57
 | (1) |
 | ||
| Fig. 9 The UC spectra of (a) NYF-H1Y3 MCs and (b) NYF-H1Y3/PAN fibers at 980 nm excitation with 400 mW power from 313 to 393 K. | ||
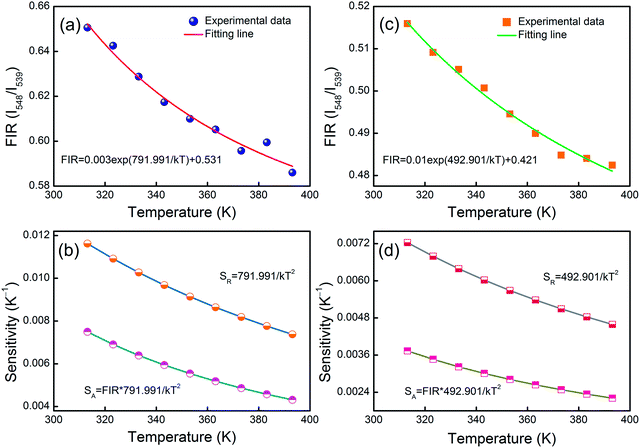
Fitting the experimental data with eqn (1), A1 = 0.003, B1 = 0.531, ΔE1 = 791.991 for the MCs,A2 = 0.010, B2 = 0.421 and ΔE2 = 492.901 for the composite fibers, were obtained. The FIR of the green UC emission at 539 and 548 nm of the MCs and composite fibers versus temperature in the range of 313–393 K are shown in Fig. 10(a) and (c). Additionally, the absolute sensitivity SA and relative sensitivity SR are important evaluation criteria for optical thermometry applications, which can be calculated as:
 | (2) |
 | (3) |
The sensitivity curves of the MCs and composite fibers are shown in Fig. 10(b) and (d), respectively. It can be clearly seen that the sensitivity curves of the MCs and composite fibers have the same trend, that is, the SA and SR of the MCs and composite fibers decreases with the increase of temperature in the temperature range of 313–393 K. At 313 K, the SA values of the MCs and composite fibers reached 0.0075 K−1 and 0.00373 K−1, respectively, and correspondingly, the SR values reached 1.162% K−1 and 0.723% K−1. For comparison, the maximum sensitivity SA and SR of some temperature sensor materials based on doped Ho3+ at different temperature ranges (ΔT) and diverse excitation wavelengths (λex) are listed in Table 1, and the sensitivity error (ΔS) of the composite fibers is also shown in the table. Compared with other Ho3+ doping temperature sensing materials, the Ho3+/Yb3+ co-doped materials had an intense UC fluorescence emission and great temperature sensing performance under the 980 nm excitation, which was due to the fact that the energy levels of Yb3+ and Ho3+ matched better to facilitate the energy transfer. In this work, NYF-H1Y3/PAN composite fibers had high sensitivity at low temperatures, and more importantly, its external shape and color were almost unchanged at the measurement temperature, which indicated that flexible composite fibers had potential prospects for applications in biological temperature measurement.
| Research object | Transitions | λex | ΔT (K) | SA (K−1) | ΔS (10−3 K−1) | SR (% K−1) | Reference |
|---|---|---|---|---|---|---|---|
| Y2Ti2O7:Yb, Ho | 5F4/5S2, 5F5 → 5I8 | 980 nm | 423–693 | 0.0018 | — | 1328.17/T2 | 58 |
| LaNbO4:Nd, Yb, Ho | 5F4/5S2, 5F5 → 5I8 | 808 nm | 303–693 | 0.00204 | — | — | 26 |
| Y2O3:Zn, Yb, Ho | 5F3, 3K8 → 5I8 | 980 nm | 299–673 | 0.00302 | — | 1067.76/T2 | 59 |
| In–Zn–Sr–Ba:Ho | 5F4/5S2 → 5I8, 5I7 | 473 nm | 20–300 | 0.0036 | — | — | 60 |
| NaYF4:Yb, Ho/PAN | 5F4, 5S2 → 5I8 | 980 nm | 313–393 | 0.00373 | 0.0123 | 0.723 | This work |
| Y2O3:Ge, Yb, Ho | 5F4/5S2, 5F5 → 5I8 | 976 nm | 300–400 | 0.0052 | — | 0.62 | 8 |
| ZnWO4:Yb, Ho | 5F4/5S2 → 5I8, 5I7 | 980 nm | 83–503 | 0.0064 | — | — | 10 |
| NaYF4:Nd, Ho | 5F4/5S2, 5F5 → 5I8 | 808 nm | 308–473 | — | — | 0.90 | 42 |
4. Conclusions
In summary, NYF-HY MCs and NYF-HY/PAN composite fibers were prepared via hydrothermal synthesis and electrospinning, respectively. It is confirmed that the hexagonal structure and thermally reactive functionality of the embedded crystals in the fibers are preserved. The green fluorescence emission from thermal correlation levels 5F4 and 5S2 of Ho3+ was verified, and the fluctuation of the green emission intensity ratio was studied as a function of temperature in the range of 313–393 K. Moreover, the thermosensitive sensing behavior of NYF-HY/PAN flexible fibers is investigated via the FIR technique, and the maximum absolute and relative sensitivity values for the present materials are 0.00373 K−1 at 313 K and 0.723% K−1 at 313 K, respectively. The NYF-HY/PAN composite fibers with the excellent properties of flexibility, sensitivity, and stability can be adopted as sensing materials for biological temperature measurements.Author contributions
Yan Zhang carried out the experiments, fabricated the temperature sensing materials, and wrote the manuscript. Zelin Gao and Yue Li helped to rewrite the manuscript during the revision process. Hai Lin and Edwin Yue Bun Pun provided guidance and supervision. All the authors have read and approved the final manuscript.Conflicts of interest
There are no conflicts to declare.Acknowledgements
The research work was supported by the Scientific Research Funding Project from the Educational Department of Liaoning Province, China (Grant No. J2020047) and the Research Grants Council of the Hong Kong Special Administrative Region, China (Grant No. CityU 11219819).References
- M. Xu, X.-M. Zou, Q.-Q. Su, W. Yuan, C. Cao, Q.-H. Wang, X.-J. Zhu, W. Feng and F.-Y. Li, Nat. Commun., 2018, 9, 2698 CrossRef.
- E. J. Mclaurin, L. R. Bradshaw and D. R. Gamelin, Chem. Mater., 2013, 25, 1283–1292 CrossRef CAS.
- I. E. Kolesnikov, D. V. Mamonova, A. A. Kalinichev, M. A. Kurochkin, V. A. Medvedev, E. Y. Kolesnikov, E. Lahderanta and A. A. Manshina, Nanoscale, 2020, 12, 5953–5960 RSC.
- R. Shi, L.-T. Lin, P. Dorenbos and H.-B. Liang, J. Mater. Chem. C, 2017, 5, 10737–10745 RSC.
- P. Wang, J.-S. Mao, L. Zhao, B. Jiang, C.-Y. Xie, Y. Lin, F.-F. Chi, M. Yin and Y.-H. Chen, Dalton Trans., 2019, 48, 10062–10069 RSC.
- D. Wawrzynczyk, A. Bednarkiewicz, M. Nyk, W. Strekb and M. Samoc, Nanoscale, 2012, 4, 6959–6961 RSC.
- T. Chihara, M. Umezawa, K. Miyata, S. Sekiyama, N. Hosokawa, K. Okubo, M. Kamimura and K. Soga, Sci. Rep., 2019, 9, 12806 CrossRef.
- K. Vineet, Z. Brandon, A. M. Paul and G.-F. Wang, Dalton Trans., 2018, 47, 11158–11165 RSC.
- G.-F. Liu, Y.-Q. Chen, M.-C. Jia, Z. Sun, B.-B. Ding, S. Shao, F. Jiang, Z.-L. Fu, P.-A. Ma and J. Lin, Dalton Trans., 2019, 48, 10537 RSC.
- M. Xu, D.-Q. Chen, P. Huang, Z.-Y. Wan, Y. Zhou and Z.-G. Ji, J. Mater. Chem. C, 2016, 4, 6516–6524 RSC.
- X.-N. Chai, J. Li, X.-S. Wang, Y.-X. Li and X. Yao, RSC Adv., 2017, 7, 40046–40052 RSC.
- J.-Q. Liu, Y.-Y. Zhao, X.-L. Li, J.-B. Wu, Y.-D. Han, X. Zhang and Y. Xu, Cryst. Growth Des., 2020, 20, 454–459 CrossRef CAS.
- M.-C. Jia, G.-F. Liu, Z. Sun, Z.-L. Fu and W.-G. Xu, Inorg. Chem., 2018, 57, 1213–1219 CrossRef CAS.
- J. Zhang and C. Jin, Ind. Eng. Chem. Res., 2019, 58, 3490–3498 CrossRef CAS.
- Q.-Y. Shao, Z.-C. Yang, G.-T. Zhang, Y.-Q. Hu, Y. Dong and J.-Q. Jiang, ACS Omega, 2018, 3, 188–197 CrossRef CAS.
- M. A. Antoniak, S. J. Zelewski, R. Oliva, A. Żak, R. Kudrawiec and M. Nyk, ACS Appl. Nano Mater., 2020, 3, 4209–4217 CrossRef CAS.
- A.-H. Zhou, F. Song, Y.-D. Han, F.-F. Song, D.-D. Ju and X.-Q. Wang, CrystEngComm, 2018, 20, 2029–2035 RSC.
- M. Runowski, S. Goderski, D. Przybylska, T. Grzyb, S. Lis and I. R. Martín, ACS Appl. Nano Mater., 2020, 3, 6406–6415 CrossRef CAS.
- J.-F. Feng, T.-F. Liu, J.-L. Shi, S.-Y. Gao and R. Cao, ACS Appl. Mater. Interfaces, 2018, 10, 20854–20861 CrossRef CAS.
- J. Zhou, Y.-Q. Chen, R.-S. Lei, H.-P. Wang, Q.-G. Zhu, X.-M. Wang, Y.-Q. Wu, Q.-H. Yang and S.-Q. Xu, Ceram. Int., 2019, 45, 7696–7702 CrossRef CAS.
- P. Mahata, S. K. Mondal, D. K. Singha and P. Majee, Dalton Trans., 2016, 46, 301–328 RSC.
- I. Mikalauskaite, G. Pleckaityte, M. Skapas, A. Zarkov, A. Katelnikovas and A. Beganskiene, J. Lumin., 2019, 213, 210–217 CrossRef CAS.
- Z. Liu, H. Deng and D. Chen, Ceram. Int., 2019, 45, 13235–13241 CrossRef CAS.
- W. Liu, G.-H. Pan, Z.-D. Hao, L.-L. Zhang, X. Zhang, Y.-S. Luo, H.-F. Zhao, H.-J. Wu and J.-H. Zhang, Phys. Chem. Chem. Phys., 2018, 20, 14461–14468 RSC.
- M. Runowski, N. Stopikowska, D. Szeremeta, S. Goderski, M. Skwierczyńska and S. Lis, ACS Appl. Mater. Interfaces, 2019, 14, 13389–13396 CrossRef.
- C.-X. Sheng, X.-P. Li, Y. Tian, X. Wang, S. Xu, H.-Q. Yu, Y.-Z. Cao and B.-J. Chen, Spectrochim. Acta, 2020, 118846 Search PubMed.
- B. Klimesz, R. Lisiecki and W. Ryba-Romanowski, J. Alloys Compd., 2020, 823, 153753 CrossRef CAS.
- Y. Gao, F. Huang, H. Lin, J. Xu and Y.-S. Wang, Sens. Actuators, B, 2017, 423, 137–143 CrossRef.
- T. Fu, X.-S. Wang, H.-H. Ye, Y.-X. X. Li and X. Yao, J. Electron. Mater., 2020, 49, 5047–5052 CrossRef CAS.
- J.-J. Cai, L.-Z. hao, F.-F. Hu, X.-T. Wei, Y.-H. Chen, M. Yin and C.-K. Duan, Inorg. Chem., 2017, 56, 4039–4046 CrossRef CAS.
- B.-F. Lei, W. Li, H.-R. Zhang, J. Wang, Y.-L. Liu, J.-L. Zhuang and S. Chen, RSC Adv., 2015, 5, 89238–89243 RSC.
- L.-L. Ma, Y.-L. Zhou, Z.-W.-B. Zhang, Y.-Q. Liu, D. Zhai, H. Zhuang, Q. Li, J.-D. Yuye, C.-T. Wu and J. Chang, Sci. Adv., 2020, 6, 1311 CrossRef.
- X.-F. Liu and J.-R. Qiu, Chem. Soc. Rev., 2015, 44, 8714–8746 RSC.
- W. Tang, H.-Y. Ni, Q.-H. Zhang and J.-H. Ding, RSC Adv., 2018, 8, 23996–24001 RSC.
- M. Mondal and V. K. Rai, J. Ind. Eng. Chem., 2018, 60, 125–132 CrossRef CAS.
- Q.-Y. Meng, L. Chen, S.-Q. Zhang, L.-H. Huang, R.-S. Lei, S.-L. Zhao and S.-Q. Xu, J. Lumin., 2019, 216, 116727 CrossRef CAS.
- S.-S. Du, D.-Y. Wang, Q.-P. Qiang, X.-L. Ma, Z.-B. Tang and Y.-H. Wang, J. Mater. Chem. C, 2016, 4, 7148–7155 RSC.
- D. Baziulyte-Paulaviciene, N. Traskina, R. Vargalisa, A. Katelnikovas and S. Sakirzanovas, J. Lumin., 2019, 215, 116672 CrossRef CAS.
- Q.-H. Yang, L. Zhao, Z.-H. Fang, Z. Yang, J.-Y. Cao, Y.-Y. Cai, D.-C. Zhou, X. Yua, J.-B. Qiu and X.-H. Xu, J. Rare Earths, 2020 Search PubMed.
- J. Zhang and F.-S. Qian, Dalton Trans., 2020, 49, 10949–11095 RSC.
- K. Li and R. V. Deun, Inorg. Chem., 2019, 58, 6821–6831 CrossRef CAS.
- L. Liu, D. Y. Tang, L. Xu, F. Khan, I. U. Din, Z. Wang, P. F. Li, H. Y. Lia, E. M. Zhao and Y. Zhang, J. Lumin., 2019, 213, 40–45 CrossRef CAS.
- W.-Q. Cao, F.-F. Huang, T. Wang, R.-G. Ye, R.-S. Lei, Y. Tian, J.-J. Zhang and S.-Q. Xu, Opt. Mater., 2018, 75, 695–698 CrossRef CAS.
- N. An, H.-L. Zhou, K.-S. Zhu, L.-H. Ye, J.-R. Qiu and L.-G. Wang, J. Alloys Compd., 2020, 156057 CrossRef CAS.
- Q.-P. Qiang and Y.-H. Wang, New J. Chem., 2019, 43, 5011–5019 RSC.
- A. K. Singh and S. B. Rai, Appl. Phys. B, 2007, 86, 661–666 CrossRef CAS.
- X.-F. Wang, Q. Liu, Y.-Y. Bu, C.-S. Liu, T. Liu and X.-H. Yan, RSC Adv., 2015, 5, 86219 RSC.
- V. Kumar, S. Som, S. Dutta, S. Das and H. C. Swart, RSC Adv., 2016, 6, 84914–84925 RSC.
- L.-L. Wang, M. Lan, Z.-Y. Liu, G.-S. Qin, C.-F. Wu, X. Wang, W.-P. Qin, W. Huang and L. Huang, J. Mater. Chem. C, 2013, 1, 2485–2490 RSC.
- W. Li, J. Xu, Q. He, Y. Sun, S. Sun, W. Chen, M. Guzik, G. Boulon and L.-L. Hu, J. Alloys Compd., 2020, 155820 CrossRef CAS.
- Z.-M. Yu, L.-F. Shen, D.-S. Li, E. Y. B. Pun, J. Guo and H. Lin, J. Alloy. Compd., 2019, 786, 1040–1050 CrossRef CAS.
- C. S. Lim, A. S. Aleksandrovsky, M. S. Molokeev, A. Oreshonkov and V. Atuchin, Phys. Chem. Chem. Phys., 2015, 17, 19278–19287 RSC.
- V. Lojpur, M. Nikolic, L. Mancic, O. Milosevic and M. D. Dramicanin, Ceram. Int., 2013, 39, 1129–1134 CrossRef CAS.
- K. Li and R. V. Deun, Phys. Chem. Chem. Phys., 2019, 21, 4746 RSC.
- J. Zhang, X.-M. Jiang and Z.-H. Hua, Ind. Eng. Chem. Res., 2018, 57, 7507–7515 CrossRef CAS.
- M. K. Mahata, T. Koppe, K. Kumar, H. Hofsäss and U. Vetter, Sci. Rep., 2020, 10, 8775 CrossRef CAS.
- N. Jain, R. K. Singh, B. P. Singh, A. Srivastava, R. A. Singh and J. Singh, ACS Omega, 2019, 4, 7482–7491 CrossRef CAS.
- E.-K. Hu, P.-J. Lin, E.-Y.-B. Pun, J.-L. Yuan, H. Lin and X. Zhao, J. Electrochem. Soc., 2020, 167, 027510 CrossRef CAS.
- A. Pandey and V. K Rai, Dalton Trans., 2013, 42, 11005–11011 RSC.
- P. Haro-González, S. F. León-Luis, S. González-Pérez and I. R. Martín, Mater. Res. Bull., 2011, 46, 1051–1054 CrossRef.
| This journal is © The Royal Society of Chemistry 2020 |

