 Open Access Article
Creative Commons Attribution 3.0 Unported Licence
Correction and removal of expression of concern: A study on the luminescence properties of gamma-ray-irradiated white light emitting Ca2Al2SiO7:Dy3+ phosphors fabricated using a combustion-assisted method
Geetanjali Tiwari*a,
Nameeta Brahme*a,
Ravi Sharmab,
D. P. Bisena,
Sanjay K. Saoa and
S. J. Dhoblec
aSchool of Studies in Physics and Astrophysics, Pt. Ravishankar Shukla University, Raipur, C. G., India. E-mail: geetanjali.tiwari10@gmail.com; namitabrahme@gmail.com
bDepartment of Physics, Govt. Arts and Commerce Girls College, Devendra Nagar, Raipur, C. G., India
cDepartment of Physics, RTM University Nagpur, Maharashtra, India
First published on 3rd February 2020
Abstract
Correction and removal of expression of concern for ‘A study on the luminescence properties of gamma-ray-irradiated white light emitting Ca2Al2SiO7:Dy3+ phosphors fabricated using a combustion-assisted method’ by Geetanjali Tiwari et al., RSC Adv., 2016, 6, 49317–49327.
The authors wish to draw the reader’s attention to their closely related paper in Optical Materials,1 which was undergoing peer review at the same time as this RSC Advances paper. Ref. 1 was published shortly after this paper but should have been cited in this RSC Advances article.
The authors regret that the results in some of the figures and the conclusion part in the original manuscript were not correct. The corrected Fig. 10(a, b), 11(a, b), 12(a, b), 15, 18 and 19 are given below. In addition, the authors have recalculated the activation energy using a peak shape method, corrected Table 2 and corrected part of the conclusion section. These corrections do not affect the original conclusions of this paper.
The accuracy and integrity of the new data has been confirmed by the affiliated institution (Pt. Ravishankar Shukla University, India). Their enquiry concluded that “the data and figures provided by the corresponding authors in the correction notice are accurate representations of the experiments. The corrected figures, calculation of activation energy by peak shape method and the correction conclusion part do not affect the original conclusions of this paper. According to the above conclusions, the data and figures provided in this correction notice maintain the accuracy and integrity of the experiments.”
The new data and figures have also been reviewed by an independent expert and are provided below in order to fulfil the journal’s responsibility to correct the scientific record, in accordance with the guidelines provided by the Committee on Publication Ethics.
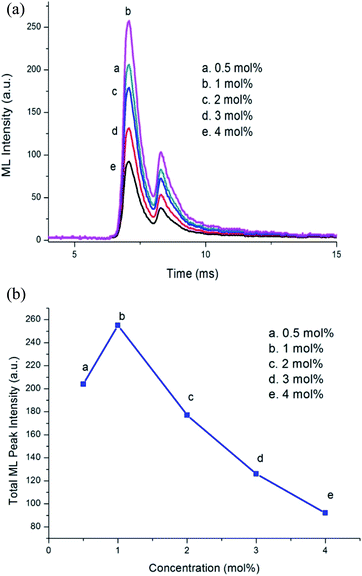 | ||
| Fig. 1 (a) ML intensity versus time curve for different Dy3+ concentrations. (b) Variation in ML peak intensity with Dy3+ concentration variation. | ||
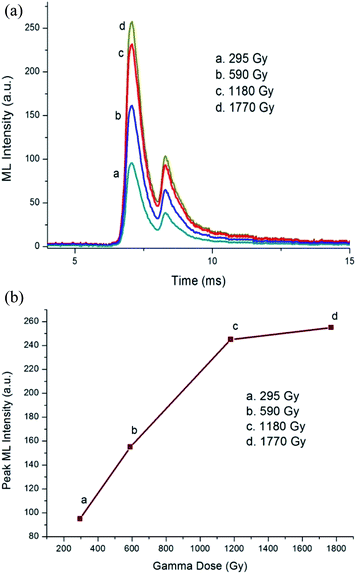 | ||
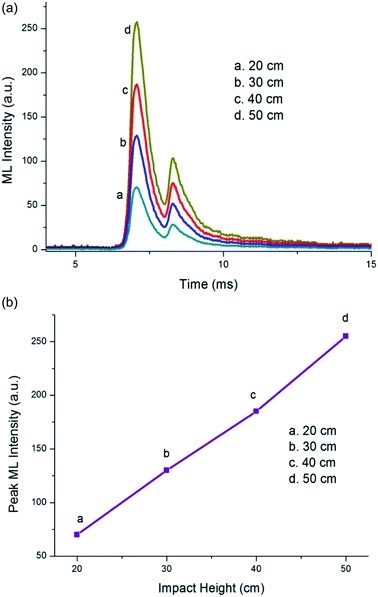
| Fig. 2 (a) ML intensity versus time curve for the γ-irradiated Ca1.99Al2SiO7:0.01Dy3+ phosphor. (b) Dependence of peak ML intensity on the γ-dose for the Ca1.99Al2SiO7:0.01Dy3+ phosphor. | ||
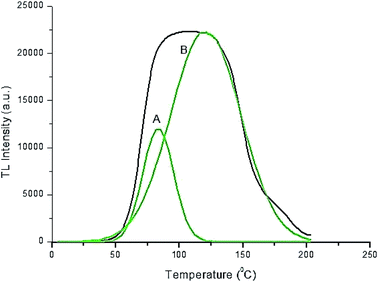 | ||
| Fig. 4 Peak deconvolution of TL glow curve of the Ca1.99Al2SiO7:0.01Dy3+ phosphor for a 1180 Gy γ-dose. | ||
The following portions of text concerning the discussion of Fig. 15, 18 and 19 have been updated to reflect the corrected figures.
Page 49324 (left column), paragraph 3: “The peak deconvolution of the TL curve is shown in Fig. 15. It has two dominant bands peaking at approximately 83.7 °C and 120.7 °C.”
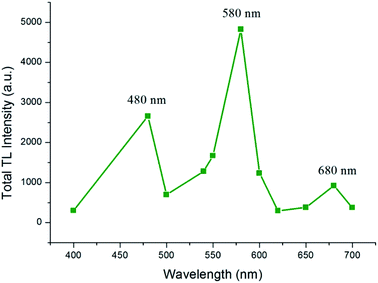
Page 49325 (left column), paragraph 2: “Fig. 18 shows that the TL emission spectra of the Ca2Al2SiO7:Dy3+ phosphor exhibits a broad emission band centered on 480 (blue), 580 (yellow), and 680 (red)…”
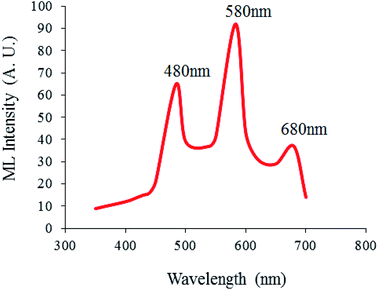
Page 49325 (left column), paragraph 3: “Fig. 19 shows that the ML emission spectra of Ca2Al2SiO7:Dy3+ exhibits broad emission bands centered on 480 (blue), 580 (yellow) and 680 (red)…”
In the original article, the authors used the initial rise method to calculate the activation energy (see pages 49324–49325). The authors have now used the peak shape method to calculate the activation energy. As a result, Fig. 16 and 17 in the original article are now redundant and should be removed from the article. Details about the peak shape method used and a corrected Table 2 are provided here.
“Peak shape method for calculation of activation energy. Fig. 14(a) shows that the TL intensity starts to become saturated at 1180 Gy of γ-irradiation. The thermal activation energy E for the sample with 1180 Gy of γ-irradiation (associated with the trap depth) was calculated from the glow peak parameters using the following equation:
| E = 2kTm(1.26Tm/ω − 1) |
| γ-Dose (Gy) | Heating rate (°C s−1) | Tm (K) | T1 (K) | T2 (K) | τ (K) | δ (K) | ω (K) | μ = δ/ω | Activation energy E (eV) | Frequency factor (s−1) |
|---|---|---|---|---|---|---|---|---|---|---|
| 1180 (1st peak) | 5 | 356.7 | 341.29 | 370.9 | 15.47 | 14.17 | 29.64 | 0.47 | 0.54 | 1.24 × 10¹¹ |
| 1180 (2nd peak) | 5 | 393.7 | 363.2 | 426.3 | 30.5 | 32.6 | 63.1 | 0.51 | 0.96 | 2.1 × 10¹¹ |
The second half of the conclusion section, from “The TL/ML intensity increased with the increase…” until “…compared to solid state reaction methods”, should be changed to the following.
“The TL and ML intensity increased with a higher γ-dose indicating an increase in the concentration of traps with γ-dose. Te TL and ML intensity of the phosphor became saturated with a 1180 Gy gamma dose. The ML intensity increased approximately linearly with increasing impact velocity. The reason for the mechanoluminescence in the present phosphor was explained by a piezo-electrification model. Since the ML intensity of the γ-irradiated Ca2Al2SiO7:Dy3+ phosphor increased linearly, this phosphor may be used as a stress sensor. The chromaticity coordinates of a long afterglow spectra were measured and found a white afterglow of the phosphor. In this work Ca2Al2SiO7:Dy3+ phosphors were prepared by a combustion-assisted method for the first time to the best of our knowledge. The TL and ML intensities of the phosphor were measured after γ-irradiation. The result may be useful to detect and measure the γ-dose and to develop a γ-radiation sensor.”
This correction supersedes the information provided in the Expression of Concern related to this article.
The Royal Society of Chemistry apologises for these errors and any consequent inconvenience to authors and readers.
References
- G. Tiwari, N. Brahme, R. Sharma, D. P. Bisen, S. K. Sao and S. Tigga, Opt. Mater., 2016, 58, 234–242 CrossRef CAS.
| This journal is © The Royal Society of Chemistry 2020 |

