 Open Access Article
Deconvolution of electroosmotic flow in hysteresis ion transport through single asymmetric nanopipettes†
Warren
Brown
,
Yan
Li
,
Ruoyu
Yang
,
Dengchao
Wang
,
Maksim
Kvetny
,
Hui
Zheng
and
Gangli
Wang
 *
*
Department of Chemistry, Georgia State University, Atlanta, GA 30302, USA. E-mail: glwang@gsu.edu
First published on 19th May 2020
Abstract
Unveiling the contributions of electroosmotic flow (EOF) in the electrokinetic transport through structurally-defined nanoscale pores and channels is challenging but fundamentally significant because of the broad relevance of charge transport in energy conversion, desalination and analyte mixing, micro and nano-fluidics, single entity analysis, capillary electrophoresis etc. This report establishes a universal method to diagnose and deconvolute EOF in the nanoscale transport processes through current–potential measurements and analysis without simulation. By solving Poisson, Nernst–Planck (PNP) with and without Navier–Stokes (NS) equations, the impacts of EOF on the time-dependent ion transport through asymmetric nanopores are unequivocally revealed. A sigmoidal shape in the I–V curves indicate the EOF impacts which further deviate from the well-known non-linear rectified transport features. Two conductance signatures, an absolute change in conductance and a ‘normalized’ one relative to ion migration, are proposed as EOF impact (factor). The EOF impacts can be directly elucidated from current–potential experimental results from the two analytical parameters without simulation. The EOF impact is found more significant in intermediate ionic strength, and potential and pore size dependent. The less-intuitive ionic strength and size dependence is explained by the combined effects of electrostatic screening and non-homogeneous charge distribution/transport at nanoscale interface. The time-dependent conductivity and optical imaging experiments using single nanopipettes validate the proposed method which is applicable to other channel type nanodevices and membranes. The generalizable approach eliminates the need of simulation/fitting of specific experiments and offers previously inaccessible insights into the nanoscale EOF impacts under various experimental conditions for the improvement of separation, energy conversions, high spatial and temporal control in single entity sensing/manipulation, and other related applications.
The transport of charged species and solvent flow in nano-apertures can be generated through an applied potential-electrokinetic transport including electroosmotic flow (EOF), pressure differential, or concentration gradient etc. The transport processes, ions or neutral species without or with solvent flow, play important roles in many applications such as detection analysis1–7 in particular the manipulation and controls toward single entities (molecules/nanoparticles/cells),8–10 net pumping of analyte,11–13 separation in capillary electrophoresis (micron-sized channels) and microfluidics,14,15 and energy conversion.16,17 The redistribution of ions during the transport process changes electrical double layer (EDL) structure. Because EOF arises from the interplay of EDL with externally applied electrical field, studies on EOF and nanoscale EDL are at the transition regime bridging the two fields of nanoelectroanalytical chemistry and electrophoresis. Studies on EOF contributations in nanotransport have been limited by theory/simulation under constant potentials or steady-state. EOF in time-dependent electrokinetic ion transport in nanopores or nanochannels remain one of the essential questions to be addressed despite the extensive studies recently.
Non-bulk transport phenomena emerge when the contributions from the EDL regions on charged asymmmetric nanopore/channel walls cannot be ignored, for example when at least one dimention of the nanodevices is ‘close’ to the Debye length of the EDL. The Debye length is a classic descriptor of the EDL that is a function of solution ionic strength, solvent relative permittivity and temperature etc. (expression for calculation included in ESI†).18 The comparison to Debye length has two often misleading aspects of (1) an inaccurate underlying assumption of uniform transport through the channel cross section, and (2) the overall surface effect is limited strictly to the Deybe length which in fact describes the percentage drop of surface electrical field. In other words, the channel can be significantly larger than the Debye length yet surface affected transport behaviors remain distinct or cannot be ignored. Ion migration (or electrophoresis) through channel-type nanodevices is influenced by the combined applied (across the nanopore/channel) and surface (vector component in the direction of transport) electrical fields. Asymmetry in nanochannel structures, such as the prototype conical nanopores studied herein,18,19 together with surface charges and modifications,14,20–22 provide materials/device platforms for selective transport. The well-known ion current rectification (ICR) results from the enhancement and depletion of ions as charge carriers which causes different ion flux under opposite polarities of the same applied potential magnitudes. When the applied potential varies over time, for example sweeping cyclically like in cyclic voltammetry, transient or dynamic ion redistribution under varying stimulus induces interesting phenomena such as pinched hysteresis loops and a non-zero cross point in current–potential curves.23–26
EOF in the transport through nanoapertures under variable stimulus has not been explored to the best of our knowledge. The role of EOF in the nanotransport is mostly studied under a constant potential or steady-state by simulation because experiments mostly measure the overall transport current/flux. Unfortunately, the EOF contributions in simulation literature ranged from negligible/detectable,27–29 somewhat significant30 and more recently to significant under various salt, ionic strength, geometric and surface charge density conditions.31–34 Electroosmotic flow rectification (EFR), i.e. asymmetric flow, is reported to arise from the concentration polarization process, resulting in different current values or flow rates at potentials of the same magnitude but opposite polarities respectively.35 EFR has been demonstrated in nanopores with asymmetric solvent or solution combinations36,37 and in asymmetric pores11,38 or membranes12,13,39,40 in symmetric electrolyte conditions. Related phenomena such as negative differential resistance have been generated from the same underlying EOF mechanism.41,42 The impacts by pressure driven flow on the concentration polarization process in conical nanopores have also been reported.43
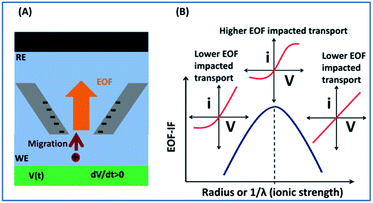
This report presents a solution to analyze EOF directly from experimental current–potential measurements, by firstly establishing the methodology via simulation, and then validation with electroanalytical and imaging experiments. As illustrated in Scheme 1, using a single conical nanopipette as prototype, analytical signatures of EOF can be obtained directly from current–potential curvatures. While non-linearity in I–V curve is well-known indication of surface affected transport, a sigmodal shape, or derivatives in terms of conductance/conductivity, reveals strong EOF effect.
Experimental methods
Fabrication of nanopipettes was carried out using a laser puller (P-2000 Sutter) and quartz capillaries (O.D.: 1.0 mm, I.D.: 0.7 mm). To fabricate relatively small nanopipettes the pull parameters were: heat: 700, filament: 4, velocity: 60, del: 150, pull: 120 or 155. For larger nanopipettes a two-line pull was used (1) heat: 750, filament: 4, velocity: 55, del: 180, pull: 80. (2) heat: 700, filament: 4, velocity: 60, del: 150, pull: 150 or 120. The nanopipette was loaded in the sequence of: acetonitrile, water and KCl electrolyte via centrifugation. The sizes of individual nanopipettes were calculated based on the conductance following standard procedures previously reported and detailed in ESI.†A Gamry Reference 600 (Gamry Co.) was used for measuring the conductivity. The analyzed data were collected with the scan rate of 300 mV s−1 which was neither optimized nor limiting for EOF effects. The electrical potential was applied through two silver/silver chloride wires in inside and outside solutions. The bias polarity is defined with respect to the electrode positioned on the base side (inside capillary). The first scan of conductivity measurements was discarded, and later scans overlap confirming reproducibility.
Optical images were recorded with an Olympus BX51 microscope using a 40 X Olympus LumPlanFLN water immersion objective. Rhodamine B (Sigma-Aldrich) at 10 μM was loaded inside nanopipettes which were mounted on microscope slide, whose fluorescence was excited with X-Cite 120 Q and detected with Lumenera Infinity 3s monochrome camera. A Dagan Chem-Clamp amplifier with a Dagon 100 M head stage preamp was used to apply potential during imaging. At each potential images were taken every 200 ms at an exposure time of 100 ms. The images were processed with Image J version 1.4 using Micromanager 1.4.22 and Plot Profile.
Finite element modelling
COMSOL Multiphysics (version 4.3, with ‘transport of diluted species’, ‘electrostatics’ and ‘laminar flow’ modules) were used for finite element modeling of the transport through quartz nanopipettes. The simulation method follows our previous reports that have successfully modelled the experimental conical nanopore electrokinetic responses under various salinity and input stimulus dynamics (potential scan rate, ν).23,24,26,44 In other words, the applied potential is defined as a variable (V = V0 + νt). The Poisson, Nernst–Planck (PNP) and Navier–Stokers (NS) equations are coupled to calculate the electrical fields, ion flux and electroosmotic flow (EOF). The conical nanopore structures, surface charge definition, additional simulation details, and further explanations of the governing equations are provided in the ESI.† It is worth mentioning that the adjustment of SCD values or the conical nanostructures will not affect the observed trends/analysis; it only changes the absolute current/conductance values.The Nernst–Planck shown in eqn (1) is used to simulate the flux of the ions:
 | (1) |
The Poisson equation (eqn (2)) calculates the electric fields and ion distribution:
 | (2) |
The Navier–Stokes equation (NS), shown as eqn (3), calculates the fluid flow and therefore the flux from convection in the third term in eqn (1). Under continuity with the incompressible solvent, the Navier–Stokes (NS) equation equals zero:
 | (3) |
Results and discussion
Simulated current–potential measurements with and without EOF consideration
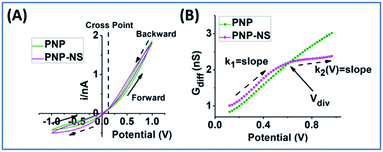
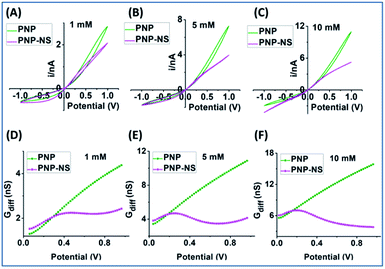
The potential-dependent differential conductance (Gdiff) in HC is plotted in Fig. 1 panel (B) where Gdiff = di/dV, i.e. the slope of an i–V branch. The differential conductance is used instead of the conductance (i/V) because it more sensitively reveals EOF as signatures as demonstrated in Fig. S1.† The Gdiff has a similar slope from PNP and PNP–NS models at lower potentials, defined as k1, up to a divergent point Vdiv after which EOF impact becomes more significant. The forward current in HC is used to establish the signature of EOF impact because it displays the most straightforward prominent features. Fig. S2† provides the analysis of other branches. Out of the four current branches separated by the cross point, the scans toward the cross point are affected by the end/switching potential which varies and is often arbitrarily selected in measurements. The EOF effect at LC is generally not as significant as HC especially in smaller pores or lower ionic strength because of the depletion of mobile charge carriers elaborated in later sections.
The common slope region basically reflects the conductance from ion migration governed by the overall electrical field (applied and surface) in the nanopore. Deviations from the PNP results toward higher potentials therefore correspond to the EOF impacts, indicated by the clearly different slopes of k2. Because experimentally, there will only be one overall conductivity responses (not two curves as shown from simulation), it is convenient and significant to employ the common response in low potential range as reference (i.e. k1) for the evaluation of the EOF both qualitatively and quantitatively.
Two parameters are proposed that describe (1) the absolute EOF impact (EOF-I) and (2) a dimensionless EOF impact factor (EOF-IF), both relative to the electrokinetic transport (PNP) measured in low potential range (k2vs. k1). The EOF-I, with the unit of nS, measures the suppression of differential conductance by EOF at different potentials in a given bulk electrolyte concentration.
| EOF-I = (k1 − k2) × V = GPNPdiff − GPNP–NSdiff | (4) |
The EOF-IF can be expressed in %. A zero EOF-IF, i.e. k2 = k1, means no EOF (PNP results or pure migration). Increase in EOF will decrease k2 and give a larger EOF-IF value. At k2 = 0 or EOF-IF at 100%, EOF matches the migration in absolute values (but negatively, or reduction) to the measured differential conductance. Even stronger EOF could make the k2 negative and thus an EOF-IF greater than 100%, which corresponds to the EOF outweighing the remaining migration in absolute values.
 | (5) |
Two representative sizes are chosen in simulation, each with experimental i–V data in a series of ionic strength for validation. The features are representative as confirmed by other nanopipette in the comparable size ranges in experiments.
EOF-I and EOF-IF from PNP–NS data are plotted in Fig. 3. k1 is calculated from the linear fitting of Gdiff slope within the common region up to the divergent potential Vdiv between PNP and PNP–NS models. The fittings are provided in Fig. S3.†k1 represents the conductance region where EOF effects are insignificant and is therefore suitable as reference for normalization (within the same nanodevice under different measurement conditions, as device heterogeneity can be inevitable in experiments). k1 increases with electrolyte concentration or charge carriers, but non-linearly as shown in Fig. S4† because of the surface effects.
k 2 is calculated from the second derivative k2 (V) = dGdiff/dV because the Gdiff region after the divergent Vdiv is non-linear. Fig. S5† provides second derivative analysis of PNP–NS results, together with PNP results for comparison. It is found that the peaks in the second derivative profiles in both models are similar in value to fitted k1 and can be used to directly obtain k1. This feature is favorable for the analysis of experimental results in which noise and available data points within the linear range can vary. In this report, the fitted k1 is used in the simulation analysis, while the peak value in the second derivative is used in the analysis of the experimental results. The approach is validated in Fig. S6† by the linear correlation (slope ∼1) between the two k1s from fitting and the peak.
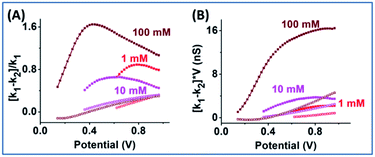
EOF-IF passes the first evaluation at the boundary condition when k1 = k2, EOF-IF equals zero, or there is no EOF. A larger or more positive EOF-IF suggests stronger EOF which reduces the measured conductance. At all concentrations the two EOF parameters show a similar peak shaped dependence on the potential, i.e. Gdiff suppression increases and then either decreases or plateau toward high potential tested. The peak potential shifts lower toward cross point as ionic strength increases. In 100 mM, in Fig. 3 panel A, the EOF-IF has a maximal value of ∼1.6 which also corresponds to the sigmoidal conductivity measurement in Fig. 2 panel C. The sigmoidal response is therefore characteristic of the EOF impact on the transport: better defined or stronger sigmoidal shape indicates stronger EOF.
The potential and concentration effects can be explained by the interplay and balance of concentration polarization affected by rectified ion migration and EOF. In the negatively charged nanopores, EOF depends on the available cation flux in the double layer within the transport-limiting nanopore region. However, if the ionic strength is too high, i.e. hundreds of milli-M for tens-nm nanopores, electrostatic screening will reduce EOF effect. Loss or diminishment of ion current rectification can be a qualitative indication of the ionic strength being too high. Because ion distribution within nanopore is potential dependent,35,47 the relative dimension/volume of EDL versus nanopore varies. At HC, concentration polarization further enhances ion concentration in the nanopore at higher potentials, which also incurs stronger electrostatic screening. Correspondingly, the EOF increases initially and then decreases under increasing applied scanning potential. A lower bulk concentration requires a higher applied potential to reach the point of maximal EOF effects on the ion transport. Correspondingly, the peak shifts to lower potentials at higher bulk electrolyte concentration. Similar trends can be seen by analyzing the scans to more negative potentials at LC in Fig. 2. Following the same rationale, EOF effect will decrease, i.e. both EOF-IF and EOF-I peaks decrease and shift to higher potentials at higher scan rates (Fig. S7†) similar to ICR because less concentration polarization occurs within shorter time under stimulus.
It is important to understand that the potential range affects the validity of EOF-IF and EOF-I. Both EOF-IF and EOF-I were calculated with respect to the transport at lower potential region dominated by migration. For example, the EOF-I can be qualitatively perceived as GPNP − GPNP–NS where the two terms originate from lower potential range and the potentials of interest respectively. The corresponding curves calculated from PNP results (more positive than Vdiv) demonstrate the theoretical limit of this analysis. The non-zero curves from PNP model are caused by the approximation of linear extrapolation of k1 after the divergent point, where non-linear rectified electrokinetic transport or the non-linear concentration polarization is known to occur.
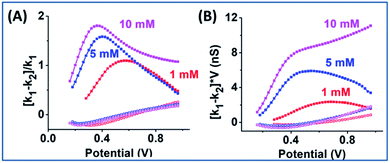 | ||
| Fig. 5 Simulated response from PNP–NS (top curves) and PNP (bottom curves) with a 60 nm radius nanopore for (A) EOF-IF and (B) EOF-I at 1 mM (red), 5 mM (blue) and 10 mM (magenta). | ||
The EOF-IF plotted in Fig. 5 panel (A) is larger than those from the smaller nanopore at all potentials and concentrations. A maximum of EOF-IF is better resolved with the larger nanopore because Gdiff decrease more sharply toward higher potentials indicating stronger EOF impacts. While the EOF-IF max is about 80% (of the migration as reference) in the 12 nm nanopore between 1 mM and 10 mM, the IF max in the 60 nm nanopore appears to reach a threshold approaching 200%, i.e. the EOF is twice the differential conductance by migration (but negative or reducing). An even higher ionic strength (bulk concentration and/or potentials) will greatly suppress surface field effect, and thus make ICR and hysteresis harder to resolve. The IF max positions are lower for the larger radius nanopore for all concentrations compared to the smaller nanopores as plotted in Fig. S9.† This corresponds to a higher flow rate resulting from the larger radius requiring less positive potential.36 It is worth mentioning that the ion flux is well-known to be non-uniform within nanopore cross-section and is highest along the interface, which explains the prominent surface effects. Similarly, the larger EOF-I value and larger potential range with a relatively constant EOF-I, i.e. plateau, in panel B at 10 mM originates from the larger EOF in the 60 nm nanopore and the competing enhancement/screening effects.
Experimental results for the validation of EOF signatures
The key EOF diagnostic features from simulation include: qualitatively (1) the sigmodal i–V curve shape and (2) the peak-shaped or non-linearly decreased differential conductance toward higher potentials; and quantitatively (3) the potential dependent EOF-I and EOF-IF whose curve shape and peak positions are dependent on ionic strength. Representative experimental results with clear EOF effects are presented for qualitative validation first. In Fig. 6, the sigmodal i–V shape appears at much lower potential, around 0.5 V in (D) from a larger nanopore than a smaller one in (A). While the signature of Gdiff curve shape at HC is obvious for both cases, the deviations at LC is only distinguishable when EOF is sufficiently strong (panel F). The need to project trajectories (arrows in panels B, E & F) attests to the experimental challenges to resolve EOF and the significance of normalization/reference within the same data, i.e. k2versus the k1 at lower potentials, in stark contrast to simulation where PNP and PNP–NS results can be calculated separately. Further, the plots of EOF-I and EOF-IF from two nanopores (∼200 nm) with strong EOF are shown in Fig. S10,† both displaying obvious peak shaped curves in excellent agreement with simulation.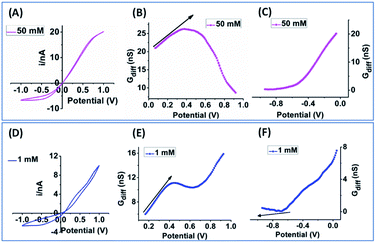 | ||
| Fig. 6 Experimental results from a 60 nm nanopore in 50 mM KCl (A–C) and a 200 nm nanopore in 1 mM KCl solution (D–F). The arrows in (B, E and F) suggest trajectories without EOF. | ||
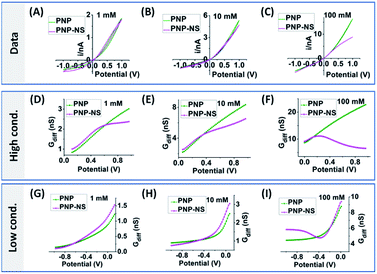
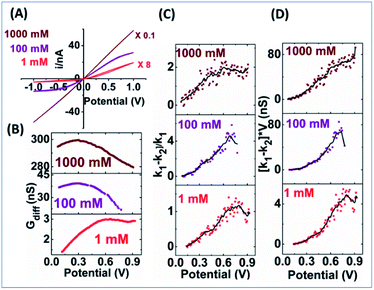
To provide guidance for the analysis of experiments where EOF effects are less obvious, more systematic experimental results from relatively medium and small sized nanopipettes in a range of electrolyte concentrations are analyzed. Representative results from low, medium and high concentrations are plotted in Fig. 7 & 8, with additional concentrations included in Fig. S11 and S12.† The comprehensive view is believed useful for the general adoption of this analytical method to other nanostructures/surfaces as long as adequate characterizations in geometry and surface charge density are accessible.48 Similar to the simulated PNP–NS responses from the larger nanopore in Fig. 4, the measured i–V features in Fig. 7A transit from the expected rectified response in low electrolyte concentration, to a sigmoidal shape in 100 mM, and to more linear ohmic behavior in 1 M due to more effective screening of the surface charge. As predicted in simulation, more obvious sigmoidal shape indicates greater EOF impact on the transport conductance that occurs at intermediate ionic strength. In Gdiff plots, the decrease toward higher potentials that clearly deviates from the increase (linear trend) in lower potential range, the shift in peak position to less positive at higher ionic strength and better-defined curve shape are also consistent with simulation.
The EOF-IF and EOF-I curves describe EOF impacts at different potentials. Since noise is inevitable in experiments which can be ‘amplified’ in derivatives (2nd for k2), it is important to focus on whether the overall trend is consistent with simulation. Though less prominent than those in Fig. S10,† the peaked curve shapes are reminiscent of the PNP–NS simulation results. Among all concentrations (shown in Fig. S11†), the EOF-IF maximizes at around 100 mM, with the peak/plateau at less positive potential at around 0.5–0.7 V. Although the EOF-I in panel D is larger in 1000 mM, one should keep in mind that conductance is higher with more charge carrier, i.e. higher ion concentrations. As indicated by the EOF-IF, EOF has a more significant impact on the transport over migration/electrophoresis in 100 mM compared to 1000 mM. It is also significant to notice that even in conditions where apparent ohmic behavior is approached, EOF can still have a detectable influence on transport.
The greater oscillatory ‘noisy’ responses at higher potentials, less at low ion concentrations, might not be solely due to experimental noise, as random noise would be consistent within one dataset or series of measurements. Outlier rejection, boxcar average and smoothing (described in ESI, Fig. S13†) do not eliminate those ‘noise’ even after significant distortion of expeirmental data is observed. We speculate complications from stochastic or random processes, such as nucleation, nanoprecipitation, bubble formation, as well as the competing mechanisms of nanopore concentration polarization and electrostatics screening etc.49–51 Further considerations on those aspects, currently underway, are beyond the scope of this report and do not affect the key conclusions.
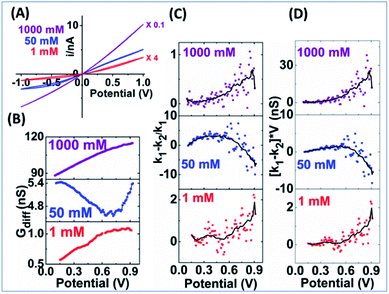
The measured i–V results from a smaller nanopore in Fig. 8 panel A show current rectification up to 1 M, but a sigmoidal shape can only be arguably discerned visually at 50 mM. The EOF can be better resolved in the Gdiff plots. Unlike the largely linear increase in Gdiff toward higher potentials at other concentrations, the 50 mM curve in panel B decreases to a minima at about 0.8 V indicating more significant EOF impact. Accordingly, peak shaped curves are only resolved from the 50 mM data for the two EOF charactors in panels C & D which are generally lower than those for the larger nanopipette. These results are broadly consistent with the modelling results which predict that larger nanoaperatures have larger EOF. The lower EOF in the smaller nanopipettes also means narrower conditions such as ionic strength range to resolve the EOF. Another observation is that at 50 mM the EOF-IF reaches maximum then decreases to negative values toward higher potentials. The negative EOF-IF can also be seen in simulation results, albeit less distinct within the potential range limited to ±1 V (to be more relevant to experiments where bubble formation due to water splitting should be avoided). A possible explanation that requires further study is the significant concentration enhancement at higher potentials which attenuates the EOF. Additional examples from other nanopipettes are provided in Fig. S14 and S15† to offer a range of behaviors that will be observed in different experimental systems. Overall, the same qualitative trends are observed and consistent with simulation, while the quantitative factors and features vary due to variations in geometry and surface charge density of the fabricated nanopipettes.
Imaging of EOF in nanopipettes
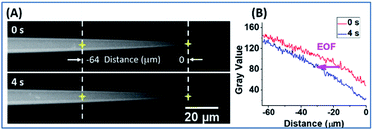
Next EOF is directly observed by the changes in fluorescence intensity. Rhodamine B is neutral under the measurement condition (unbuffered, slightly acidic between 6–7 due to varied CO2 dissolution).52 Therefore, the movement of the dye results solely from the EOF without the complication of electrophoresis effect. Rhodamine B was added only to the solution inside the nanopipettes but not outside, with the other conditions comparable to the conductivity measurements. The changes in emission intensity over time under +1 V are presented in Fig. 9. The intensity near the tip area decreases within seconds (Panel A, additional images in S16†), demonstrating the direction of EOF is toward inside capillary, because rhodamine B was not added in the exterior solution. Corresponding intensity analysis in panel B further reveal the left-shift of the fluorescence profiles or the EOF effect semi-quantitatively. Time lapse images under 0 V and −1 V are provided in ESI Fig. S17† as controls. Under negative potential, EOF or cation flux is toward the outside of the nanopipette. The fluorescence profiles shift right, or the intensity increases near the tip. It is worth mentioning that the dyes, either via diffusion or by EOF into the outside bulk solution, will be mostly out of focus and not affect the image analysis.Conclusion
The electroosmotic flow contribution to the overall electrokinetic transport through single nanopipettes is deconvoluted by simulation and confirmed by experiments. By comparing the current–potential curves with and without flow consideration in continuum-based simulation, a sigmodal shape is identified as qualitative diagnostic feature of EOF presence. Two quantitative parameters for the EOF impact proposed: an absolute EOF impact describing the suppression in conductance by EOF; and a relative EOF impact factor in reference to the migration/electrophoresis from the same device/solution conditions. Importantly, both parameters can be elucidated from a single experimental i–V curve. The analytical characteristics of EOF contribution are validated by surveying nanopipettes of different size ranges and under different electrolyte concentrations. In general, EOF is stronger in intermediate ionic strength and for radius much larger than the Debye length. For a given nanodevice in a given bulk electrolyte solution, EOF impacts increases from zero volts or cross-point potential, reaches a maximum or plateau at intermediate potential ranges, and then decreases at higher potential range depending on the measurement condition. Successful imaging of the nano-confined EOF with a neutral fluorophore not just validates the proposed method; it also provides EOF as another mechanism for single entity handling of charged as well as neutral species, and possibly improved controls. It is important to emphasize that nanopore results are well known to be susceptible to heterogeneity in device nanogeometry and surface charge variations, which is inaccessible for quantitative fitting. The self-calibration proposed herein, EOF characteristics in reference to the migration electrokinetic transport from the exact same measurement, is therefore significant as a much needed applicable analysis tool to interpret broad experimental results and related applications.Conflicts of interest
The authors declare no competing financial interests.Acknowledgements
This material is based upon work supported by the U.S. Department of Energy, Office of Science, Office of Basic Energy Sciences under Award Number DE-SC0019043.References
- W.-L. Hsu and H. Daiguji, Anal. Chem., 2016, 88, 9251–9258 CrossRef CAS PubMed.
- P. Waduge, R. Hu, P. Bandarkar, H. Yamazaki, B. Cressiot, Q. Zhao, P. C. Whitford and M. Wanunu, ACS Nano, 2017, 11, 5706–5716 CrossRef CAS PubMed.
- W. J. Lan, D. A. Holden, J. Liu and H. S. White, J. Phys. Chem. C, 2011, 115, 18445–18452 CrossRef CAS.
- S. R. German, L. Luo, H. S. White and T. L. Mega, J. Phys. Chem. C, 2013, 117, 703–711 CrossRef CAS.
- W. J. Lan, C. Kubeil, J. W. Xiong, A. Bund and H. S. White, J. Phys. Chem. C, 2014, 118, 2726–2734 CrossRef CAS.
- Y. Qiu, I. Vlassiouk, Y. Chen and Z. S. Siwy, Anal. Chem., 2016, 88, 4917–4925 CrossRef CAS PubMed.
- E. Weatherall and G. R. Willmott, J. Phys. Chem. B, 2015, 119, 5328–5335 CrossRef CAS PubMed.
- S.-M. Lu, Y.-Y. Peng, Y.-L. Ying and Y.-T. Long, Anal. Chem., 2020, 92, 5621–5644 CrossRef CAS PubMed.
- S.-M. Lu and Y.-T. Long, TrAC, Trends Anal. Chem., 2019, 117, 39–46 CrossRef CAS.
- R.-J. Yu, Y.-L. Ying, R. Gao and Y.-T. Long, Angew. Chem., Int. Ed., 2019, 58, 3706–3714 CrossRef CAS PubMed.
- A. R. Kneller, D. G. Haywood and S. C. Jacobson, Anal. Chem., 2016, 88, 6390–6394 CrossRef CAS PubMed.
- X. Wu, P. Ramiah Rajasekaran and C. R. Martin, ACS Nano, 2016, 10, 4637–4643 CrossRef CAS PubMed.
- X. Wu, J. Experton, W. Xu and C. R. Martin, Anal. Chem., 2018, 90, 7715–7720 CrossRef CAS PubMed.
- M. Tagliazucchi and I. Szleifer, Mater. Today, 2015, 18, 131–142 CrossRef CAS.
- E. Riccardi, J.-C. Wang and A. I. Liapis, J. Chem. Phys., 2014, 140, 084901 CrossRef PubMed.
- Z. Zhang, X. Sui, P. Li, G. Xie, X.-Y. Kong, K. Xiao, L. Gao, L. Wen and L. Jiang, J. Am. Chem. Soc., 2017, 139, 8905–8914 CrossRef CAS PubMed.
- R. Long, Z. Kuang, Z. Liu and W. Liu, Phys. Chem. Chem. Phys., 2018, 20, 7295–7302 RSC.
- R. B. Schoch, J. Han and P. Renaud, Rev. Mod. Phys., 2008, 80, 839–883 CrossRef CAS.
- Z. S. Siwy and S. Howorka, Chem. Soc. Rev., 2010, 39, 1115–1132 RSC.
- E. Riccardi, J. C. Wang and A. I. Liapis, J. Sep. Sci., 2012, 35, 3073–3083 CrossRef CAS PubMed.
- C.-M. Wang, D.-L. Kong, Q. Chen and J.-M. Xue, Frontiers of Materials Science, 2013, 7, 335–349 CrossRef.
- J. Cai, Q. He, L. Song, L. Han, B. Liu, Y. Zhao, W. Chen and D. Zhan, J. Phys. Chem. C, 2019, 123, 26299–26308 CrossRef CAS.
- D. C. Wang, M. Kvetny, J. Liu, W. Brown, Y. Li and G. L. Wang, J. Am. Chem. Soc., 2012, 134, 3651–3654 CrossRef CAS PubMed.
- D. C. Wang, W. Brown, Y. Li, M. Kvetny, J. Liu and G. L. Wang, Anal. Chem., 2017, 89, 11811–11817 CrossRef CAS PubMed.
- Y. Li, D. C. Wang, M. M. Kvetny, W. Brown, J. Liu and G. L. Wang, Chem. Sci., 2015, 6, 588–595 RSC.
- D. Wang, J. Liu, M. Kvetny, Y. Li, W. Brown and G. Wang, Chem. Sci., 2014, 5, 1827–1832 RSC.
- H. Daiguji, P. Yang and A. Majumdar, Nano Lett., 2004, 4, 137–142 CrossRef CAS.
- H. S. White and A. Bund, Langmuir, 2008, 24, 2212–2218 CrossRef CAS PubMed.
- I. Vlassiouk, S. Smirnov and Z. Siwy, ACS Nano, 2008, 2, 1589–1602 CrossRef CAS PubMed.
- Y. Ai, M. K. Zhang, S. W. Joo, M. A. Cheney and S. Z. Qian, J. Phys. Chem. C, 2010, 114, 3883–3890 CrossRef CAS.
- J.-P. Hsu, S.-T. Yang, C.-Y. Lin and S. Tseng, J. Phys. Chem. C, 2017, 121, 4576–4582 CrossRef CAS.
- S. Tseng, S.-C. Lin, C.-Y. Lin and J.-P. Hsu, J. Phys. Chem. C, 2016, 120, 25620–25627 CrossRef CAS.
- D.-H. Lin, C.-Y. Lin, S. Tseng and J.-P. Hsu, Nanoscale, 2015, 7, 14023–14031 RSC.
- J.-P. Hsu, T.-W. Lin, C.-Y. Lin and S. Tseng, J. Phys. Chem. C, 2017, 121, 28139–28147 CrossRef CAS.
- W. J. Lan, M. A. Edwards, L. Luo, R. T. Perera, X. J. Wu, C. R. Martin and H. S. White, Acc. Chem. Res., 2016, 49, 2605–2613 CrossRef CAS PubMed.
- E. C. Yusko, R. An and M. Mayer, ACS Nano, 2010, 4, 477–487 CrossRef CAS PubMed.
- Y. Qiu, R. A. Lucas and Z. S. Siwy, J. Phys. Chem. Lett., 2017, 8, 3846–3852 CrossRef CAS PubMed.
- N. Laohakunakorn, B. Gollnick, F. Moreno-Herrero, D. G. A. L. Aarts, R. P. A. Dullens, S. Ghosal and U. F. Keyser, Nano Lett., 2013, 13, 5141–5146 CrossRef CAS PubMed.
- P. Jin, H. Mukaibo, L. P. Horne, G. W. Bishop and C. R. Martin, J. Am. Chem. Soc., 2010, 132, 2118–2119 CrossRef CAS PubMed.
- G. W. Bishop, M. M. Lopez, P. Ramiah Rajasekaran, X. Wu and C. R. Martin, J. Phys. Chem. C, 2015, 119, 16633–16638 CrossRef CAS.
- L. Luo, D. A. Holden, W.-J. Lan and H. S. White, ACS Nano, 2012, 6, 6507–6514 CrossRef CAS PubMed.
- L. Luo, D. A. Holden and H. S. White, ACS Nano, 2014, 8, 3023–3030 CrossRef CAS PubMed.
- W.-J. Lan, D. A. Holden and H. S. White, J. Am. Chem. Soc., 2011, 133, 13300–13303 CrossRef CAS PubMed.
- D. Wang, W. Brown, Y. Li, M. Kvetny, J. Liu and G. Wang, ChemElectroChem, 2018, 5, 3089–3095 CrossRef CAS.
- J. Liu, M. Kvetny, J. Feng, D. Wang, B. Wu, W. Brown and G. Wang, Langmuir, 2012, 28, 1588–1595 CrossRef CAS PubMed.
- S. Pennathur and J. G. Santiago, Anal. Chem., 2005, 77, 6782–6789 CrossRef CAS PubMed.
- W. Guo, Y. Tian and L. Jiang, Acc. Chem. Res., 2013, 46, 2834–2846 CrossRef CAS PubMed.
- J. Liu, D. C. Wang, M. Kvetny, W. Brown, Y. Li and G. L. Wang, Langmuir, 2013, 29, 8743–8752 CrossRef CAS PubMed.
- Y. Li, M. Kvetny, M. Bowen, W. Brown, D. Wang and G. Wang, Cryst. Growth Des., 2019, 19, 2470–2475 CrossRef CAS.
- L. Innes, M. R. Powell, I. Vlassiouk, C. Martens and Z. S. Siwy, J. Phys. Chem. C, 2010, 114, 8126–8134 CrossRef CAS.
- E. V. Levine, M. M. Burns and J. A. Golovchenko, Phys. Rev. E, 2016, 93, 013124 CrossRef PubMed.
- F. Lopez Arbeloa, T. Lopez Arbeloa, M. J. Tapia Estevez and I. Lopez Arbeloa, J. Chem. Phys., 1991, 95, 2203–2208 CrossRef CAS.
Footnote |
| † Electronic supplementary information (ESI) available: Details of the simulation; details of the analysis; and experimental examples from different nanopipettes and intermediate concentrations from the examples in the text (PDF). See DOI: 10.1039/c9sc06386b |
| This journal is © The Royal Society of Chemistry 2020 |

