 Open Access Article
Molecular design of antimicrobial conjugated oligoelectrolytes with enhanced selectivity toward bacterial cells†
Jakkarin
Limwongyut
 a,
Chenyao
Nie
*b,
Alex S.
Moreland
a and
Guillermo C.
Bazan
 *ab
*ab
aCenter for Polymers and Organic Solids, Department of Chemistry and Biochemistry, University of California, Santa Barbara, CA 93106, USA. E-mail: bazan@chem.ucsb.edu
bDepartments of Chemistry and Chemical Engineering, National University of Singapore, 117543, Singapore. E-mail: niechenyao@nus.edu.sg
First published on 24th July 2020
Abstract
A series of cationic conjugated oligoelectrolytes (COEs) was designed to understand how variations in molecular dimensions impact the relative activity against bacteria and mammalian cells. These COEs kept a consistent distyrylbenzene framework but differed in the length of linker between the core and the cationic site and the length of substitute on the quaternary ammonium functioned group. Their antimicrobial efficacy, mammalian cell cytotoxicity, hemolytic activity, and cell association were determined. We find that hydrophobicity is a factor that controls the degree of COE association to cells, but in vitro efficacy and cytotoxicity depend on more subtle structural features. COE2-3C-C4butyl was found to be the optimal structure with a minimum inhibitory concentration (MIC) of 4 μg mL−1 against E. coli K12, low cytotoxicity against HepG2 cells and negligible hemolysis of red blood cells, even at 1024 μg mL−1. A time-kill kinetics study of COE2-3C-C4butyl against E. coli K12 demonstrates bactericidal activity. These findings provide the first systematic investigation of how COEs may be modulated to achieve low mammalian cell cytotoxicity with the long-range perspective of finding candidates suitable for developing a broad-spectrum antimicrobial agent.
Introduction
Antimicrobial resistance is expected to cause up to 10 million deaths per year by 2050, along with a massive economic burden.1,2 Indeed, learned opinions have placed the problem at par with possible damage by climate change.3–5 Despite the foreseeable crisis, there have been few new antibiotics introduced to the market, in part because of the long drug development cycle, rapid acquisition of drug resistance, and poor investment return.6,7 Studies of new antimicrobial compounds at a basic research level are thus warranted.8,9Different approaches are being considered for designing new antibiotics that target different machineries in bacterial cells. Examples include cell wall synthesis,10,11 DNA and RNA synthesis,12,13 protein biosynthesis,14 folic acid metabolism,15 and the cell membrane.16,17 Compounds that target cell membranes typically kill bacterial cells by selectively disrupting bacterial membranes over mammalian cell membranes due to difference in lipid compositions between the two cell types.18 Potential advantages of this mechanism include that bacteria are known to be less likely to develop resistance to membrane-disrupting compounds19,20 and its potential to eradicate persistent infections in which bacteria are in dormant states.21
Conjugated oligoelectrolytes (COEs) are a class of synthetic water-soluble conjugated molecules containing a conjugated core and pendant ionic groups. COEs have been reported to spontaneously interact with lipid bilayers and modify the properties of bilayers.22,23 The extent of membrane perturbation can be fine-tuned via molecular design approaches.24,25 A general guiding principle is that the mismatch between the bilayer thickness and length of the COE leads to membrane disruption.26,27
In particular, the distyrylbenzene derivative COE2-3C-C6 (previously referred to as COE2-3C, see Scheme 1) was reported to have the lowest minimum inhibitory concentration (MIC) against E. coli K12 among a homologous series of structures that differed in the number of phenylenevinylene units.25 We also recently reported a subsequent study that illustrated the relationship between antimicrobial activity and the hydrophobicity of stilbene-based COEs with an apparent correlation between increased hydrophobicity and increased antimicrobial potency.28 Up to now, the cytotoxicity of COEs against mammalian cells has yet to be explored despite its importance in determining suitable chemical structures for drug development.29
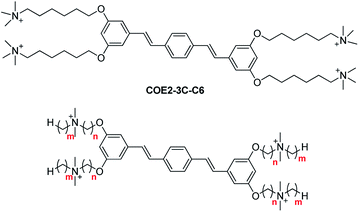 | ||
| Scheme 1 Chemical structure of COE2-3C-C6 (top) and general structure of COEs in this study (bottom). | ||
With prior information in hand, we describe herein a series of COEs based on the distyrylbenzene core that is generated by modulating two molecular features: linker length (parameter n) and terminal alkyl chains length (parameter m), see Scheme 1. We examined antimicrobial efficacy and mammalian cell cytotoxicity. Bacterial selectivity was determined and the optimal compound in the series was identified thereafter.
Results and discussion
Synthetic procedures
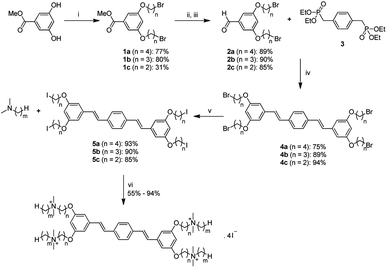
The general synthetic approach to generate the new series of COEs is shown in Scheme 2. Aldehyde precursors were first synthesized by alkylation of methyl 3,5-dihydroxybenzoate with α,ω-dibromoalkanes. Isolated aryl ether products 1a–1c were subsequently reduced by using diisobutylaluminium hydride (DIBAL) and then oxidized with MnO2 to obtain the aldehyde derivatives 2a–2c. Next, the aldehydes were reacted with compound 3 via Horner–Wadsworth–Emmons (HWE) reaction to obtain distyrylbenzene intermediates 4a–4c. Finkelstein halide exchange reactions were then used for bromide/iodide exchange, thereby yielding neutral intermediates 5a–5c. Finally, 5a–5c underwent quaternization reactions with various tertiary amines to obtain target molecules. COE2-3C-C3propyl (n = 3, m = 3) and COE2-3C-C4propyl (n = 4, m = 3) were synthesized via a slightly different pathway (see ESI†). Abbreviations of the COEs are listed in Table 1.| m | n = 2 | n = 3 | n = 4 |
|---|---|---|---|
| 1 | COE2-3C-C2 | COE2-3C-C3 | COE2-3C-C4 |
| 2 | COE2-3C-C2ethyl | COE2-3C-C3ethyl | COE2-3C-C4ethyl |
| 3 | — | COE2-3C-C3propyl | COE2-3C-C4propyl |
| 4 | COE2-3C-C2butyl | COE2-3C-C3butyl | COE2-3C-C4butyl |
| 5 | — | — | COE2-3C-C4pentyl |
| 6 | COE2-3C-C2hexyl | COE2-3C-C3hexyl | COE2-3C-C4hexyl |
Antimicrobial efficacy
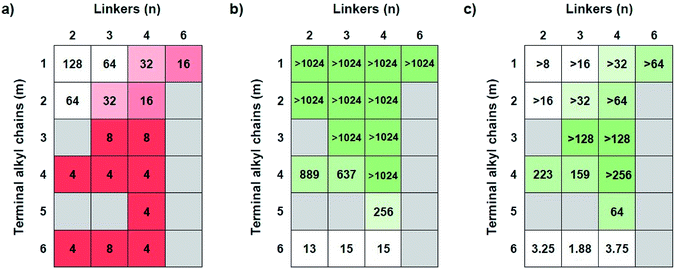
The antimicrobial efficacies of COEs were screened by determining minimum inhibitory concentrations (MICs) against Gram-negative bacteria E. coli K12 (Fig. 1a). When the terminal alkyl chains, i.e. N substituents, are short (m ≤ 2), one observes that the MIC gradually increased (less potent antibiotics) in response to decreasing linker length (parameter n). For example, at m = 1, the MIC values increase from 16 μg mL−1 for COE2-3C-C6 (n = 6, m = 1) to 128 μg mL−1 for COE2-3C-C2 (n = 2, m = 1). Similarly, for m = 2, MIC increases from 16 μg mL−1 for COE2-3C-C4ethyl (n = 4, m = 2) to 64 μg mL−1 for COE2-3C-C2ethyl (n = 2, m = 2). Upon elongation of the terminal alkyl chains, the MIC is largely insensitive relative to linker length. As seen in Fig. 1a, COEs with N-substituents of butyl or longer (m ≥ 4) have similar antimicrobial efficacies, with MICs around 4 μg mL−1. This similarity of the MICs suggests that effects from the terminal alkyl chains dominate over the influence by the linkers. Therefore, for this limited set of compounds, COEs with m ≥ 4 are desirable for maintaining good antimicrobial efficacy regardless of linkers. In addition to antimicrobial activities against E. coli K12, MICs for a subset of COEs against another Gram-negative bacteria (K. pneumoniae) and two Gram-positive bacteria (E. faecium, and S. aureus) were determined (Table S1†) at Emery Pharma (Alameda, CA). In short, similar trends in MICs were observed in those bacterial strains and all these COEs showed relatively low MICs toward tested Gram-positive bacteria.Mammalian cell cytotoxicity
Antimicrobial compounds need to have low MICs against bacteria but also low cytotoxicity toward mammalian cells. In order to determine cytotoxicity, half maximal inhibitory concentration (IC50) values were determined in vitro against human hepatocellular carcinoma cell line (HepG2) by using the MTT assay. As shown in Fig. 1b, COEs with m ≤ 3 show low cytotoxicity, as their IC50 values are higher than 1024 μg mL−1, the highest concentration tested. Cytotoxicity generally increases in response to an increase in m. For instance, at n = 4, IC50 decreases from >1024 μg mL−1 (m = 1–4) to 256 μg mL−1 and 15 μg mL−1 for pentyl (m = 5) and hexyl (m = 6) groups, respectively. When the terminal groups are butyl (m = 4), there is a slight reduction in IC50 values for COEs containing linkers with 3 carbon atoms or less (n ≤ 3; 889 μg mL−1 and 637 μg mL−1 for n = 1 and 2, respectively). According to the trends of IC50, minimizing cytotoxicity can be realized by having terminal alkyl chains that are butyl groups or shorter (m ≤ 4). Additionally, at m = 4, the four-carbon linker (n = 4) is slightly favored due to a small increase in cytotoxicity of COEs with shorter linkers (n = 2 and 3).Bacterial selectivity analysis
An optimal structure of COEs requires balance between antimicrobial properties and mammalian cell cytotoxicity. With the data in Fig. 1a and b, a ratio between IC50 and MIC was used to evaluate the bacterial selectivity of COEs. Higher IC50/MIC values are more desirable. Fig. 1c illustrates a heatmap of IC50/MIC values, showing the trend of bacterial selectivity. The heatmap shows that COEs with methyl or ethyl terminal alkyl chains (m = 1 and 2) exhibit low selectivity indices due to their low antimicrobial activities (MIC ≥ 16 μg mL−1) despite their low cytotoxicity. On the other hand, COEs containing longer terminal alkyl chains (m = 5 and 6) do not show promising selectivity indices due to cytotoxicity. COEs with hexyl groups (m = 6) have extremely low IC50/MIC values at 3.25, 1.88, and 3.75 for n = 2, 3 and, 4 respectively. COE2-3C-C4butyl (n = 4, m = 4) is shown to have highest selectivity index with IC50/MIC greater than 256. Thus, it was identified as the optimal structure for this specific set of compounds.Hemolytic activity
Hemolytic activity is an essential measure that determines suitability for in vivo clinical chemistry tests. Thus, the HC50 values (defined as a concentration at which 50% of red blood cells were lysed) of COEs were determined toward fresh CD-1 mouse red blood cells, see Table 2. In these experiments, red blood cells were collected from whole blood, washed with phosphate buffer saline (PBS) and incubated with different concentrations of COE2-3C-C4 analogs (n = 4) at 37 °C for 1 hour. After incubation, the red blood cells were removed and the amount of hemoglobin in the supernatant was determined from absorption at 450 nm. Of particular interest from Table 2 is that significant hemolysis is observed only with m = 6, with HC50 = 53 μg mL−1. At the maximum concentration tested (1024 μg mL−1), there is no significant hemolysis (<5%) of red blood cells treated with COEs with m ≤ 4. An abrupt change in hemolytic activity of COE2-3C-C4pentyl (m = 5) and COE2-3C-C4hexyl (m = 6) suggests that there is a threshold of the length of alkyl chain termini that triggers significant hemolysis. A similar behavior was reported in membrane-active antimicrobial agents with different alkyl side chains.30,31 The observed hemolytic activity of COE2-3C-C4 series generally agrees with its trend of cytotoxicity (IC50, Fig. 1b, n = 4, m = 1–6).| Compound | HC50 (μg mL−1) | Hemolysis at 1024 μg mL−1 (%) |
|---|---|---|
| COE2-3C-C4 | >1024 | 3.0 ± 0.1 |
| COE2-3C-C4ethyl | >1024 | 2.3 ± 0.3 |
| COE2-3C-C4propyl | >1024 | 1.6 ± 0.2 |
| COE2-3C-C4butyl | >1024 | 4.9 ± 0.6 |
| COE2-3C-C4pentyl | >1024 | 20.4 ± 2.7 |
| COE2-3C-C4hexyl | 53 | 75.8 ± 1.0 |
Cell association
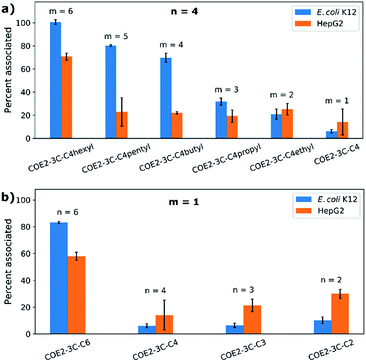
Cell association experiments were performed using bacterial and mammalian cells in order to see to what extent COE associating affinity could be correlated to antimicrobial and cytotoxicity profiles. E. coli K12 (OD = 1) and HepG2 cells (2 × 10⁶ cells per mL) were treated at 37 °C for 2 hours in Hank's balanced salt solution (HBSS) without calcium and magnesium ions. Cells were centrifuged and the amount of net unassociated COE in the buffer was determined from the absorbance at 380 nm. The results of these studies are summarized in Fig. 2 and the numbers of COE molecules associated to each E. coli K12 and HepG2 cell were calculated (Table S2†). From Fig. 2a, one observes that for n = 4 there is an increase in association with E. coli K12 as m increases from 1 to 6. COE2-3C-C4hexyl (n = 4, m = 6) also shows the highest association to HepG2 cells. However, from m = 1 to 5, the associations to HepG2 cells are similar within experimental errors (approximately 20% associated). Fig. 2b provides the cell association profile for m = 1 and n = 2–6. Highest association to E. coli K12 and HepG2 cells is observed for COE2-3C-C6 (i.e. n = 6, m = 1). In this series, association to both cell types decrease for n ≤ 4. Specifically, association to E. coli K12 decreases in a “step function” fashion from 83 ± 1% when n = 6 to less than 10% when n ≤ 4. A decrease in association was also observed for HepG2 cells from 58 ± 3% to 14 ± 11% when n decreases from n = 6 to n = 4, but is followed by a trend that is difficult to discern given the experimental uncertainties.By and large, E. coli K12 association tracks well with the hydrophobic content in the end groups (Fig. 2a, parameter m). Considering the linker length (Fig. 2b), the most hydrophobic compound (n = 6, m = 1) in the series also shows the highest cell association. A similar behavior has been observed in certain antimicrobial peptides (AMPs).32 However, the trend of cell association is less clear when n < 6 (i.e., 4, 3, and 2). One possible line of thought is that apart from hydrophobicity, the distance between charges also impacts the equilibrium for intercalation within lipid bilayers because of structural mismatch.
It is worth noting that there is a similar cell association for COE2-3C-C4hexyl (n = 4, m = 6; 101 ± 2% and 14 ± 1% to E. coli K12 and HepG2 cells, respectively) and COE2-3C-C6 (n = 6, m = 1; 83 ± 1% and 12 ± 1% to E. coli K12 and HepG2 cells, respectively). However, their MIC and IC50 values are different. Specifically, COE2-3C-C4hexyl has significantly higher antimicrobial activity and cytotoxicity (MIC = 4 μg mL−1 and IC50 = 15 μg mL−1) than COE2-3C-C6 (MIC = 16 μg mL−1 and IC50 > 1024 μg mL−1; Fig. 1a and b). Another interesting observation arises from a similar percent association to cells for COE2-3C-C4pentyl (n = 4, m = 5; 80 ± 1% and 23 ± 12% to E. coli K12 and HepG2 cells, respectively) and COE2-3C-C4butyl (n = 4, m = 4; 70 ± 4% and 22 ± 1% to E. coli K12 and HepG2 cells, respectively) (Fig. 2a). Despite their similar associations, they have different IC50/MIC values (64 for COE2-3C-C4pentyl and >256 for COE2-3C-C4butyl). These two phenomena imply contribution by a specific, molecular-structure-dependent mechanism that impacts cytotoxicity and antimicrobial efficacy.
Bactericidal activity
As a final note, the bactericidal activity of COE2-3C-C4butyl was investigated by an in vitro time-kill kinetic assay based on its optimal IC50/MIC ratio. It bears noting that according to a time-dependent cell association assay, COE2-3C-C4butyl reaches its maximal association to E. coli K12 within 30 minutes after treatment (Fig. S4†). E. coli K12 was challenged with COE2-3C-C4butyl at 4× MIC (16 μg mL−1) and 10× MIC (40 μg mL−1). As shown in Fig. 3, with an exposure at 40 μg mL−1 (10× MIC) for 2 hours, a 3 log10-fold decrease in colony forming units (cfu) was observed. Meanwhile, a 3 log10-fold decrease in colony forming units was also achieved within 4 hours with exposure at 16 μg mL−1 (4× MIC). As bactericidal activity is defined as greater than 3 log10-fold decrease in colony forming units, which is equivalent to 99.9% killing of the inoculum, these results indicate an excellent bactericidal activity.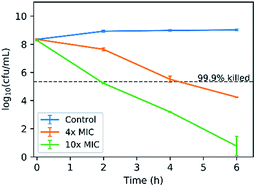 | ||
| Fig. 3 Time-kill curves of E. coli K12 treated with COE2-3C-C4butyl at concentrations of 4× MIC (16 μg mL−1) and 10× MIC (40 μg mL−1). | ||
Conclusions
In conclusion, we synthesized a series of distyrylbenzene-based COEs with different linker and terminal alkyl chain lengths to explore relationships between molecular features and antimicrobial efficacies and mammalian cell cytotoxicity. We found that hydrophobicity exerts influence over the degree of interactions between COEs and the cells. However, their biological activities were also found to be subtle structure dependent, as seen in cases where COEs exhibit different antimicrobial efficacy or cytotoxicity but a similar degree of cell association. Changes in terminal alkyl chains of COEs have more significant impacts on MIC and cytotoxicity compared to changes in linker lengths. Although the mechanism underlying this observation is not clear, the data suggest the presence of poorly understood specific interactions that warrant further investigation. The optimal structure within the series of COEs studied here was found to be COE2-3C-C4butyl based on its highest IC50/MIC value and minimal hemolytic activity. It is worth noting that this conclusion is specific for tested cell types. Importantly, COE2-3C-C4butyl also shows bactericidal activity against E. coli K12. These findings provide indications on how to strategically design antimicrobial COEs with low mammalian cell cytotoxicity based on the distyrylbenzene framework.Experimental section
Minimum inhibitory concentration experiments
MICs were determined using broth microdilution method.33 Prior to MIC experiment, bacterial strains were plated out for single colonies on agar plates from frozen glycerol stocks stored at −80 °C. E. coli K12 (ATCC 47076) from a single colony on agar plate was inoculated in LB medium (10 g L−1 bactotryptone, 5 g L−1 yeast extract, and 10 g L−1 NaCl) and cultured at 37 °C with 200 rpm shaking for 5 hours before use. Based on optical density at 600 nm, bacteria suspensions were diluted to the concentration around 1 × 10⁶ cells per mL. Compound solutions were added to sterile 96-well plates and further diluted with 2-fold dilution successively. Later, by adding the bacteria suspensions with the same volume, the final concentrations of compound ranged from 0.5 to 128 μg mL−1 and the final concentration of bacteria suspension was 5 × 10⁵ cells per mL. The assay plates were incubated at 37 °C with 200 rpm shaking overnight. A group with no compound treatment was set as a negative control and a group with no bacteria was set as background. OD600 of the assay plates were measured on a plate reader (Tecan Spark 10M Multimode). The MICs were read as the lowest treatment concentration where less than 10% relative growth (treatment group relative to control) was found. A commercially available antibiotic, colistin, was used as a positive control and the MIC toward E. coli K12 was measured to be 1 μg mL−1, which is in accordance with what is reported in the literature.34 Experiments were performed with biological replicates.Mammalian cell viability assay
Cellular cytotoxicity was assessed using an MTT viability assay. HepG2 (ATCC HB-8065) cells were seeded at 1 × 10⁴ cells per well in 96-well plates overnight at 37 °C in Dulbecco's Modified Eagle's medium (DMEM, Gibco, GlutaMAX™) supplemented with 10% fetal bovine serum (FBS, Gibco, USDA-approved regions) before use. Compounds were serially diluted with 2-fold dilution in PBS and further diluted in culture media to afford a concentration ranging from 2 to 128 μg mL−1 and containing 10% PBS (v/v) each. For tests with higher concentration of compounds, compound stock solutions were prepared in DMSO and diluted in culture media to obtain a concentration ranging from 128 to 1024 μg mL−1 and maintain the final DMSO concentration to be less than 1%. The previous culture media were replaced with 100 μL of treatment solutions per well, the assay plates were incubated at 37 °C with 5% CO2. After 24 hours of incubation, cells were washed with PBS before adding 100 μL of fresh culture media and 10 μL of a 5 mg mL−1 solution of 3-(4,5-dimethylthiazol-2-yl)-2,5-diphenyltetrazolium bromide (MTT, Thermofisher Scientific) to each well. After incubation for 2–4 hours, 100 μL of DMSO as solubilizing solution was added to each well, and absorbance at 570 nm were measured on a plate reader (Tecan Spark 10M Multimode). Percent viability was determined by dividing background-corrected absorbance measurements by background-corrected measurements for untreated cells. The percentage of cell viability was plotted against the concentration of COE (Fig. S2†) and IC50 values were determined by curve-fitting (Fig. S1†).Hemolytic activity
Fresh CD-1 mouse red blood cells (IC05-3054, Innovative Research, Inc.) were washed with PBS for three times with centrifuge at 500 × g for 5 minutes. The pellet was resuspended to yield a 5% (v/v) suspension in PBS. 160 μL of compound solutions were added to a conical bottom 96-well plate as triplicates and dilute with 2-fold dilution sequentially. A 40 μL portion of 5% red blood cell solution was added to each well of the 96-well plate. The final concentration of compounds ranged from 16 to 1024 μg mL−1 and the final concentration of the red blood cells was 1%. Red blood cells with PBS alone was used as a negative control and with 1% Triton X-100 (Sigma-Aldrich) treatment as a positive control. After incubation for 1 hour at 37 °C, cells were centrifuged at 800 × g. A 100 μL portion of the resulting supernatant was transferred to a flat-bottomed 96-well plate and analysed on a microplate reader via absorbance measurements at 450 nm. Percent hemolysis was determined by dividing background-corrected absorbance by background-corrected absorbance with 1% Triton X-100 treatment. The percentage of hemolysis was plotted against the concentration of COE (Fig. S3†).Cell association experiments
Cell association experiments were performed in both Gram-negative bacteria (E. coli K12, ATCC 47076) and mammalian cells (HepG2, ATCC HB-8065). In these experiments, the stock solution of COEs were prepared directly with Hank's Balanced Salt Solution with no calcium and magnesium (HBSS, Gibco). Specific protocols for each cell type are described as follows:Time-kill kinetics
E. coli K12 (ATCC 47076) from a single colony on agar plate was inoculated in LB medium and cultured at 37 °C and 200 rpm shaking for around 4 hours before use. The bacteria suspension was diluted in LB to afford an OD600 value to be around 0.15. The diluted bacteria suspension was then challenged with COE2-3C-C4butyl at 10× MIC (40 μg mL−1) and 4× MIC (16 μg mL−1) respectively in culture tubes at 37 °C and 280 rpm shaking. Bacteria suspension without treatment was used as a control. At intervals, 100 μL aliquots from each sample were diluted with 10-fold serial dilution in PBS and were further plated on LB agar plates with 100 μL inoculation. After overnight incubation at 37 °C, colonies were counted and cfu per mL was calculated. Experiments were performed in triplicate.Conflicts of interest
The authors own a related patent filed as PCT/US19/23411. This patent belongs to University of California, Santa Barbara.Acknowledgements
This work was supported by the Institute of Collaborative Biotechnologies through grant W911NF-09-0001 from the U.S. Army Research Office by the University of California, Santa Barbara Office of Research, and by the National University of Singapore start up grant R143-000-A97-133. The authors acknowledge the use of the Biological Nanostructures Laboratory within the California NanoSystems Institute, supported by the University of California, Santa Barbara and the University of California, Office of the President. J. L. is grateful for the support from DPST Scholarship by the Institute for Promotion of Teaching Science and Technology, Thailand.References
- J. O'Neill, Tackling drug-resistant infections globally: final report and recommendations, The review on antimicrobial resistance, London, 2016 Search PubMed.
- M. R. L. Stone, M. S. Butler, W. Phetsang, M. A. Cooper and M. A. T. Blaskovich, Trends Biotechnol., 2018, 36, 523–536 CrossRef CAS PubMed.
- S. C. Davies, T. Fowler, J. Watson, D. M. Livermore and D. Walker, Lancet, 2013, 381, 1606–1609 CrossRef.
- H. Gelband and R. Laxminarayan, Trends Microbiol., 2015, 23, 524–526 CrossRef CAS PubMed.
- I. Torjesen, BMJ, 2013, 346, f1597 CrossRef PubMed.
- T. B. Nielsen, E. P. Brass, D. N. Gilbert, J. G. Bartlett and B. Spellberg, N. Engl. J. Med., 2019, 381, 503–505 CrossRef PubMed.
- J. R. Fitchett, Lancet Infect. Dis., 2015, 15, 1125–1127 CrossRef PubMed.
- M. Perros, Science, 2015, 347, 1062–1064 CrossRef CAS PubMed.
- T. F. Schäberle and I. M. Hack, Trends Microbiol., 2014, 22, 165–167 CrossRef PubMed.
- H. Cho, T. Uehara and T. G. Bernhardt, Cell, 2014, 159, 1300–1311 CrossRef CAS PubMed.
- K. Kimura and T. D. H. Bugg, Nat. Prod. Rep., 2003, 20, 252–273 RSC.
- R. G. Panchal, R. L. Ulrich, D. Lane, M. M. Butler, C. Houseweart, T. Opperman, J. D. Williams, N. P. Peet, D. T. Moir, T. Nguyen, R. Gussio, T. Bowlin and S. Bavari, Antimicrob. Agents Chemother., 2009, 53, 4283–4291 CrossRef CAS PubMed.
- K. Ishiguro, S. Sakiyama, K. Takahashi and T. Arai, Biochemistry, 1978, 17, 2545–2550 CrossRef CAS PubMed.
- T. K. Mukhtar and G. D. Wright, Chem. Rev., 2005, 105, 529–542 CrossRef CAS PubMed.
- C. R. Bourne, Antibiotics, 2014, 3, 1–28 CrossRef PubMed.
- Y. Wang, S. D. Jett, J. Crum, K. S. Schanze, E. Y. Chi and D. G. Whitten, Langmuir, 2013, 29, 781–792 CrossRef CAS PubMed.
- D. Liu, S. Choi, B. Chen, R. J. Doerksen, D. J. Clements, J. D. Winkler, M. L. Klein and W. F. DeGrado, Angew. Chem., Int. Ed., 2004, 43, 1158–1162 CrossRef CAS PubMed.
- S. Choi, A. Issacs, D. Clements, D. Liu, H. Kim, R. W. Scott, J. D. Winkler and W. F. DeGrado, Proc. Natl. Acad. Sci. U.S.A., 2009, 106, 6968–6973 CrossRef CAS PubMed.
- C. Ghosh and J. Haldar, ChemMedChem, 2015, 10, 1606–1624 CrossRef CAS PubMed.
- F. Nederberg, Y. Zhang, J. P. K. Tan, K. Xu, H. Wang, C. Yang, S. Gao, X. D. Guo, K. Fukushima, L. Li, J. L. Hedrick and Y.-Y. Yang, Nat. Chem., 2011, 3, 409–414 CrossRef CAS PubMed.
- J. G. Hurdle, A. J. O'Neill, I. Chopra and R. E. Lee, Nat. Rev. Microbiol., 2011, 9, 62–75 CrossRef CAS PubMed.
- H. Yan, C. Catania and G. C. Bazan, Adv. Mater., 2015, 27, 2958–2973 CrossRef CAS PubMed.
- L. E. Garner, J. Park, S. M. Dyar, A. Chworos, J. J. Sumner and G. C. Bazan, J. Am. Chem. Soc., 2010, 132, 10042–10052 CrossRef CAS PubMed.
- B. Wang, S. L. Fronk, Z. D. Rengert, J. Limwongyut and G. C. Bazan, Chem. Mater., 2018, 30, 5836–5840 CrossRef CAS.
- H. Yan, Z. D. Rengert, A. W. Thomas, C. Rehermann, J. Hinks and G. C. Bazan, Chem. Sci., 2016, 7, 5714–5722 RSC.
- J. Hinks, Y. Wang, W. H. Poh, B. C. Donose, A. W. Thomas, S. Wuertz, S. C. J. Loo, G. C. Bazan, S. Kjelleberg, Y. Mu and T. Seviour, Langmuir, 2014, 30, 2429–2440 CrossRef CAS PubMed.
- E. Strandberg, S. Esteban-Martín, A. S. Ulrich and J. Salgado, Biochim. Biophys. Acta Biomembr., 2012, 1818, 1242–1249 CrossRef CAS PubMed.
- C. Zhou, G. W. N. Chia, J. C. S. Ho, T. Seviour, T. Sailov, B. Liedberg, S. Kjelleberg, J. Hinks and G. C. Bazan, Angew. Chem., Int. Ed., 2018, 57, 8069–8072 CrossRef CAS PubMed.
- A. L. Niles, R. A. Moravec and T. L. Riss, Expet Opin. Drug Discov., 2008, 3, 655–669 CrossRef CAS PubMed.
- H. Yamamura, A. Miyagawa, H. Sugiyama, K. Murata, T. Mabuti, R. Mitsuhashi, T. Hagiwara, M. Nonaka, K. Tanimoto and H. Tomita, ChemistrySelect, 2016, 1, 469–472 CrossRef CAS.
- J. Hoque, M. M. Konai, S. S. Sequeira, S. Samaddar and J. Haldar, J. Med. Chem., 2016, 59, 10750–10762 CrossRef CAS PubMed.
- T. Wieprecht, M. Dathe, E. Krause, M. Beyermann, W. L. Maloy, D. L. MacDonald and M. Bienert, FEBS Lett., 1997, 147, 135–140 CrossRef.
- I. Wiegand, K. Hilpert and R. E. W. Hancock, Nat. Protoc., 2008, 3, 163–175 CrossRef CAS PubMed.
- N. S. Sundaramoorthy, P. Suresh, S. S. Ganesan, A. GaneshPrasad and S. Nagarajan, Sci. Rep., 2019, 9, 19845 CrossRef CAS.
Footnote |
| † Electronic supplementary information (ESI) available: Detailed experimental methods, supporting figures and NMR spectra. See DOI: 10.1039/d0sc03679j |
| This journal is © The Royal Society of Chemistry 2020 |

