 Open Access Article
An experimental approach for controlling confinement effects at catalyst interfaces†
Thierry K.
Slot
 a,
Nathan
Riley
a,
N. Raveendran
Shiju
a,
Nathan
Riley
a,
N. Raveendran
Shiju
 a,
J. Will
Medlin
 b and
Gadi
Rothenberg
 *a
*a
aVan 't Hoff Institute for Molecular Sciences, University of Amsterdam, Science Park 904, Amsterdam 1098 XH, The Netherlands. E-mail: g.rothenberg@uva.nl
bDepartment of Chemical and Biological Engineering, University of Colorado Boulder, Jennie Smoly Caruthers Biotechnology Building, 3415 Colorado Avenue, Boulder, Colorado 80303, USA
First published on 11th September 2020
Abstract
Catalysts are conventionally designed with a focus on enthalpic effects, manipulating the Arrhenius activation energy. This approach ignores the possibility of designing materials to control the entropic factors that determine the pre-exponential factor. Here we investigate a new method of designing supported Pt catalysts with varying degrees of molecular confinement at the active site. Combining these with fast and precise online measurements, we analyse the kinetics of a model reaction, the platinum-catalysed hydrolysis of ammonia borane. We control the environment around the Pt particles by erecting organophosphonic acid barriers of different heights and at different distances. This is done by first coating the particles with organothiols, then coating the surface with organophosphonic acids, and finally removing the thiols. The result is a set of catalysts with well-defined “empty areas” surrounding the active sites. Generating Arrhenius plots with >300 points each, we then compare the effects of each confinement scenario. We show experimentally that confining the reaction influences mainly the entropy part of the enthalpy/entropy trade-off, leaving the enthalpy unchanged. Furthermore, we find this entropy contribution is only relevant at very small distances (<3 Å for ammonia borane), where the “empty space” is of a similar size to the reactant molecule. This suggests that confinement effects observed over larger distances must be enthalpic in nature.
Introduction
In 1884, Van't Hoff realized that an energy term is associated with every chemical transition.1 Some years later, Arrhenius developed this further, defining the empirical relation between reaction rate and temperature in what is known today as the Arrhenius equation (eqn (1)). This empirical relation describes most chemical reactions well.2 Yet though the equation itself is simple, its chemical meaning is elusive. This is especially true for the nefarious pre-exponential factor. The energy of activation typically corresponds to the barrier needed to cross the transition state threshold along the reaction coordinate. But the pre-exponential factor is somewhat of a theoretical embarrassment. All we know about it is that it comes before an exponent, and that its value is roughly 1012–1014 s−1. | (1) |
This has not gone unnoticed. In the 1930s, Eyring and Polanyi laid the foundation for what would become transition-state theory.3–6 They coupled both the activation energy and the pre-exponential factor to relatively simple first principles. The Eyring equation assigns the pre-exponential factor as kBT/h, corresponding to the frequency at which the reactants cross the transition state barrier. These models were developed further at different levels of theory, generally concluding that the predominant factor contributing to the Arrhenius pre-exponential factor is entropy.7,8
Yet there is a catch: the models pertain to reactions in the fluid (typically gas) phase, describing collisions between molecules in a homogeneous environment.9 The situation is different for reactions at surfaces, where the most common mechanism follows the Langmuir–Hinshelwood pathway of reactant adsorption, surface reaction, and product desorption.10,11 Treating the pre-exponential factor in heterogeneous catalysis as a collision frequency factor is too simplistic. In most heterogeneous catalysts, the active sites take up only a small percentage of the surface. This means that the travel of the reactants across the surface to the active site cannot be ignored.12 Our goal is to isolate this travel step by sterically confining a reaction that follows the Langmuir–Hinshelwood pathway. By placing barriers at different distances, we hope to understand how much space a heterogeneous reaction needs in relation to the reactant's size.
Results and discussion
We used a novel synthetic approach to create confinement at different distances from the active site. As our benchmark reaction, we chose the platinum-catalysed hydrolysis of ammonia borane (eqn (2)). This reaction produces large amounts of hydrogen gas even in the presence of small amounts of catalyst, whereas the background reaction (using only the γ-alumina support) is negligible. The hydrogen production is easily and accurately monitored by our novel bubble counter.13 This device can monitor volume step sizes down to 8–12 μL, enabling a very detailed and precise kinetic analysis. Another advantage of this hydrolysis is that its partial reaction order in ammonia borane is very low (typically 0.1–0.2). This small dependence of the reaction rate on the concentration means that we can obtain reliable kinetic and thermodynamic data from a single experiment. The low partial reaction order suggests a complex mechanism. Experimental data illustrates that in such cases, the reaction still obeys the exponential Arrhenius relation. This is because the slowest reaction step(s) dictate the observed activation energy, provided there are no mass transport limitations. Ammonia borane hydrolysis follows a Langmuir–Hinshelwood mechanism, with O–H cleavage as the rate-determining step (the exact surface species is unknown).14–21 | (2) |
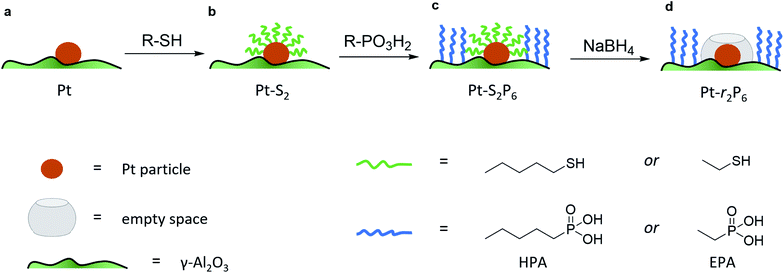
To isolate the contribution of the pre-exponential factor in this catalytic system, we prepared a series of supported Pt catalysts in stages (small Pt particles, <4 nm, were successfully used in other confinement strategies22,23). First, a platinum precursor was impregnated on γ-Al2O3 using incipient wetness impregnation. This was then dried, calcined and reduced to give metallic Pt nanoparticles on alumina (see Fig. 1a and inset in Fig. 2). A portion of these catalysts were then coated with a monolayer of alkane thiol (Fig. 1b), which functions as a template for the next step: coating the alumina support surface with organophosphonic acids (Fig. 1c). The organophosphonic acids cover the entire alumina surface with a self-assembled monolayer, forming a hydrophobic coating of alkyl chains.24–27 Finally, the thiol template was removed by reduction,28,29 leaving a free zone around the platinum nanoparticle (Fig. 1d).
This approach combines the advantages of both spatial and chemical control around the active site. We can constrain the area around the active site in two dimensions. Further, by using phosphonic acids with organic residues of different lengths, we can obtain coatings of different thicknesses. Similarly, the length of the organic residue on the thiol hypothetically dictates the radius of the resulting “free spaces” (see Fig. 1d).
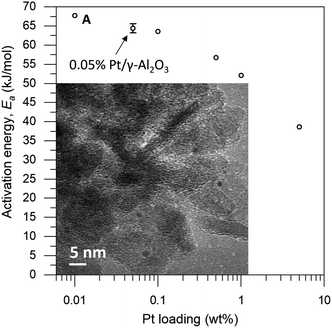
The loading of platinum on γ-Al2O3 is another important factor.30–32 On one hand, we want this loading to be as low as possible, because the particle size needs to be small compared to the coating. On the other hand, we must have sufficient Pt on the surface to have enough reactivity for monitoring the reaction. We therefore ran a series of control experiments using catalysts with different Pt loadings to test the influence of the loading on the observed energy of activation (Ea, see Fig. 2). High loadings result in low Ea values, due to the large particle size and additional mass transfer effects. As the Pt loading decreases, the activation energy increases gradually, starting from 40 kJ mol−1 and levelling off towards 65 kJ mol−1 as the particles approach their lower size limit. At 0.05 wt% Pt we reach the “sweet spot”, where the reaction rate is still high enough to observe and the activation energy remains fairly constant. Repeat experiments gave a standard deviation of only 0.8 kJ mol−1 in Ea, confirming the precision of our measurements. Mass-transfer effects are expected to be negligible at low Pt concentration because the particles are farther apart, reducing neighbour interference. This means that the subtle changes in activation energy are likely related to the particle's size and type of exposed facets.33–35 Furthermore, this low loading ensures the formation of uniform small particles. We did not expect the active sites to be single Pt atoms, as the activation energy still increases when the loading is reduced even further (see point “A” in Fig. 2).36 This was confirmed by transmission electron microscopy measurements of the 0.05 wt% Pt/γ-Al2O3 catalyst, which showed spherical particles, 2–3 nm in diameter (Fig. 2, inset).
Next, we studied the influence of the PA coating thickness. Batches of 0.05 wt% Pt/γ-Al2O3 were coated with methyl-, ethyl-, hexyl-, and octadecyl phosphonic acid (the detailed results are included in Fig. S1 in the ESI†). With increasing phosphonic acid length, the reaction rate decreases. The PA should be long enough to form a hydrophobic barrier, yet short enough so that it doesn't cover the Pt particle. We selected hexyl phosphonic acid (HPA) as it is sufficiently large compared to the expected Pt particle size, and has a significant influence on the reaction (it reduces the reaction rate ten-fold, see Fig. S1†). Pentane thiol was selected as the thiol. Our hypothesis was that since this thiol is roughly twice the size of ammonia borane, its removal should give ample ‘empty space’ for the reaction to proceed.
To prove that we can indeed make this empty space around our particle, we tested whether our catalysts would regain their normal catalytic activity after the thiol coating is removed. Fig. 3 shows the Arrhenius plots for catalysts (a), (b), (c) and (d), when using pentane thiol and hexylphosphonic acid. These plots are highly precise – each Arrhenius curve represents >3000 individual experimental measurements.13 The turnover frequency (TOF) is calculated by dividing the reaction rate (mmol AB per s) by the metal loading (mmol Pt; the resulting TOF values and corresponding pre-exponential values are somewhat underestimated because not all Pt is available for reaction). The black curve (a) shows the Arrhenius plot for the plain Pt/Al2O3 catalyst. Upon binding of the thiol (b, red curve) the catalytic activity drops.37–41 At low temperature, the slope of the Arrhenius plot is similar to that of the uncoated catalyst. At higher temperature the slope seems to increase, but this is likely an artefact caused by in situ thiol removal due to the reductive nature of the reaction.42 Next, the phosphonic acid coating is applied, decreasing the catalytic activity even more (c, green curve). The presence of the phosphonic acid groups on the alumina surface was verified by FTIR (see Fig. S3†). Finally, when we remove the thiol using a mild reduction with sodium borohydride, the catalytic activity returns to the level of the pristine material (d, blue curve). This supports our hypothesis of an ‘empty space’ surrounding the active site. Curiously, at higher temperatures the slope of the Arrhenius plot is slightly reduced compared to the uncoated catalyst (cf. curves (d) and (a) in Fig. 3). This could reflect a change in activation energy, yet we expect no chemical change in the system. A more likely explanation is that the reaction rate is restricted by diffusion limitations around the active site.
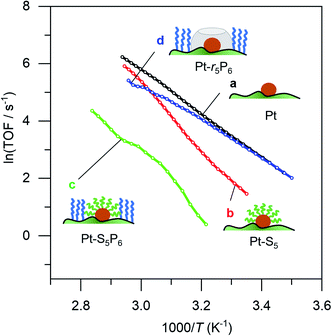 | ||
| Fig. 3 Catalytic effect of coating procedure: (a) 0.05% Pt/γAl2O3, (b) pentane thiol coating, (c) both pentane thiol coating and phosphonic acid coating and (d) the “free space”-catalyst after removal of the thiol. Each data point represents a window average of 10–50 measurements using equal time interpolation (see ESI† for more details). | ||
We then ran a systematic study comparing the effects of short and long thiols and short and long organophosphonic acids. Think of the organophosphonic acid as forming a fence around the space left by the thiol. These binary options result in four different catalyst combinations: {high fence, large space}, {high fence, small space}; {low fence, large space}; and {low fence, small space}. Each of these catalysts requires three synthesis steps, resulting in a total of 13 different catalysts (there are three “duplicates”; for an overview of the synthesis scheme see Fig. S2†). Our hypothesis was that ammonia borane will experience confinement effects differently in the four different catalyst combinations, and that these would result in different Ea and A values.
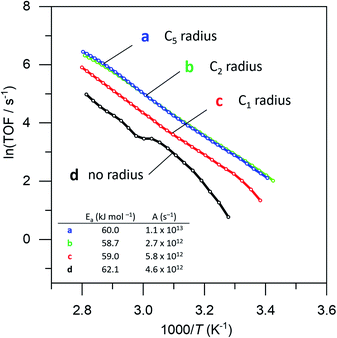
Surprisingly, there was no significant difference between the four different “free space” catalysts (cf.Fig. 4, curves (b–e)). Ammonia borane hydrolysis was not hindered by any of these confinement regimes. We concluded that the hydrolysis of ammonia borane needs less than 0.5 nm of free space around the Pt active site. To test this hypothesis, we ran the reaction yet again, this time coating the Pt particles with methane thiol, the smallest thiol. The same synthesis procedure was repeated with both EPA and HPA. Interestingly, this catalyst did show a difference between the different “free space” combinations (cf. the red curve c with the blue and green curves (a) and (b) in Fig. 5). Curve (d) in Fig. 5 shows a bend that may reflect a change in activation energy, likely because of AB diffusion through the HPA tails, which become more mobile at higher temperatures.
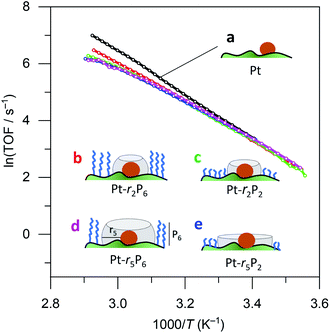 | ||
| Fig. 4 Catalytic data for (a) 0.05% Pt/γAl2O3, and coated catalysts: (b) large fence – small radius, (c) small fence – small radius, (d) large fence – large radius, and (e) small fence – large radius. Each data point represents a window average of 10–50 measurements using equal time interpolation (see ESI† for full Experimental details). | ||
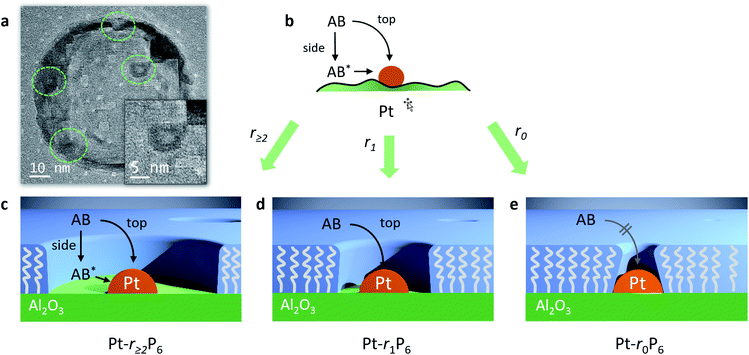
Based on these experimental results, we can now assign a clearer chemical meaning to the pre-exponential factor for reactions at surfaces. Reactant molecules can adsorb on the surface at any random point (Fig. 6b). They can then travel to the active site, where they may or may not react, depending on their energy and configuration.43,44 The measured reaction rate is an average of these {adsorption + travel + reaction} combinations, where the direct adsorption can be seen as a pathway with zero travel.
We were able to observe these “free space” structures by transmission electron microscopy. We observed several Pt nanoparticles that are surrounded by a clear area (Fig. 6a and S4†). These structures are only observable for a few seconds, because the electron beam destroys the organic material.45–47 The Pt particle size is about 3.9 nm and the free space has a width of about 1.2–1.8 nm. Pentane thiol has a length of about 1.0 nm, so the templating effect by the thiol is about 1.5 times larger than anticipated. Likely, the thiol tails orient incoming phosphonic acid molecules away from the alumina surface when their apolar regions bind together, accounting for the larger radius. Following the AB hydrolysis in the confined space directly using in situ FTIR failed (data not shown), likely because the number of Pt-bound molecules is too small compared to the other species in the reaction mixture.
To probe the confinement effect further, we ran additional experiments on the dehydrogenation of ammonia borane under water-free conditions. This reaction produces oligomeric intermediates of increasing size,48–50 which should show a reduced rate when the products start exceeding the size of the confined space. The Arrhenius plots for these reactions (Fig. S5†) are curved, because of the complex mechanism and changing rate-determining steps. Indeed, the Pt-r5P6 catalyst (with a radius of 5) was more active than the thiol-coated catalyst at the beginning of the reaction, but later reduced to an activity similar to that of the fully restricted catalyst, likely due to the increasing size of the reacting intermediates. These results give further evidence of the confinement effect.
Importantly, our experiments allow the direct observation of the effect of confining the active sites on the Arrhenius plot.51 The reaction rates decrease, yet the slopes (i.e., the activation energies, Fig. 5, table inset) remain nearly identical in each case. This shows that the confinement only affects the pre-exponential factor, which reduces from 1.1 × 10¹³ s−1 to 0.46 × 10¹³ s−1, corresponding to a decrease in ΔS of 7.3 J K−1. It doesn't change the chemical environment of the transition state. To the best of our knowledge, this is the first experimental demonstration of this effect for reactions at surfaces. If we associate the energy of activation with the reaction enthalpy, we see that the pre-exponential factor gives an entropy contribution that is closely related to the reactant's approach to the active site. We propose two pathways: “from the top” and “from the side” (see Fig. 6b). In a normal (uncoated) catalyst, both pathways contribute to the catalytic activity. However, when the free space around the active site is too small for the reactant to adsorb, only the “top” pathway is possible. Our experiments allow the quantification of the distance needed for the “side” pathway. In the case of ammonia borane, a gap of roughly 0.75 nm (derived from the size of the Pt-bound EPA molecule) already allows the hydrolysis to proceed at a rate similar to that of a totally unconstrained catalyst. Considering that the kinetic diameter of ammonia borane is similar to that of ethane (0.44 nm), and that the radius of the free space is about 1.5 times larger, this shows that the remaining gap of <3 Å between the molecule and the “fence” suffices to completely negate the confinement effect.
These findings also have more general implications for catalysts that feature confinement.52–55 Confinement effects observed for enzymes and zeolite cages (which can feature much larger gaps) are typically a trade-off between enthalpy and entropy contributions.56,57 For example, transition states are enthalpically stabilized in tight zeolite pores, but entropically destabilized. Our experiments separate the two contributions, and show that the entropy contribution to confinement is relevant only at very small distances. This means that confinement effects observed in larger systems have a much larger enthalpy contribution.
Conclusion
The kinetics of catalytic reactions at surfaces involve four steps: reactant adsorption, surface travel, surface reaction, and product desorption. Using a new method to synthesize heterogeneous catalysts with well-defined “free space” surrounding active metal nanoparticles at varying degrees of confinement, we created four distinct tiers of confined Pt/Al2O3 catalysts. We then ran precise kinetic measurements of the Pt-catalysed hydrolysis of ammonia borane, thereby isolating the contribution of the surface travel step. Our results give important insights regarding the practical ratio between the size of the reactant molecule and the size of the confined space, showing that traditional confinement effects are due to electronic interactions. Moreover, we demonstrate that the surface travel step is primarily reflected in the pre-exponential factor, leaving the activation energy unchanged. Thus, we show experimentally that for reactions at surfaces that follow the Langmuir–Hinshelwood model, the Arrhenius pre-exponential factor describes the travel across the surface, playing an analogous role to that of substrate orientation and collision cross-section in the fluid phase.Conflicts of interest
There are no conflicts to declare.Acknowledgements
We thank Dr E. Oksenberg for running the TEM measurements. T. K. S. was supported by NWO TOP-PUNT project Catalysis in Confined Spaces (grant 718.015.004). J. W. M. acknowledges support from the Department of Energy, Office of Science, Basic Energy Sciences Program, Chemical Sciences, Geosciences, and Biosciences Division. G. R. thanks Prof. A. Ben-Shaul (Hebrew University of Jerusalem) for discussions.References
- M. J. H. van't Hoff, Recl. Trav. Chim. Pays-Bas, 1884, 3, 333–336 CrossRef.
- L. Xing, Z. Peng, W. Li and K. Wu, Acc. Chem. Res., 2019, 52, 1048–1058 CrossRef CAS.
- H. Eyring and M. Polanyi, Z. Phys. Chem., Abt. B, 1931, 12, 279 CAS.
- M. G. Evans and M. Polanyi, Trans. Faraday Soc., 1935, 31, 875 RSC.
- H. Eyring, J. Chem. Phys., 1935, 3, 107–115 CrossRef CAS.
- W. F. K. Wynne-Jones and H. Eyring, J. Chem. Phys., 1935, 3, 492–502 CrossRef CAS.
- P. Hänggi, P. Talkner and M. Borkovec, Rev. Mod. Phys., 1990, 62, 251–341 CrossRef.
- A. H. Zewail, J. Phys. Chem., 1996, 100, 12701–12724 CrossRef CAS.
- J. C. Light, J. Ross and K. E. Shuler, in Kinetic Processes in Gases and Plasmas, ed. A. R. Hochstim, Academic Press, 1969, pp. 281–320 Search PubMed.
- J. K. Nørskov, T. Bligaard, B. Hvolbæk, F. Abild-Pedersen, I. Chorkendorff and C. H. Christensen, Chem. Soc. Rev., 2008, 37, 2163–2171 RSC.
- K. J. Laidler, J. H. Meiser and B. C. Sanctuary, Physical Chemistry, Houghton Mifflin, 2002 Search PubMed.
- L. Fang, B. Albela, B. Yang, Y. Zheng, P. Wu, M. He and L. Bonneviot, Langmuir, 2018, 34, 12713–12722 CrossRef CAS.
- T. K. Slot, N. R. Shiju and G. Rothenberg, Angew. Chem., Int. Ed., 2019, 58, 17273–17276 CrossRef CAS.
- W. Chen, D. Li, Z. Wang, G. Qian, Z. Sui, X. Duan, X. Zhou, I. Yeboah and D. Chen, AIChE J., 2017, 63, 60–65 CrossRef CAS.
- K. Feng, J. Zhong, B. Zhao, H. Zhang, L. Xu, X. Sun and S.-T. Lee, Angew. Chem., Int. Ed., 2016, 55, 11950–11954 CrossRef CAS.
- Q. Wang, F. Fu, S. Yang, M. Martinez Moro, M. d. l. A. Ramirez, S. Moya, L. Salmon, J. Ruiz and D. Astruc, ACS Catal., 2019, 9, 1110–1119 CrossRef CAS.
- F. Fu, C. Wang, Q. Wang, A. M. Martinez-Villacorta, A. Escobar, H. Chong, X. Wang, S. Moya, L. Salmon, E. Fouquet, J. Ruiz and D. Astruc, J. Am. Chem. Soc., 2018, 140, 10034–10042 CrossRef CAS.
- L. Wang, H. Li, W. Zhang, X. Zhao, J. Qiu, A. Li, X. Zheng, Z. Hu, R. Si and J. Zeng, Angew. Chem., Int. Ed., 2017, 56, 4712–4718 CrossRef CAS.
- T. Banu, T. Debnath, T. Ash and A. K. Das, J. Chem. Phys., 2015, 143, 194305 CrossRef.
- L.-L. Long, X.-Y. Liu, J.-J. Chen, J. Jiang, C. Qian, G.-X. Huang, Q. Rong, X. Zhang and H.-Q. Yu, ACS Appl. Nano Mater., 2018, 1, 6800–6807 CrossRef CAS.
- Y. Li, M. Hu, J. Wang and W.-H. Wang, J. Organomet. Chem., 2019, 899, 120913 CrossRef CAS.
- R. Vakili, E. K. Gibson, S. Chansai, S. Xu, N. Al-Janabi, P. P. Wells, C. Hardacre, A. Walton and X. Fan, ChemCatChem, 2018, 10, 4238–4242 CrossRef CAS.
- A. M. Lawal, A. Hart, H. Daly, C. Hardacre and J. Wood, Energy Fuels, 2019, 33, 5551–5560 CrossRef.
- P. Hao, D. K. Schwartz and J. W. Medlin, Appl. Catal., A, 2018, 561, 1–6 CrossRef CAS.
- T. Van Cleve, D. Underhill, M. Veiga Rodrigues, C. Sievers and J. W. Medlin, Langmuir, 2018, 34, 3619–3625 CrossRef CAS.
- P. Thissen, M. Valtiner and G. Grundmeier, Langmuir, 2010, 26, 156–164 CrossRef CAS.
- C. A. Schoenbaum, D. K. Schwartz and J. W. Medlin, Acc. Chem. Res., 2014, 47, 1438–1445 CrossRef CAS.
- E. W. Elliott, R. D. Glover and J. E. Hutchison, ACS Nano, 2015, 9, 3050–3059 CrossRef CAS.
- M. Yuan, S. Zhan, X. Zhou, Y. Liu, L. Feng, Y. Lin, Z. Zhang and J. Hu, Langmuir, 2008, 24, 8707–8710 CrossRef CAS.
- L. Bonneviot and G. L. Haller, J. Catal., 1991, 130, 359–373 CrossRef CAS.
- Y. Cao, W. Fu, Z. Sui, X. Duan, D. Chen and X. Zhou, Ind. Eng. Chem. Res., 2019, 58, 1888–1895 CrossRef CAS.
- V. Oestreicher, C. Huck-Iriart, G. Soler-Illia, P. C. Angelomé and M. Jobbágy, Chem.–Eur. J., 2020, 26, 3157–3165 CrossRef CAS.
- I. Chorkendorff and J. W. Niemantsverdriet, Concepts of Modern Catalysis and Kinetics, John Wiley & Sons, 2017 Search PubMed.
- Y. Takasu, T. Akimaru, K. Kasahara, Y. Matsuda, H. Miura and I. Toyoshima, J. Am. Chem. Soc., 1982, 104, 5249–5250 CrossRef CAS.
- W. Chen, J. Ji, X. Feng, X. Duan, G. Qian, P. Li, X. Zhou, D. Chen and W. Yuan, J. Am. Chem. Soc., 2014, 136, 16736–16739 CrossRef CAS.
- F. R. Lucci, J. Liu, M. D. Marcinkowski, M. Yang, L. F. Allard, M. Flytzani-Stephanopoulos and E. C. H. Sykes, Nat. Commun., 2015, 6, 1–8 Search PubMed.
- C.-H. Lien and J. W. Medlin, J. Catal., 2016, 339, 38–46 CrossRef CAS.
- K. R. Kahsar, D. K. Schwartz and J. W. Medlin, J. Am. Chem. Soc., 2014, 136, 520–526 CrossRef CAS.
- G. Kumar, T. Van Cleve, J. Park, A. van Duin, J. W. Medlin and M. J. Janik, Langmuir, 2018, 34, 6346–6357 CrossRef CAS.
- S. T. Marshall, M. O'Brien, B. Oetter, A. Corpuz, R. M. Richards, D. K. Schwartz and J. W. Medlin, Nat. Mater., 2010, 9, 853–858 CrossRef CAS.
- S. H. Pang, C. A. Schoenbaum, D. K. Schwartz and J. W. Medlin, Nat. Commun., 2013, 4, 1–6 Search PubMed.
- K. R. Kahsar, D. K. Schwartz and J. W. Medlin, J. Mol. Catal. A: Chem., 2015, 396, 188–195 CrossRef CAS.
- Y. Li, W. Cheng, Z.-J. Sui, X.-G. Zhou, D. Chen, W.-K. Yuan and Y.-A. Zhu, J. Phys. Chem. C, 2019, 123, 28275–28283 CrossRef CAS.
- J. Liu, C. Zhang, Z. Shen, W. Hua, Y. Tang, W. Shen, Y. Yue and H. Xu, Catal. Commun., 2009, 10, 1506–1509 CrossRef CAS.
- R. F. Egerton, Ultramicroscopy, 2013, 127, 100–108 CrossRef CAS.
- Z. J. W. A. Leijten, A. D. A. Keizer, G. de With and H. Friedrich, J. Phys. Chem. C, 2017, 121, 10552–10561 CrossRef CAS.
- D. T. Grubb, J. Mater. Sci., 1974, 9, 1715–1736 CrossRef CAS.
- W. J. Shaw, J. C. Linehan, N. K. Szymczak, D. J. Heldebrant, C. Yonker, D. M. Camaioni, R. T. Baker and T. Autrey, Angew. Chem., Int. Ed., 2008, 47, 7493–7496 CrossRef CAS.
- X. Zhang, L. Kam and T. J. Williams, Dalton Trans., 2016, 45, 7672–7677 RSC.
- W.-W. Zhan, Q.-L. Zhu and Q. Xu, ACS Catal., 2016, 6, 6892–6905 CrossRef CAS.
- L. Luza, A. Gual, J. A. Fernandes, D. Eberhardt and J. Dupont, Phys. Chem. Chem. Phys., 2019, 21, 16615–16622 RSC.
- V. Mouarrawis, R. Plessius, J. I. van der Vlugt and J. N. H. Reek, Front. Chem., 2018, 6, 623 CrossRef CAS.
- Q. Fu and X. Bao, Nat. Catal., 2019, 2, 834–836 CrossRef CAS.
- C. Cai, S. Han, W. Liu, K. Sun, L. Qiao, S. Li and X. Zu, Appl. Catal., B, 2020, 260, 118103 CrossRef CAS.
- S. Han, Y. Zhu, C. Cai, J. Zhu, W. Han, L. Chen, X. Zu, H. Yang and M. Gu, Appl. Phys. Lett., 2019, 114, 113901 CrossRef.
- R. Gounder and E. Iglesia, Acc. Chem. Res., 2012, 45, 229–238 CrossRef CAS.
- R. Gounder and E. Iglesia, Chem. Commun., 2013, 49, 3491–3509 RSC.
Footnote |
| † Electronic supplementary information (ESI) available. See DOI: 10.1039/d0sc04118a |
| This journal is © The Royal Society of Chemistry 2020 |

