 Open Access Article
A molecular approach to rationally constructing specific fluorogenic substrates for the detection of acetylcholinesterase activity in live cells, mice brains and tissues†
Xiaofeng
Wu‡
a,
Jong Min
An‡
b,
Jizhen
Shang‡
c,
Eugene
Huh‡
d,
Sujie
Qi
 a,
Eunhye
Lee
a,
Haidong
Li
a,
Eunhye
Lee
a,
Haidong
Li
 a,
Gyoungmi
Kim
a,
Huimin
Ma
a,
Gyoungmi
Kim
a,
Huimin
Ma
 c,
Myung Sook
Oh
 *e,
Dokyoung
Kim
 *bf and
Juyoung
Yoon
 *a
*a
aDepartment of Chemistry and Nanoscience, Ewha Womans University, Seoul 03760, Republic of Korea. E-mail: jyoon@ewha.ac.kr
bDepartment of Biomedical Science, Graduate School, Kyung Hee University, Seoul 02447, Republic of Korea
cBeijing National Laboratory for Molecular Sciences, Key Laboratory of Analytical Chemistry for Living Biosystems Institute of Chemistry, Chinese Academy of Sciences, Beijing 100190, China
dDepartment of Medical Science of Meridian, College of Korean Medicine, Graduate School, Kyung Hee University, Seoul 02447, Republic of Korea
eDepartment of Life and Nanopharmaceutical Sciences, Graduate School, Kyung Hee University, Seoul 02447, Republic of Korea
fDepartment of Anatomy and Neurobiology, College of Medicine, Kyung Hee University, Seoul 02447, Republic of Korea
First published on 22nd September 2020
Abstract
Acetylcholinesterase (AChE) is an extremely critical hydrolase tightly associated with neurological diseases. Currently, developing specific substrates for imaging AChE activity still remains a great challenge due to the interference from butyrylcholinesterase (BChE) and carboxylesterase (CE). Herein, we propose an approach to designing specific substrates for AChE detection by combining dimethylcarbamate choline with a self-immolative scaffold. The representative P10 can effectively eliminate the interference from CE and BChE. The high specificity of P10 has been proved via imaging AChE activity in cells. Moreover, P10 can also be used to successfully map AChE activity in different regions of a normal mouse brain, which may provide important data for AChE evaluation in clinical studies. Such a rational and effective approach can also provide a solid basis for designing probes with different properties to study AChE in biosystems and another way to design specific substrates for other enzymes.
Introduction
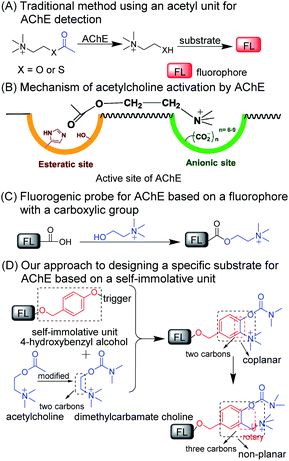
Acetylcholinesterase (EC 3.1.1.7; abbreviated AChE) is a kind of enzyme that can hydrolyze neurotransmitters (i.e., acetylcholine) into choline and plays a critical role in the central and peripheral nervous systems.1–3 AChE has been considered as the main cause of neurological disorders such as Alzheimer's disease and Parkinson's disease.4–6 Abnormal alterations in AChE activity may directly influence the function of the nervous system.6–9 Thus, specific detection of AChE activity is still of great importance to better elucidate the function of AChE in complicated living systems, AChE-related diagnoses, and drug discovery.9–12Currently, several analytical methods based on colorimetric assays,10,11 chemiluminescence,12 electrochemical sensors,13,14 nanoparticles,15 and supramolecular assemblies,16 have been engineered to probe AChE activity. Fluorescent probes combined with fluorescence confocal imaging with unique features,17–28 such as in situ and/or real-time detection, high spatiotemporal resolution and noninvasive monitoring abilities, have been extensively used in various disease diagnoses and therapies.29,30 Currently, fluorescent probes for AChE activity analysis employ acetyl groups as recognition units.31–39Scheme 1A shows that, in these methods, AChE converts acetylcholine or acetylthiocholine to choline or thiocholine, respectively, which will further react with additional substrates to generate fluorescence signals. This enzyme-induced cascade reaction seriously limits its application in living systems. Another inevitable drawback is that the current substrate (i.e., the acetyl group) for the detection for AChE activity always suffers from the interference of butyrylcholinesterase (BChE) and carboxylesterase (CE) due to their similar catalytic mechanism to that of AChE.40–42 Recently, two groups proposed fluorescent probes using the dimethyl-carbamate unit for the detection of AChE activity.43,44 However, this carbamate moiety may react with CE.45–47 Thus, developing a general fluorogenic substrate for the specific detection of AChE remains a great challenge. We noticed that, at the base of a long and narrow 20 Å gorge, two subunits consisted of the active site of AChE, an “esteratic” subsite containing the catalytic machinery, and an “anionic” subsite that can bind to the quaternary ammonium group, resulting in an increased affinity ability between AChE and the ammonium group (Scheme 1B).48,49 These data suggest that the two following criteria may be considered and incorporated into the design of a specific substrate toward AChE: (i) the substrate should have an alkylated ammonium group, and (ii) a distance of two or three C–C bonds should be kept between the ammonium group and the recognition moiety.2,48,49
The resulting key issue is determining how to connect and combine the recognition unit with a two- or three-carbon alkylated ammonium group to fluorophore in one molecule. One easy way to achieve this is to make such a probe for AChE by directly incorporating choline into a carboxylic acid-containing fluorophore (Scheme 1C). However, currently, few such fluorophores can achieve signal conversion before and after the reaction. Thus, we shift our attention to a self-immolative scaffold (i.e., 4-hydroxybenzyl alcohol) that has been used as an excellent linker connecting recognition units to fluorophores.50,51 As shown in Scheme 1D, the commonly used carbamate for AChE was employed to revise choline which could be incorporated into the self-immolative linker as a substrate for AChE and then this whole structure can be connected to a fluorophore. As such, the reactive moiety (i.e., carbamate), ammonium group and fluorophore can be integrated into one molecule and simultaneously it can match the aforementioned two criteria. To further reduce the rigidity of the molecule and to enhance interacting flexibility, a methylene group was set between the methylated ammonium group and ortho-carbon of phenolic hydroxy to enhance interacting flexibility. In addition, we also employed substrates with electron-donating and electron-withdrawing groups to tune the selectivity toward AChE for comparison.
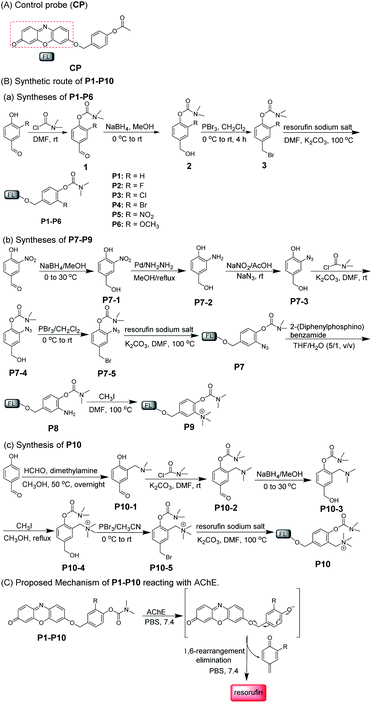
With this in mind, a control probe (CP) and probes 1–10 (P1–P10) were synthesized by incorporating the designed substrates into excellent fluorochrome resorufin bearing different substituents (Scheme 2A and B). The detection mechanism of the probes with AChE is based on the hydrolysis of dimethyl carbamate followed by 1,6-rearrangement-elimination, accompanied by the release of resorufin (Scheme 2C). The detailed syntheses, characterization, and photophysical properties of all the compounds are given in Table 1 and the ESI.†
| Compd | λ ex (nm) | ε (104) | λ em (nm) | Φ | ε × Φe | Compd | λ ex (nm) | ε (104) | λ em (nm) | Φ | ε × Φe |
|---|---|---|---|---|---|---|---|---|---|---|---|
| a Maximum absorbance peak. b Molar absorptivity of the corresponding absorbance peak (M−1 cm−1). c Emission peak. d Fluorescence quantum yield (QY, Φ) was measured using resorufin as a standard (Φ = 0.75 in deionized water)18 e Brightness = ε × Φ. All spectral properties were acquired in PBS buffer (pH 7.4). | |||||||||||
| CP | 480 | 1.03 | 582 | 0.006 | 61.8 | P6 | 475 | 1.50 | 582 | 0.009 | 135 |
| P1 | 480 | 1.14 | 582 | 0.020 | 228 | P7 | 480 | 0.88 | 582 | 0.005 | 44 |
| P2 | 479 | 0.95 | 582 | 0.018 | 171 | P8 | 475 | 1.51 | 582 | 0.003 | 45.3 |
| P3 | 485 | 0.84 | 582 | 0.011 | 92.4 | P9 | 480 | 2.13 | 582 | 0.008 | 170.4 |
| P4 | 477 | 1.34 | 582 | 0.020 | 268 | P10 | 478 | 2.30 | 582 | 0.008 | 184 |
| P5 | 480 | 1.16 | 582 | 0.013 | 150.8 | Resorufind | 571 | 5.69 | 582 | 0.75 | 42675 |
Results and discussion
Specificity of probes (CP and P1–P10) toward AChE
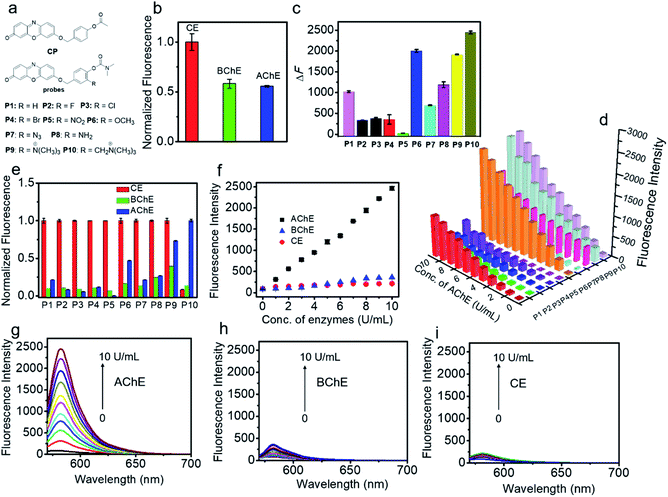
We first investigated the specificity of the probes (CP and P1–P10) toward AChE, BChE and CE. As shown in Fig. 1a and b, S1 and S2,† acetyl unit-containing CP can have a faster response to CE than BChE and AChE. Under the same conditions, the reaction of CP with CE has the highest fluorescence enhancement, and the fluorescence enhancement of CP with BChE is almost as the same as that of CP with AChE, clearly demonstrating that such AChE probes with the acetyl unit are interfered by CE and BChE. Thus, the acetyl unit is not suitable as a recognition moiety for selectively detecting the activity of AChE. Next, the reactivity of P1–P10 with different substituted units for AChE was tested. As shown in Fig. 1a, c, d, and S3,† except for P5, P1–P4 and P6–P10 all have different reactivities toward AChE, among which P10 displays the highest fluorescence intensity. Besides, compared to P1, P2–P8 having different electron-withdrawing and -donating groups show less or higher reactivity toward AChE. P9 and P10, which have methylated ammonium groups, also showed better reactivity with AChE than P1. Moreover, increased reactivity toward AChE and reduced reactivity toward CE were observed for P9, which indicates that methylated ammonium may play an important role in the control of probe specificity for AChE. In addition, by introducing a methylene group between the methylated ammonium group and the ortho-carbon of the phenolic hydroxyl group in P9, P10 shows better reactivity for AChE than P9. These data demonstrated that our design is rational and effective, and this observation may also provide and promote a better understanding of the design of reacting units for AChE detection. As seen in Fig. 1e–i, S3 and S4,† we further investigated the specificity of P1–P10 for AChE over BChE and CE. We found that P1–P9 have not only better reactivity toward AChE but also superior reactivity toward CE. However, surprisingly, P10 shows the best reactivity and specificity toward AChE, which can effectively eliminate interference from BChE and CE. Compared to the rigidity of P9, which reduces its specificity, the interacting flexibility of P10 indeed increases its specificity for AChE over BChE and especially CE.52 To better understand this difference between P9 and P10 in terms of specificity toward AChE, BChE and CE, kinetic parameters were measured. As shown in Fig. S5, Tables S1 and S2,†P10 shows a higher affinity and kinetic efficiency for AChE (Km = 4.87 μM; kcat/Km = 5.3 × 10⁴ s−1 M−1) than P9 (Km = 6.45 μM; kcat/Km = 3.7 × 10⁴ s−1 M−1), whereas P9 shows higher affinity and kinetic efficiency for CE (Km = 1.01 μM; kcat/Km = 5.9 × 10⁶ s−1 M−1) than P10 for CE (Km = 29.57 μM; kcat/Km = 6.8 × 10³ s−1 M−1). The kinetic study is roughly in accordance with the fluorescence responses of P9 and P10 toward AChE, BChE and CE. These results all further demonstrate that our approach to designing a specific substrate for AChE detection without interference from BChE and CE is reasonable and effective. Considering its excellent specificity for AChE, P10 was chosen as a candidate for subsequent studies.Spectroscopic characteristics of P10
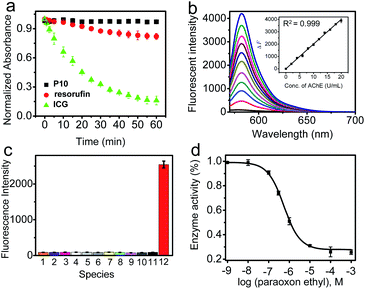
P10 itself exhibited an absorption maximum at 478 nm with negligible emission (Φ ≈ 0.008, Fig. S6† and Table 1), but the reaction mixture of P10 with AChE showed a dramatic absorption peak shift to 571 nm with a distinct color change from colorless to pink, accompanied by a significant fluorescence enhancement at 582 nm with orange emission. This noticeable change in the spectroscopic signal benefits the sensitive detection of AChE. Subsequently, the reaction conditions (pH, temperature, and time) were optimized. As shown in Fig. S7 and S8,† the fluorescence intensity reached a maximum within the buffer solution (pH 7.4) during incubation at 37 °C, indicating the high applicability of P10 under physiological conditions. The time course studies revealed that higher concentrations of the probe will lead to faster responses and stronger fluorescence than lower concentrations. As shown in Fig. 2a, the photostability of P10 was also tested. Compared to the clinically approved molecular dye indocyanine green (ICG), the fluorophore of resorufin used in our experiments and P10 both have higher photostability.Under the optimized conditions, the fluorescence response of P10 to AChE was studied over a wide concentration range (Fig. 2b). A close-correlation between the concentration of AChE and emission intensity was observed, and good linearity was obtained at concentrations of 0–20 U mL−1. The linear regression equation is ΔF = 200 × C (U mL−1) − 1.5, with a correlation coefficient of 0.999. The detection limit (k = 3)53 was calculated to be 0.017 U mL−1, which is lower than the physiological activity (approximately 5.0 U mL−1).54
Next, selectivity assay of P10 over other potential interfering species was performed, such as some enzymes [xanthine oxidase, tyrosinase, monoamine oxidase A (MAO-A), monoamine oxidase B (MAO-B), β-glucosidases, trypsin, alkaline phosphatase (ALP) and apyrase], human serum albumin (HSA), bovine serum albumin (BSA), some inorganic salts (KCl, MgCl2, CaCl2 and ZnCl2), glucose, vitamin C, some amino acids (tyrosine, cysteine, glycine, glutamic acid, arginine, alanine and lysine), glutathione, urea and some reactive oxygen species (H2O2, ClO−, TBHP, ˙OH, TBO˙, O2˙−, 1O2, ONOO−, NO2, CO and NO) (Fig. 2c, S9 and S10†). P10 shows the most substantial fluorescence response toward AChE, whereas its response with the other potential interfering species showed no significant emission enhancement. These results indicate that P10 is suitable for the selective detection of AChE within complex biological contexts.
To evaluate the sensing mechanism, the reaction product of P10 and AChE was analyzed by electrospray ionization (ESI) mass spectrometry and high-performance liquid chromatography (HPLC). As shown in Fig. S11,† the released resorufin was confirmed by an ESI peak of resorufin at 212.00 [M![[thin space (1/6-em)]](https://www.rsc.org/images/entities/char_2009.gif) −
−![[thin space (1/6-em)]](https://www.rsc.org/images/entities/char_2009.gif) H]−. Moreover, HPLC analysis further verified the generation of resorufin as a reaction product (Fig. S12†). The peak deceased at 5.73 min indicating P10 in the HPLC spectrum and was accompanied by the appearance of a new peak at 10.52 min representing resorufin. These results both clearly suggest that the reaction product was generated from the reaction of P10 and AChE.
H]−. Moreover, HPLC analysis further verified the generation of resorufin as a reaction product (Fig. S12†). The peak deceased at 5.73 min indicating P10 in the HPLC spectrum and was accompanied by the appearance of a new peak at 10.52 min representing resorufin. These results both clearly suggest that the reaction product was generated from the reaction of P10 and AChE.
Based on the recognition ability of P10 toward AChE, we investigated the applicability of P10 for the inhibitor screening of AChE by IC50 value measurement. The IC50 value could be used to describe the inhibitory capacity of an inhibitor. As a known and effective inhibitor of AChE, paraoxon ethyl (PO) was selected as a candidate for this study.1 In the inhibition assay, the paraoxon ethyl was mixed with AChE, and then P10 was added. By measuring the fluorescence signal of P10, PO showed an IC50 value of 110 nM, which is roughly consistent with the reported reference (Fig. 2d and S13†).55
Fluorescence imaging of AChE activity within cells
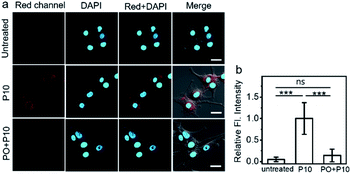
The high specificity and sensitivity of P10 make it possible to image AChE activity in living cells. Human embryonic kidney cells (HEK293 cells), mouse neuroblastoma cells (N2A cells), and human primary glioblastoma cells (U87MG cells) were chosen as model cell lines. Prior to the study, the potential toxicity of P10 to cells was evaluated by the standard CCK-8 assay, and it showed high biocompatibility with all three cell lines (Fig. S14†). First, we compared the activity of AChE in different cells under the same conditions. We hypothesized that the penetrating ability of the probe into each cell is the same; the three cell lines show different fluorescence intensities (Fig. S15†); the strongest intensity was within U87 MG cells, moderate intensity is observed within N2A cells, and the weakest intensity is seen within HEK293 cells, indicating different expression levels of AChE in these cells, which can be further evidenced by the tested AChE activity in three cell lysates based on the Ellman method. Among them, U87MG cells might have the highest activity level of AChE. These results confirm that P10 could be utilized for comparing the activity of AChE in different cells.To further demonstrate the applicability of P10 in the field of drug development, an inhibitory experiment was performed within U87MG cells. The untreated U87MG cells show no autofluorescence signals under imaging conditions, but the cells treated with P10 show bright fluorescence in the cell cytosol (Fig. 3a and b), suggesting that P10 has a good cell-permeability and possibly reacted with AChE within the cells. To verify that the fluorescence enhancement arises from the reaction of P10 and AChE, cells were pretreated with PO, and then P10 was added. In these cells, a low fluorescence signal was observed within the cell cytosol, compared to the P10-treated cells without the addition of an inhibitor. These results indicate that the probe P10 could be employed to visualize the activity of AChE within living cells.
In vivo and ex vivo visualization of AChE activity within the mice brains
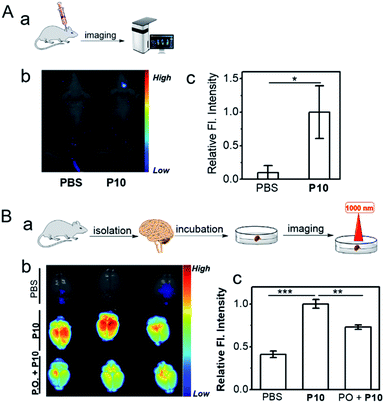
Inspired by the capacity for imaging AChE activity in cells, P10 was applied further to image AChE activity within a live mouse brain. For the in vivo brain imaging, P10 was injected into the brain cerebral hemisphere and lateral ventricle sites. As shown in Fig. 4Aa–Ac, bright fluorescence was observed within the P10-treated mouse brain; compared to the PBS-treated mouse brain, representing the superior visualization ability of P10 toward the activity of AChE in living biosystems.Besides, an ex vivo imaging experiment was also performed (Fig. 4Ba). In this set, the mouse brain was first isolated and then treated with PBS (control), P10, and the inhibitor (PO) with P10 (Fig. S16†). The PBS control set showed no autofluorescence signals under the experimental conditions (Fig. 4Bb, top), but the P10 treated set showed bright fluorescence signals (Fig. 4Bb, middle). Moreover, we found significantly reduced fluorescence signals in the inhibitor-treated brain (Fig. 4Bb, bottom, Fig. 4Bc), suggesting that the fluorescence signal was derived from the reaction of P10 with AChE in the mouse brain. The in vivo and ex vivo imaging results represent that P10 has the capacity to selectively visualize AChE activity in living systems.
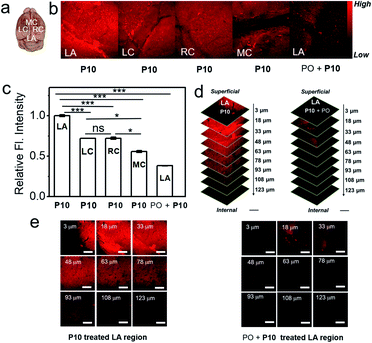
Furthermore, we attempted fluorescence-based AChE activity mapping within the healthy mouse brain by using P10. The isolated mouse brain was incubated with P10, and fluorescence images were recorded in the lambda (LA), left cerebral cortex (LC), right cerebral cortex (RC), and middle cortex (MC) regions by using three-dimensional (3D) two-photon microscopy (TPM).56 As shown in Fig. 5, the fluorescence intensity in the LA region of the brain is the strongest; the LC regions has moderate fluorescence, which is almost as the same as that in the RC region; the MC region shows the weakest fluorescence intensity indicating that the LA region may have the highest AChE level in the brain (Fig. 5b and c). A Z-sectioned two-photon scan of P10 treated brain tissue displays a high tissue permeability and deep tissue imaging ability of P10 (Fig. 5d and S17–S21†). The inhibitory experiment in the LA region suggested that the fluorescence signal was derived from AChE activity (Fig. 5e). The distribution data might provide important information on AChE activity in translational studies. All the tissue imaging results suggest that P10 can visualize the activity of AChE in the brain, further extending the application of this probe in biological studies.
Conclusions
In summary, we have developed a new approach for the design of substrates to detect the activity of AChE by combining dimethylcarbamate choline with a self-immolative scaffold (4-hydroxybenzyl alcohol). On this basis, a series of probes were synthesized and a promising compound was found, P10, which shows high selectivity and sensitivity toward AChE, with no interference from BChE and CE. The high specificity of this probe was successfully confirmed by imaging AChE in different cells. In addition, this probe can monitor AChE activity and map the distribution of AChE activity in the normal mouse brain. The acquired results in this work might be of great significance for studying AChE in various research fields. These results successfully proved that our approach to designing a specific substrate for AChE detection is rational and effective. Moreover, such a substrate might be used to develop better AChE probes with different spectroscopic properties for better elucidating AChE activity in complex biosystems and could also provide a strategy for developing specific substrates for other enzymes.Conflicts of interest
The authors declare no competing financial interests.Acknowledgements
All of the experiments performed with mice were carried out in accordance with the National Institute of Health Guide for the Care and Use of Laboratory Animals (NIH Publications No. 80-23) revised in 1996 and protocols approved by the Institutional Animal Care and Use Committee of Kyung Hee University [KHUASP(SE)-19-002]. J. Y. thanks the National Research Foundation of Korea (NRF), which was funded by the Korea government (MSIP) (No. 2012R1A3A2048814). D. K. acknowledges the financial support from the NRF of Korea (No. 2019-M3A9H1103783, No. 2018-M3A9H3021707, and No. 2018-R1A6A1A03025124). O. M. S. acknowledges the support from the Medical Research Center Program through the NRF of Korea funded by the Ministry of Science and ICT (No. 2017-R1A5A2014768). H. M. M. thanks the National Natural Science Foundation of China (No. 21820102007).Notes and references
- D. M. Quinn, Chem. Rev., 1985, 85, 955–979 Search PubMed.
- K. D. Green, M. Fridman and S. Garneau-Tsodikova, Chembiochem, 2009, 10, 2191–2194 Search PubMed.
- G. Sberna, J. Valero-Saez, Q. X. Li, C. Czech, K. Beyreuther, C. L. Masters, C. A. McLean and D. H. Small, J. Neurochem., 1998, 71, 723–731 Search PubMed.
- M. G. Savelieff, G. Nam, J. Kang, H. J. Lee, M. Lee and H. M. Lee, Chem. Rev., 2019, 119, 1221–1322 Search PubMed.
- E. Krejci, I. M. P. Valenzuela, R. Ameziane and M. Akaaboune, J. Biol. Chem., 2006, 281, 10347–10354 Search PubMed.
- L. Silman and J. L. M. Sussman, J. Neurochem., 2017, 142, 19–25 Search PubMed.
- H. Sorep and S. A. Seidman, Nat. Rev. Neurosci., 2001, 2, 294–302 Search PubMed.
- M. Behra, X. Cousin, C. Bertrand and J. L. Vonesch, Nat. Neurosci., 2002, 5, 111–118 Search PubMed.
- X. J. Zhang, L. Yang, Q. Zhao, J. P. Caen, H. Y. He, Q. H. Jin, L. H. Guo, M. Alemany, L. Y. Zhang and Y. F. Shi, Cell Death Differ., 2002, 9, 790–800 Search PubMed.
- T. Han and G. Wang, J. Mater. Chem. B, 2019, 7, 2613–2618 Search PubMed.
- R. Jin, Z. Xing, D. Kong, X. Yan, F. M. Liu, Y. Gao, P. Sun, X. Liang and G. Lu, J. Mater. Chem. B, 2019, 7, 1230–1237 Search PubMed.
- S. Sabelle, P. Y. Renard, K. Pecorella, S. D. Suzzoni-Dezard, C. Creminon, G. Gressi and C. Mioskiowski, J. Am. Chem. Soc., 2002, 124, 4874–44880 Search PubMed.
- H. Wang, J. Wang, C. Timchalk and Y. Lin, Anal. Chem., 2008, 80, 8477–8484 Search PubMed.
- D. Lu, J. Wang, L. Wang, D. Du, C. Timchalk, R. Barry and Y. Lin, Adv. Funct. Mater., 2011, 21, 4371–4378 Search PubMed.
- D. Liu, W. Chen, J. Wei, X. Li, Z. Wang and X. Jiang, Anal. Chem., 2012, 84, 4185–4191 Search PubMed.
- G. Zhou, F. Wang, H. Wang, S. Kambam, X. Chen and J. Yoon, ACS Appl. Mater. Interfaces, 2013, 5, 3275–3280 Search PubMed.
- K. Gu, W. Qiu, Z. Guo, C. Yan, S. Zhu, D. Yao, P. Shi, H. Tian and W. H. Zhu, Chem. Sci., 2019, 10, 398–405 Search PubMed.
- J. Ohata, K. J. Bruemmer and C. J. Christopher, Acc. Chem. Soc., 2019, 52, 2841–2848 Search PubMed.
- H. Li, Y. Li, Q. Yao, J. Fan, W. Sun, S. Long, K. Shao, J. Du, J. Wang and X. Peng, Chem. Sci., 2019, 10, 1619–1625 Search PubMed.
- X. Li, X. Gao, W. Shi and H. Ma, Chem. Rev., 2014, 114, 590–659 Search PubMed.
- J. Zhang, X. Chai, X. P. He, H. J. Kim, J. Yoon and H. Tian, Chem. Soc. Rev., 2019, 48, 683–722 Search PubMed.
- R. Wang, J. Chen, J. Gao, J. A. Chen, G. Xu, T. Zhu, X. Gu, Z. Guo, W. H. Zhu and C. Zhao, Chem. Sci., 2019, 10, 7222–7227 Search PubMed.
- M. Kawatanti, K. Yamamoto, D. Yamada, M. Kamiya, J. Miyakawa, Y. Miyama, R. Kojima, T. Morikawa, H. Kume and Y. Urano, J. Am. Chem. Soc., 2019, 141, 10409–10416 Search PubMed.
- K. Li, W. Qiu, J. Li, Xi. Chen, Y. Hu, Y. Gao, D. Shi, X. Li, H. Lin, Z. Hu, G. Dong, C. Sheng, B. Jiang, C. Xia, C. Y. Kim, Y. Guo and J. Li, Chem. Sci., 2020, 11, 7292–7301 Search PubMed.
- D. Wang and B. Z. Tang, Acc. Chem. Soc., 2019, 52, 2559–2570 Search PubMed.
- H. W. Liu, K. Li, X. X. Hu, L. Zhu, Q. Rong, Y. Liu, X. B. Zhang, J. Hasserodt, F. Li. Qu and W. Tan, Angew. Chem., Int. Ed., 2017, 56, 11788–11792 Search PubMed.
- Y. Li, H. Song, C. Xue, Z. Fang, L. Xiong and H. Xie, Chem. Sci., 2020, 11, 5889–5894 Search PubMed.
- Y. Zhang, C. Yan, C. Wang, Z. Guo, X. Liu and W. H. Zhu, Angew. Chem., Int. Ed., 2020, 59, 9059–9066 Search PubMed.
- M. Mao, F. Yu, C. Lv, J. Choo and L. Chen, Chem. Soc. Rev., 2017, 46, 2237–2271 Search PubMed.
- X. Zhen, J. Zhang, J. Huang, C. Xie, Q. Miao and K. Pu, Angew. Chem., Int. Ed., 2018, 57, 7804–7808 Search PubMed.
- F. Feng, Y. Tang, S. Wang, Y. Li and D. Zhu, Angew. Chem., Int. Ed., 2007, 46, 7882–7886 Search PubMed.
- J. Chen, D. Liao, Y. Wang, H. Zhou, Y. Li and C. Yu, Org. Lett., 2013, 15, 2132–2135 Search PubMed.
- B. Wang, H. Wang, F. Wang, G. Zhou, Y. Wang, S. Kambam and X. Q. Chen, Bioorg. Med. Chem. Lett., 2014, 24, 552–555 Search PubMed.
- S. Liao, W. Han, H. Ding, D. Xie, H. Tan, S. Yang, Z. Wu, G. Shen and R. Yu, Anal. Chem., 2013, 85, 4968–4973 Search PubMed.
- Y. Zhang, Y. Cai, Z. Qi, L. Lu and Y. Qian, Anal. Chem., 2013, 85, 8455–8461 Search PubMed.
- D. Liao, J. Chen, H. Zhou, Y. Wang, Y. Li and C. Yu, Anal. Chem., 2013, 85, 2667–2672 Search PubMed.
- A. S. Y. Law, M. C. L. Yeung and V. M. M. Yan, ACS Appl. Mater. Interfaces, 2019, 11, 4799–4808 Search PubMed.
- P. Zhang, C. Fu, Y. Xiao, Q. Zhang and C. Ding, Talanta, 2020, 208, 120406–120416 Search PubMed.
- K. Cui, Z. Chen, Z. Wang, G. Zhang and D. Zhang, Analyst, 2011, 136, 191–195 Search PubMed.
- Y. Zhang, W. Chen, D. Feng, W. Shi, X. Li and H. Ma, Analyst, 2012, 137, 716–721 Search PubMed.
- S. Yoo and S. M. Han, Chem. Commun., 2019, 55, 14574–14577 Search PubMed.
- S. Y. Liu, H. Xiong, J. Q. Yang, S. H. Yang, Y. Li, W. Yang and G. F. Yang, ACS Sens., 2018, 3, 2118–2128 Search PubMed.
- X. Wang, P. Li, Q. Di, C. Wu, W. Zhang and B. Tang, J. Am. Chem. Soc., 2019, 141, 2061–2068 Search PubMed.
- J. Ma, T. Si, C. Yan, Y. Li, Q. Li, X. Lu and Y. Guo, ACS. Sens., 2020, 5, 83–92 Search PubMed.
- P. M. Potter, C. A. Pawlik, C. L. Morton, C. W. Naeve and M. K. Danks, Cancer Res., 1998, 58, 2646–2651 Search PubMed.
- D. J. Burkhart, B. L. Barthel, G. C. Post, B. T. Kalet, J. W. Nafie, R. K. Shoemaker and T. H. Koch, J. Med. Chem., 2006, 49, 7002–7012 Search PubMed.
- D. J. Horgan, E. C. Webb and B. Zerner, Biochim. Biophys. Res. Commun., 1966, 23, 23–28 Search PubMed.
- J. L. Sussman, M. Harel, F. Frolow, C. Oefner, A. Goldman, L. Toker and L. Silman, Science, 1991, 253, 872–879 Search PubMed.
- H. Dvir, L. Silman, M. Harel, T. L. Rosenberry and J. L. Sussman, Chem.-Biol. Interact., 2010, 187, 10–22 Search PubMed.
- S. Gnaim and D. Shabat, Acc. Chem. Soc., 2014, 47, 2970–2984 Search PubMed.
- J. Yan, S. Lee, A. Zhang and J. Yoon, Chem. Soc. Rev., 2018, 47, 6900–6916 Search PubMed.
- B. M. Liederer and R. T. Borchardt, J. Pharm. Sci., 2006, 95, 1177–1195 Search PubMed.
- X. Wu, W. Shi, X. Li and H. Ma, Angew. Chem., Int. Ed., 2017, 56, 15319–15323 Search PubMed.
- A. Alvarez, R. Alarco, C. Opazo, E. O. Campos, F. J. Munoz, F. H. Caldeo, F. Dajas, M. K. Gentry, B. P. Doctor, F. G. Demello and N. C. Inestrosa, J. Neurosci., 1998, 18, 3213–3223 Search PubMed.
- F. Verdin-Betancourt, M. Figueroa, M. D. L. Lopez-Gonzalez, E. Gomez, Y. Y. Bernal-Hernandez, A. E. Rojas-Garcia and A. Sierra-Santoyo, Sci. Rep., 2019, 9, 14758 Search PubMed.
- J. Mutze, V. Iyer, J. J. Macklin, J. Colonell, B. Karsh, Z. Petrasek, P. Schwille, L. L. Looger, L. D. Lavis and T. D. Harris, Biophys. J., 2012, 102, 934–944 Search PubMed.
Footnotes |
| † Electronic supplementary information (ESI) available. See DOI: 10.1039/d0sc04213g |
| ‡ These authors contributed equally to this work. |
| This journal is © The Royal Society of Chemistry 2020 |

