A theoretical investigation on promising acceptor groups for POM-based dyes: from electronic structure to photovoltaic conversion efficiency†
Received
24th July 2019
, Accepted 8th November 2019
First published on 13th November 2019
Abstract
Theoretical calculations based on the density functional theory (DFT) and time-dependent DFT (TD-DFT) were employed to screen efficient acceptor group candidates for POM-based dyes. Compared to the commonly used cyanoacrylic acid acceptor group in dye 1, the acceptor groups, namely 2-hydroxy-4-(methyleneamino)benzoic acid, 5-methylenepyrimidine-2,4,6(1H,3H,5H)-trione and 5-methyleneimidazolidine-2,4-dione, in dyes 2–4 showed increased adsorption ability onto the TiO2 surface, which is beneficial for device stability. The reduced density gradient analysis offered a rich visualization of the weak interactions between the two monomers in the dimers of the dyes, indicating that the retarded aggregation in dyes 2–4 resulted from the hydrogen bonds present in the dimers of dyes 2–4, while π–π stacking interactions also existed in the dimer of dye 1. Particularly, dye 3 not only exhibited the broadest absorption spectrum, largest ICT parameters, largest short-circuit photocurrent density governed by electronic coupling and largest open-circuit photovoltage connected with the energy shift of the conduction band among dyes 1–4, but also possessed superior adsorption stability and the lowest interaction energy for the most stable dimer configuration, which can improve the photovoltaic efficiency of DSSCs. Thus, the 5-methylenepyrimidine-2,4,6(1H,3H,5H)-trione acceptor group in dye 3 can be a promising acceptor group candidate for high-performance dyes used in DSSCs.
1. Introduction
The gradual depletion of fossil fuel sources along with the progressive increase in environmental pollution has stimulated an urgent demand for renewable clean energy sources. Solar energy has the largest potential to satisfy the global need for renewable energy sources, and converting solar energy into electricity presents one of the most challenging technological tasks.1 Dye-sensitized solar cells (DSSCs) are the most representative examples of the third-generation sunlight-to-electricity devices, which have attracted a great deal of attention due to their low cost and easy fabrication since the seminal work reported by Grätzel in 1991.1 Even though a record efficiency of 14% has been achieved by the DSSC co-photosensitized with the alkoxysilyl-anchor dye ADEKA-1 and the carboxy-anchor organic dye LEG4, the efficiency still lags behind those of the conventional Si-based solar cells (25%);2 thus, further breakthrough is of great significance. Moreover, DSSCs are less stable than Si-based solar cells, which limits their large-scale commercial production.3 A typical DSSC consists of three important components (a dye-sensitized semiconductor photoanode, a counter electrode, and a redox shuttle), which can be individually optimized for higher photovoltaic efficiency. After illumination, the sensitizing dye grafted on the surface of the mesoporous semiconductor substrate (usually TiO2) injects the photoexcited electrons into the semiconductor conduction band (CB), and the electrons are transferred to the external circuit, while the concomitant holes created in the dye are transferred to the redox mediator, which is in turn regenerated, thus completing the circuit. Considering the important roles of the dyes in DSSCs, massive efforts have been made for seeking potential dyes that match the solar spectrum well as well as have high stability to further improve the efficiency of the light-to-electrical energy conversion.4
Polyoxometalates (POMs) are unique anionic metal–oxygen clusters with fascinating structural and photophysical properties, which result in their widespread applications in many fields, such as catalysis, materials science and analytical chemistry.5–11 POMs can accept many electrons without losing their structural integrity,12 and recently, POMs have been widely used in DSSCs as photosensitizers due to their electronic versatility.13,14 POMs have the capability to attach organic molecules onto the surface of their clusters; thus, they can be used as inorganic building blocks for constructing inorganic–organic hybrids, in which POMs act as the electron acceptors and organic segments act as the electron donors. The maximum absorption bands of the hybrids significantly red-shift compared with those of the individual components, resulting from the synergistic effect of the POMs and organic segments,15 thereby resulting in long-wavelength absorption.
The donor–π linker–acceptor (D–π–A) pattern has been extensively exploited in tailoring dyes due to the efficient intramolecular charge transition (ICT) under photo-irradiation. The electron acceptor groups of these dyes anchor to the semiconductor surface directly and play vital roles in light harvesting and electron transfer process. Though a variety of donors and π linker groups have been explored for fabricating efficient dyes, fewer acceptor groups have been studied, and one of the commonly used acceptor group is cyanoacrylic acid. However, it has been observed that dyes with cyanoacrylic acid are vulnerable to dissociation on the semiconductor surface under long-term irradiation, which is undesirable for the stability of the device.16,17 Thus, it is pivotal to explore the acceptor groups for dyes with increased binding strength. Some heterocyclic groups, such as pyridine,18 8-hydroxylquinoline19 and tropolone,20 have been explored as alternative acceptor groups since the metals in the semiconductors can form strong chelating bonds with the heterocyclic ligands.21 Particularly, the metal-free organic dye with the hydantoin acceptor, reported by Dai et al., achieved a higher photovoltaic conversion efficiency of 7.66% compared with the dye containing cyanoacrylic acid as the acceptor group (4.90%).17 However, it is unclear how the acceptor groups affect the performance of DSSCs, particularly the factors related to short-circuit photocurrent density JSC and open-circuit photovoltage VOC. Further, to understand if there are more efficient acceptors than cyanoacrylic acid and the hydantoin acceptor group that can be used in dyes, theoretical calculations have been used as efficient low-cost tools22 to evaluate the performance of dyes in DSSCs.23–26 Even though a lot of effort has been made to improve the conversion efficiency of DSSCs, few studies have reported on the dye aggregation mechanism that enhances the electron recombination and hence, decreases the overall efficiency of the cell. In this study, a series of POM-based dyes with different acceptor groups were designed and systematically analyzed by the density functional theory (DFT) and time-dependent DFT (TD-DFT) calculations with the aim of qualitatively (or even quantitatively) identifying the properties of these acceptor groups and seeking efficient acceptor group candidates for dyes. Apart from the electronic properties, absorption spectra and ICT characteristics of isolated dyes, JSC and VOC, dye aggregation effects as well as the absorption configurations of the acceptor groups onto the TiO2 surface, which are proven crucial factors affecting the performance of DSSCs, were also taken into consideration. It is expected that this work would give theoretical guidelines to further speed up the designing of high-performance dyes.
2. Methods
2.1. Theoretical background
The power conversion efficiency (η) of DSSCs can be expressed as:27| |  | (1) |
where JSC is the short-circuit photocurrent density, VOC is the open-circuit photovoltage, IS is the intensity of the incident light, and FF is the fill factor of the cell. Accordingly, improving JSC and VOC is an effective method to enhance η. JSC can be defined as follows:| |  | (2) |
where e is the unit charge, IPCE(λ) is the incident photo-to-current conversion efficiency at a fixed wavelength, and ϕph. AM1.5G(λ) is the corresponding photo flux of the solar radiation spectrum at a fixed wavelength.| | | IPCE = LHE(λ)Φinjηregηcol | (3) |
where LHE(λ), the light harvesting efficiency at a specific wavelength, is given by LHE(λ) = 1–10−f, and f is the oscillator strength of the dye corresponding to the maximum absorption wavelength λmax. ηcol is the charge collection efficiency, which is assumed to be a constant for DSSCs that only differ on the dyes employed. Φinj is the electron injection efficiency and is closely connected with kinj, which can be described as follows:28| |  | (4) |
where VDA is the coupling between the donor and acceptor states, and χ is the reorganization energy. ΔGinj can be determined by the following equation:29where Edye* is the oxidation potential of the dye in the excited state, which is related to the oxidation potential of the dye in the ground state (Edye) and the vertical transition energy (Ev), i.e., Edye* = Edye − Ev.29ECBM is the conduction band minimum (CBM) of TiO2, and the experimental value −4.00 eV (vs. vacuum) was used.30ηreg is related to the regeneration driving force ΔGreg, which is defined as the difference between the redox potential of the electrolyte and Edye as follows:31
In order to evaluate the CT abilities of the dyes, the CT parameters, including the amount of transferred charges (qCT), the corresponding effective charge transfer distance (dCT), and the t index that assesses the degree of separation between ρ+(r) and ρ−(r) based on the total densities at the ground and excited states, were calculated.32ρ+(r) and ρ−(r) are defined as the points in space, where the density increment and depletion upon absorption are produced, respectively. The larger the t, the lesser is the overlap between the electron density depletion and increment regions. The difference in electronic density related to the electronic transition is given by:
| | | Δρ(r) = ρES(r) − ρGS(r) | (7) |
ρES(
r) and
ρGS(
r) are proposed to represent the electronic densities of the excited and ground states, respectively.
qCT is given by:
| |  | (8) |
The barycenters (
r+ and
r−) of the density distributions, defined by
ρ+(
r) and
ρ−(
r), are expressed as the following equations:
| |  | (9) |
| |  | (10) |
The difference between
r+ and
r− is defined as
dCT.
To elucidate the interaction energy (ΔEtot) of the dimers of the dyes, simple energy decomposition was performed. ΔEtot can be decomposed as follows:33
| | | ΔEtot = (ΔEels + ΔEex) + ΔEorb = ΔEsteric + ΔEorb | (11) |
where Δ
Eels is electrostatic interaction term, which is normally negative if the two fragments are neutral; Δ
Eex is the exchange repulsion term, which comes from the Pauli repulsion effect and is invariably positive. For convenience, the terms Δ
Eels and Δ
Eex are usually combined as the steric term (Δ
Esteric). Δ
Eorb is the orbital interaction term, which arises from the mix of occupied molecular orbitals (MOs) and virtual MOs. If the combined wavefunction is presumed as the initial equation for the complex, then
Eorb can be evaluated by subtracting the first SCF iteration energy from the last SCF iteration energy:
| | | ΔEorb = ESCF, last − ESCF,1st | (12) |
| | | ΔEsteric = ΔEels + ΔEex = ΔEtot − ΔEorb | (13) |
To determine the most stable adsorption mode of the dyes, the adsorption energy (Eads) was calculated as follows:
| | | Eads = E[dye–TiO2] − E[dye] − E[TiO2] | (14) |
where
E[dye–TiO2] is the total energy of the dye–TiO
2 complex, and
E[dye] and
E[TiO2] are the energies of the isolated dye and bare TiO
2, respectively. The larger the
Eads, the greater is the adsorption stability.
V
OC can be defined as:34
| |  | (15) |
where
nc is the number of electrons in CB, and
q and
kT are the constants, representing the unit charge and thermal energy, respectively.
NCB represents the accessible density of the CB states. A temperature of 300 K and a typical
NCB density of 7 × 10
20 cm
−3 were adopted according to a previous experiment.
35 The dye absorbed on the TiO
2 surface can lead to the energy shift of
ECBM (Δ
ECB), and
ECB =
ECBM + Δ
ECB. Apparently, a large Δ
ECB of the dye will induce a significant increase in
VOC.
2.2. Computation details
All the calculations were performed using the Gaussian 09 D01 package,36 unless otherwise stated. The ground-state geometries of all the POM-based dyes were optimized at the B3LYP37 level with LANL2DZ for the Mo atom and 6-31G(d) basis set for other atoms, and the effect of ethyl acetate solvent was taken into account based on the conductor-like polarizable continuum model (CPCM).38 In order to provide insights into the absorption properties of studied dyes, the TD-DFT calculations were performed by computing the lowest 50 singlet–singlet excitation states. The PBE0 hybrid functional39 has been proved to be reliable in predicting the vertical excitation energies of POM-based dyes in our previous study,25 and the two absorption peaks of [Mo6O18(N-1-C10H6-2-CH3)]2− simulated by PBE0 (255 nm and 436 nm) were in agreement with the experimental values (around 235 nm and 400 nm),40 which are displayed in Fig. S1 and Table S1 (ESI†), confirming that PBE0 is appropriate for simulating the excitation energy of the studied dyes in this study. Thus, the excitation properties of studied dyes at the PBE0/6-31+G(d)/LANL2DZ level were calculated. The absorption spectra of studied dyes were simulated using Gaussian functions with a full-width at half maximum of 0.15 eV. To identify the most stable dimer structures of dyes 1–4, 60 structure configurations generated by the Molclus program41 for each dye were adopted as the initial structures for optimization at the B3LYP/3-21G level using the Gaussian 09 D01 package. The lowest energy dimer structures obtained with Na+ as the counterion to eliminate the effect of the negative charge were further optimized at the B3LYP level with LANL2DZ for the Mo atom and the 6-31G(d) basis set for other atoms, and D3 dispersion correction was used.42 Simultaneously, the interaction energies of the dimers were calculated at the same level of the theory. In addition, the reduced density gradient (RDG) analysis43 and simple energy decomposition were performed by using the Multiwfn software.44
The (TiO2)48 cluster obtained by appropriately cutting the anatase (101) surface was used to model the surface effect of bulk TiO2,45 and the dyes adsorbed on (TiO2)48 were studied using the Dmol3 program.46 The dye–TiO2 systems were optimized using the Perdew–Burke–Ernzerhof (PBE) functional47,48 of the generalized gradient approximation (GGA)49 and the double numerical polarization (DNP) basis set. Based on the optimized geometries of the dye–TiO2 systems, the adsorption energies were calculated at the B3LYP-D3/3-21G(d) level. The atomic charge distributions were calculated by the Merz-Kollman method50,51 to obtain the average dye electrostatic potential, and the corresponding computational details are described in ESI.†
3. Results and discussion
3.1. Molecular structures
Naphthylimido-substituted hexamolybdate [Mo6O18(N-1-C10H6-2-CH3)]2− was synthesized as described by Wei et al.40 Based on [Mo6O18(N-1-C10H6-3-CH3)]2−, a series of POM-based dyes for DSSCs were designed by introducing a thieno[3,2-b]thiophene π linker and different acceptor groups. The acceptor group in dye 1 was the commonly used cyanoacrylic acid group, while dyes 2–4 were designed by replacing cyanoacrylic acid with 2-hydroxy-4-(methyleneamino)benzoic acid, 5-methylenepyrimidine2,4,6 (1H,3H,5H)-trione and 5-methyleneimidazolidine-2,4-dione, respectively. The molecular structures of [Mo6O18(N-1-C10H6-2-CH3)]2− and dyes 1–4 are displayed in Fig. 1.
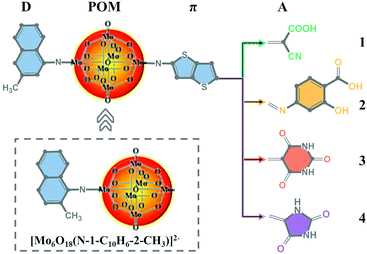 |
| | Fig. 1 The molecular structures of [Mo6O18(N-1-C10H6-2-CH3)]2− and the studied dyes. | |
3.2. Electronic structures
An ideal dye for DSSCs must match the basic energetic requirement that the lowest unoccupied molecular orbital (LUMO) energy level should be higher than the CB level of TiO2 (−4.00 eV), ensuring that the electron is injected into TiO2 from the excited dye, while the highest occupied molecular orbital (HOMO) energy level of the dye should be lower than the redox potential energy I−/I3− (−4.80 eV),52 guaranteeing that the dye can be efficiently regenerated. As shown in Fig. 2, the LUMO energy levels of all the studied dyes were more positive than the CB energy of TiO2, and the HOMO energy levels were more negative than the I−/I3− redox potential, showing that the energy levels of the studied dyes fulfill the requirements for DSSCs.
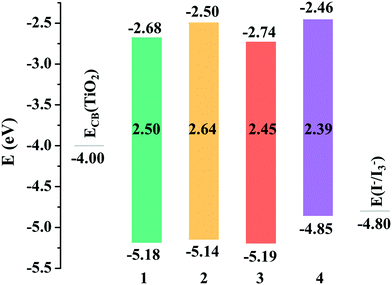 |
| | Fig. 2 Frontier molecular orbital energy levels of the studied dyes. | |
The FMO distributions of dyes 1–4 are shown in Fig. 3. The HOMO energies of dyes 1–3 were similar due to the similar distributions of HOMOs, which mainly localized on the donor groups and also had some distribution over the π linkers, while the HOMO distribution of dye 4 delocalized over the π linker and the acceptor group, leading to an increased HOMO energy. For dyes 1 and 3, the LUMOs localized on the POMs and spread over the π linkers and acceptor groups, which resulted in similar LUMO energies, while the LUMO energies of dyes 2 and 4 increased compared with those of dyes 1 and 3 as the POM plays a vital role in the distribution of LUMOs. It can be seen that the acceptor groups obviously influenced the HOMO and LUMO energies and eventually the HOMO–LUMO (H–L) gaps. Considering that a smaller H–L gap means lesser energy is needed for dye excitation, the absorption spectra of dyes 3 and 4 might red-shift compared with those of dyes 1 and 2 owing to their smaller H–L gaps. More importantly, the FMO distributions of dyes 1 and 3 showed apparent push–pull characteristics, which are beneficial to the transfer of photoexcited electrons from the donor to the acceptor groups and reduce the recombination of electrons and holes.
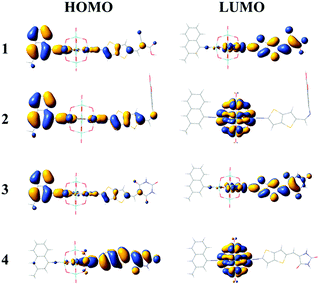 |
| | Fig. 3 Frontier molecular orbital distributions of the studied dyes. | |
3.3. Absorption spectra
There is no doubt that insights into the simulated absorption spectra of the dyes will provide a better understanding on the light absorption property. The calculated excitation energies (Ev), maximum absorption wavelengths (λmax), oscillator strengths (f) and major electronic compositions of the studied dyes are listed in Table 1, and the simulated absorption spectra are illustrated in Fig. 4. The maximum absorption bands of dyes 1–4 were in the following order: 2 (473 nm) < 1 (526 nm) = 4 (526 nm) < 3 (539 nm), confirming that replacing the commonly used cyanoacrylic acid in dye 1 with 5-methylenepyrimidine-2,4,6(1H,3H,5H)-trione in dye 3 contributed in harvesting the sunlight better, which is in good agreement with the results under “Electronic structures” discussed above.
Table 1 The calculated excitation energies Ev (eV), maximum absorption wavelengths λmax (nm), oscillator strengths f and major electronic compositions of the studied dyes
| Dye |
E
v
|
λ
max
|
f
|
Major electronic compositions |
|
1
|
2.36 |
526 |
2.03 |
H−1 → L(35%), H → L(62%) |
| 3.01 |
412 |
0.32 |
H → L+5(83%) |
| 3.65 |
340 |
0.04 |
H−8 → L+19(11%) H−7 → L+1(56%) |
|
2
|
2.62 |
473 |
1.88 |
H−1 → L+18(20%) H → L+1(73%) |
| 3.11 |
399 |
0.19 |
H → L+5(16%) H → L+6(58%) |
| 3.79 |
327 |
0.07 |
H−1 → L+11(13%) H → L+11(65%) |
|
3
|
2.30 |
539 |
2.01 |
H−1 → L(40%) H → L(53%) |
| 3.00 |
414 |
0.32 |
H → L+5(71%) H → L+6(12%) |
| 3.65 |
340 |
0.04 |
H−8 → L+1(12%) H−7 → L+1(54%) |
|
4
|
2.36 |
526 |
2.37 |
H → L+1(96%) |
| 3.10 |
400 |
0.39 |
H−1 → L+5(40%) H−1 → L+6(42%) |
| 3.65 |
340 |
0.05 |
H−8 → L(15%) H−4 → L+1(36%) |
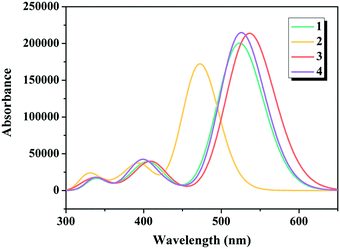 |
| | Fig. 4 Simulated absorption spectra of the studied dyes. | |
3.4. Intramolecular charge transfer analysis
The beneficial ICT process that occurs upon photoexcitation can improve the generation of efficient charge-separated states. To evaluate the extent of ICT, the key parameters of the studied dyes, including qCT, dCT and t, are given in Fig. 5. It is apparent that the qCT values increased as follows: dye 4 < dye 2 < dye 1 < dye 3, while the dCT and t values followed the order of dye 2 < dye 4 < dye 1 < dye 3. Dye 3 possessed the largest qCT (1.06 a.u.) and dCT (3.78 Å) combined with the largest t value (−0.35) among dyes 1–4, confirming that dye 3 acquired not only better light absorption ability, but also an improved CT process. Therefore, it is evident that the ICT properties of dyes can be regulated by appropriate acceptor groups.
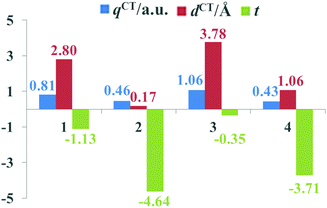 |
| | Fig. 5 The key ICT parameters of the studied dyes. | |
3.5. Dye aggregation effects
Dye aggregation is disadvantageous to the electron injection that results from the enhancement of charge recombination, which decreases the overall efficiency of the DSSCs. It is well-known that the effects of dye aggregation are geometry dependent; for example, dimer configurations are responsible for this effect.53 The most stable dimer configurations upon optimization as well as the ΔEtot values of dyes 1–4 are shown in Fig. 6 and Fig. S2 (ESI†), in which the arrowheads and arrow tails refer to the molecular acceptors and donor groups, respectively.
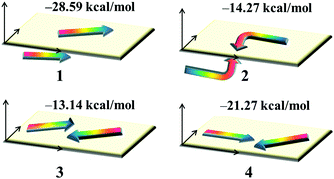 |
| | Fig. 6 The stable dimer configurations as well as the interaction energies ΔEtot of the studied dyes. | |
The plots of the electron density ρ(r) multiplied by the sign of the second Hessian eigenvalue λ2versus RDG of the dimers of dyes 1–4 were created to understand the nature of interactions in the different aggregation modes (Fig. 7), in which the blue, green and red areas represented the hydrogen bonds, van der Waals interactions and steric repulsions, respectively. It was found that the regions of weak interactions on the isosurfaces were around the acceptor groups, indicating that the dye aggregation effects correlate with the acceptor groups. The isosurfaces of the dimers of dyes 2–4 lie between hydrogen and oxygen, which were attributed to the hydrogen bonds, while π–π stacking interactions also existed in the dimer of dye 1, resulting in the largest ΔEtot value (−28.60 kcal mol−1) among the dyes 1–4. As shown in Table 2, dyes 2–4 possessed smaller ΔEtot values than that of dye 1 because of their smaller ΔEorb and ΔEsteric values, which were beneficial for electron injection. In addition, the smallest ΔEorb value was observed for dye 3 with the 5-methylenepyrimidine-2,4,6(1H,3H,5H)-trione acceptor group, which is responsible for the smallest ΔEtot value (−13.15 kcal mol−1).
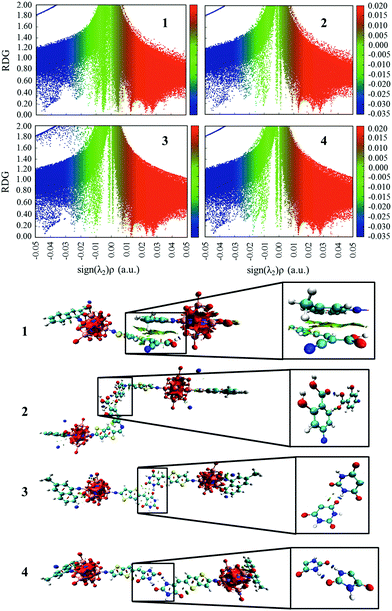 |
| | Fig. 7 The plots of the production of electron density ρ(r) and the sign of the second Hessian eigenvalue λ2versus RDG and the gradient isosurfaces with RDG = 0.5 a.u. for the dimers of studied dyes. | |
Table 2 The orbital interaction ΔEorb (kcal mol−1), steric interaction ΔEsteric (kcal mol−1) as well as interaction energy ΔEtot (kcal mol−1) of studied dyes
| Dye |
ΔEorb |
ΔEsteric |
ΔEtot |
|
1
|
−19.97 |
−8.63 |
−28.60 |
|
2
|
−11.36 |
−2.91 |
−14.27 |
|
3
|
−10.20 |
−2.95 |
−13.15 |
|
4
|
−15.95 |
−5.32 |
−21.27 |
Considering that one of the important tasks of these dyes is to harvest sunlight,54 the simulated absorption spectra of the dimers of dyes 1–4 are illustrated in Fig. 8, and the calculated Ev, λmax, f and major electronic compositions are listed in Table S2 (ESI†). The maximum absorption bands of the dimers of dyes 1–4 were in the order: 2-dimer (474 nm) < 1-dimer (511 nm) < 3-dimer (534 nm) < 4-dimer (549 nm). The λmax of the dimers of dyes 1–3 were similar to that of their respective monomers, while the λmax of the dimer of dye 4 red-shifted compared to the monomer. Moreover, the dimers of dyes 1–4 had increased f values.
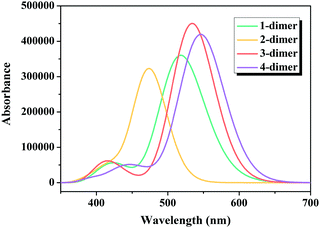 |
| | Fig. 8 Simulated absorption spectra for the dimers of studied dyes. | |
3.6. Factors influencing JSC
It is known that large LHE and VDA values, negative ΔGinj and ΔGreg values combined with a small |ΔGinj + χ| value can guarantee a high JSC, according to the discussion in the “Theoretical background” part. The LHE values, the oxidation potential of ground state dye Edye, the oxidation potential of excited state dye Edye*, the electron injection driving force ΔGinj, the regeneration-driving force ΔGreg and reorganization energies χ of the studied dyes were computed and are summarized in Table 3. Dyes 1–4 showed negative ΔGinj, implying that they had enough driving force to inject electrons into the TiO2 surface. The electronic coupling strengths of the dyes were estimated by the delocalization degree of the LUMOs over the anchoring atoms, namely, the fragment contribution of the anchoring atoms for LUMOs.55–57 The percentage composition of the LUMOs of dyes 1–4 are depicted in Fig. 9. It can be seen that the composition of the anchoring atoms in the LUMOs of dyes 1–4 are in the order of 2 (10%) < 4 (24%) < 1 (29%) < 3 (31%), indicating that dye 3 had the strongest electronic coupling, which is beneficial for injecting electrons into TiO2. Simultaneously, the ΔGreg of for dyes 1–4 were in the order: 3 (−10.04) < 1 (−10.03) < 2 (−9.98) < 4 (−9.69), and the values of |ΔGinj + χ| were in the order: 3 (0.37) < 4 (0.67) < 2 (0.68) = 1 (0.68). Based on the above discussions, the JSC of dye 3 would be the largest.
Table 3 The LHE, oxidation potential of ground state dye Edye (eV), oxidation potential of excited state dye Edye* (eV), electron injection driving force ΔGinj (eV), regeneration driving force ΔGreg (eV) and reorganization energy χ (eV) of studied dyes
| Dye |
LHE |
E
dye
|
E
dye* |
ΔGinj |
ΔGreg |
χ
|
ΔGinj + χ |
|
1
|
0.991 |
5.23 |
2.87 |
−1.13 |
−10.03 |
0.45 |
−0.68 |
|
2
|
0.987 |
5.18 |
2.56 |
−1.44 |
−9.98 |
0.76 |
−0.68 |
|
3
|
0.990 |
5.24 |
2.94 |
−1.06 |
−10.04 |
0.69 |
−0.37 |
|
4
|
0.996 |
4.89 |
2.53 |
−1.47 |
−9.69 |
0.80 |
−0.67 |
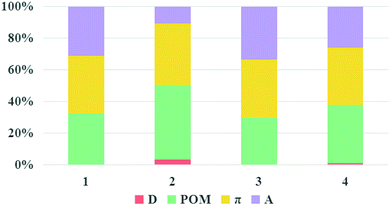 |
| | Fig. 9 Molecular orbital compositions of the LUMOs of the studied dyes. | |
3.7. The adsorption of dye on the TiO2 surface
Dyes with larger Eads exhibit superior adsorption stability. The adsorption mode between the dyes and TiO2 is a crucial factor for the electron injection process, which affects the electronic coupling and the surface state energetic activity. For the carboxylic acid group present in dyes 1 and 2, a bidentate bridging mode was extensively investigated.58,59 However, the adsorption modes of the electron acceptor groups 5-methylenepyrimidine-2,4,6(1H,3H,5H)-trione and 5-methyleneimidazolidine-2,4-dione in dyes 3 and 4 have been rarely studied. Considering that the O and N atoms in the acceptor groups could interact with the unsaturated five-fold coordinated Ti atoms (Ti5c) on the TiO2 surface, ten possible adsorption modes for dyes 3 and 4, including dissociative (D) and molecular (M) modes, were considered using 3/4-TiO2 complexes, as depicted in Fig. S3 (ESI†), and the corresponding details are described in ESI.†
After the optimization of the initial structures of the 3-TiO2 complex, only four adsorption modes were obtained, and the optimized structures with their Eads and specific interatomic distances are depicted in Fig. S4 (ESI†). It was found that the structures 3-D1 and 3-D4 were the same upon optimization (expressed as group I). Similarly, the same structures were obtained for the initial configurations 3-D2, 3-D3 and 3-M1 as well as 3-D5, 3-D6, 3-D7 and 3-M2 (expressed as group II and group III, respectively), and 3-D8 was expressed as group IV. We found that Eads increased in the following order: group IV (15 kcal mol−1) < group II (−63 kcal mol−1) < group I (−67 kcal mol−1) < group III (−93 kcal mol−1), confirming that group III was the most stable due to the largest Eads. Simultaneously, seven optimized geometrical structures for the 4-TiO2 complex are shown in Fig. S4 (ESI†); the same structures were obtained on optimizing 4-D2 and 4-M1 as well as 4-D5, 4-D6 and 4-M2 and the most stable adsorption mode was the 4-D4 configuration. The most stable adsorption structures for the dye–TiO2 complexes with the calculated Eads values and specific interatomic distances are shown in Fig. 10. The Eads values were calculated to be −74, −81, −93 and −96 kcal mol−1 for dyes 1–4, respectively, indicating that dyes 1–4 were chemisorbed on the surface of the semiconductor.60 The binding strengths between the acceptor groups in dyes 2–4 and TiO2 were stronger than that of cyanoacrylic acid in dye 1 due to larger Eads values of dyes 2–4, and particularly, the 5-methylenepyrimidine-2,4,6(1H,3H,5H)-trione acceptor group in dye 3 and 5-methyleneimidazolidine-2,4-dione in dye 4 possessed superior adsorption ability to the TiO2 surface, which is in favour of device stability.
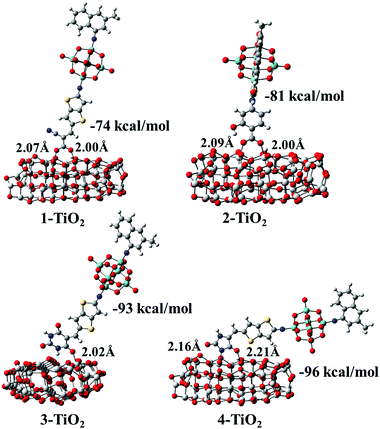 |
| | Fig. 10 Optimized geometrical structures with adsorption energies (Eads) and specific interatomic distances for dye–TiO2 complexes. | |
3.8. Factors influencing VOC
The dye adsorbed on the TiO2 surface affects the ΔECB value, and thus further changes the VOC of DSSCs. The ΔECB of the studied dyes were obtained by calculating the DOS profiles of pure TiO2 and PDOS profiles of TiO2 in the dye–TiO2 complexes, as shown in Fig. 11, and the values increased in the following order: dye 2 (0.47 eV) < dye 1 (0.49 eV) < dye 4 (0.56 eV) < dye 3 (0.61 eV), indicating that the acceptor groups significantly affected the ΔECB. In order to deeply understand how the molecular structure of the dye affects ΔECB, two main effects, including the charge transfer effect attributed to the dye–TiO2 bond formation and the electrostatic effect owing to the dye dipole moment, were considered. The results demonstrate that the largest ΔECB for dye 3 among the dyes 1–4 is caused by the largest nCT and VEL, as shown in Table 4, predicting that dye 3 could achieve the largest VOC. Moreover, VOC was calculated, and the corresponding values are summarized in Table 5, in which dye 3 possesses the largest VOC, which is consistent with the discussion above.
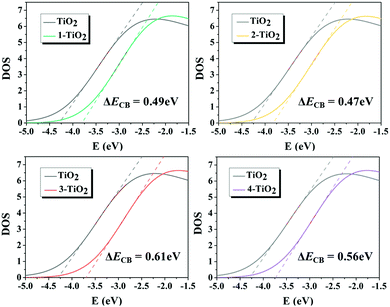 |
| | Fig. 11 Total and partial density of states (DOS) of the dye–(TiO2)48 complexes. | |
Table 4 The CB shift (ΔECB, eV), transfer charge (nCT, e−) of the dyes adsorbed onto TiO2, and the average electrostatic potential (VEL, eV) of the studied dyes
| Dye |
ΔECB |
n
CT
|
V
EL
|
|
1
|
0.49 |
0.29 |
−0.26 |
|
2
|
0.47 |
0.08 |
−0.23 |
|
3
|
0.61 |
0.40 |
−0.28 |
|
4
|
0.56 |
0.04 |
−0.25 |
Table 5 Estimated ECB (eV), nc (cm−3) and VOC (mV) of the studied dyes
| Dye |
E
CB
|
n
c
|
V
OC
|
|
1
|
−3.51 |
1.87 × 10²² |
1375 |
|
2
|
−3.53 |
6.09 × 10²¹ |
1326 |
|
3
|
−3.39 |
6.34 × 10²¹ |
1467 |
|
4
|
−3.44 |
6.07 × 10²¹ |
1416 |
4. Conclusions
A theoretical investigation on POM-based dyes with different acceptor groups is presented to screen for efficient acceptor group candidates better than the cyanoacrylic acid group. Besides the electronic properties, absorption spectra and ICT parameters, the key factors that affect JSC and VOC, the most stable adsorption modes of the acceptor groups in dyes 1–4 on the TiO2 surface have been taken into consideration as a major factor affecting the performance of DSSCs. The results indicate that the acceptor groups in dyes 2–4 showed increased binding strength to the TiO2 surface than that of cyanoacrylic acid in dye 1, contributing to the device stability. Besides, dye 3 with the 5-methylenepyrimidine-2,4,6(1H,3H,5H)-trione acceptor group not only exhibited the broadest absorption spectra, the largest ICT parameters, the lowest interaction energy between two dimers, the largest JSC and VOC values resulting from the largest ΔECB, but also possessed superior adsorption stability among the dyes 1–4, which can facilitate the improvement of the performance of DSSCs. Thus, 5-methylenepyrimidine-2,4,6(1H,3H,5H)-trione is expected to replace the commonly used cyanoacrylic acid and can be considered a promising acceptor group for high-performance POM-based dyes used in DSSCs. Our results allow us to trace the structure–property relationships required for further development of dyes for DSSCs.
Conflicts of interest
There are no conflicts to declare.
Acknowledgements
The authors gratefully acknowledge financial support by NSFC (21403033 and 21571031). We acknowledge Institute of Theoretical Chemistry, Jilin University for providing the computational resources for this work.
Notes and references
- B. O'Regan and M. Grätzel, Nature, 1991, 353, 737 CrossRef.
- K. Kakiage, Y. Aoyama, T. Yano, K. Oya, J.-I. Fujisawa and M. Hanaya, Chem. Commun., 2015, 51, 15894 RSC.
- Y. S. Tingare, N.S.n. Vinh, H. H. Chou, Y. C. Liu, Y. S. Long, T. C. Wu, T. C. Wei and C. Y. Yeh, Adv. Energy Mater., 2017, 7, 1700032 CrossRef.
- B. Basheer, D. Mathew, B. K. George and C. P. Reghunadhan Nair, Sol. Energy, 2014, 108, 479 CrossRef CAS.
- A. Müller, F. Peters, M. T. Pope and D. Gatteschi, Chem. Rev., 1998, 98, 239 CrossRef PubMed.
- V. Artero, A. Proust, P. Herson, F. Villain, D. M. C. Cartier and P. Gouzerh, J. Am. Chem. Soc., 2003, 125, 11156 CrossRef CAS PubMed.
- M. T. Pope and A. Müller, Angew. Chem., Int. Ed. Engl., 1991, 30, 34 CrossRef.
- D. L. Long, R. Tsunashima and L. Cronin, Angew. Chem., Int. Ed., 2010, 49, 1736 CrossRef CAS PubMed.
- S. S. Wang and G. Y. Yang, Chem. Rev., 2015, 115, 4893 CrossRef CAS PubMed.
- J. T. Rhule, C. L. Hill, D. A. Judd and R. F. Schinazi, Chem. Rev., 1998, 98, 327 CrossRef CAS.
- J. M. Clemente-Juan and E. Coronado, Coord. Chem. Rev., 1999, 193-195, 361 CrossRef CAS.
- M. Sadakane and E. Steckhan, Chem. Rev., 1998, 98, 219 CrossRef CAS.
- X. W. Guo, J. S. Li, X. J. Sang, W. L. Chen, Z. M. Su and E. B. Wang, Chem. – Eur. J., 2016, 22, 3234 CrossRef CAS PubMed.
- X. W. Guo, X. H. Li, Z. J. Liu, W. L. Chen, X. T. Zheng, E. B. Wang and Z. M. Su, Inorg. Chem. Front., 2017, 4, 1187 RSC.
- J. B. Strong, G. P. A. Yap, R. Ostrander, L. M. Liable-Sands, A. L. Rheingold, R. Thouvenot, P. Gouzerh and E. A. Maatta, J. Am. Chem. Soc., 2000, 122, 639 CrossRef CAS.
- J. Mao, N. He, Z. Ning, Q. Zhang, F. Guo, L. Chen, W. Wu, J. Hua and H. Tian, Angew. Chem., Int. Ed., 2012, 51, 9873 CrossRef CAS PubMed.
- F. L. Guo, Z. Q. Li, X. P. Liu, L. Zhou, F. T. Kong, W. C. Chen and S. Y. Dai, Adv. Funct. Mater., 2016, 26, 5733 CrossRef CAS.
- C. L. Mai, T. Moehl, C. H. Hsieh, J. D. Décoppet, S. M. Zakeeruddin, M. Grätzel and C. Y. Yeh, ACS Appl. Mater. Interfaces, 2015, 7, 14975 CrossRef CAS.
- H. He, A. Gurung and L. Si, Chem. Commun., 2012, 48, 5910 RSC.
- T. Higashino, Y. Fujimori, K. Sugiura, Y. Tsuji, S. Ito and H. Imahori, Angew. Chem., Int. Ed., 2015, 54, 9052 CrossRef CAS PubMed.
- X. M. Zhang, M. L. Tong and X. M. Chen, Angew. Chem., Int. Ed., 2002, 114, 1029 CrossRef.
- L. Kronik and S. Kümmel, Adv. Mater., 2018, 1706560 CrossRef.
- T. Zhang, W. Guan, T. Y. Ma, J. Wang, L. K. Yan and Z. M. Su, Phys. Chem. Chem. Phys., 2015, 17, 5459 RSC.
- Y. Gao, W. Guan, L. K. Yan and Y. H. Xu, Phys. Chem. Chem. Phys., 2019, 21, 3822 RSC.
- H. N. Wu, T. Zhang, C. X. Wu, W. Guan, L. K. Yan and Z. M. Su, Dyes Pigm., 2016, 130, 168 CrossRef CAS.
- Y. Gao, W. Guan and L. K. Yan, J. Phys. Chem. A, 2018, 122, 7491 CrossRef CAS.
- W. Y. Zhang, J. J. Wu, Y. P. Wen, W. P. Wu and L. Wang, Dyes Pigm., 2018, 149, 908 CrossRef CAS.
- R. A. Marcus, J. Chem. Phys., 1956, 24, 966 CrossRef CAS.
- R. Katoh, A. Furube, T. Yoshihara, K. Hara, G. Fujihashi, S. Takano, S. Murata, H. Arakawa and M. Tachiya, J. Phys. Chem. B, 2004, 108, 4818 CrossRef CAS.
- M. Grätzel, Nature, 2001, 414, 338 CrossRef PubMed.
- T. Daeneke, A. J. Mozer, Y. Uemura, S. Makuta, M. Fekete, Y. Tachibana, N. Koumura, U. Bach and L. Spiccia, J. Am. Chem. Soc., 2012, 134, 16925 CrossRef CAS PubMed.
- I. Ciofini, T. L. Bahers, C. Adamo, F. Odobel and D. Jacquemin, J. Phys. Chem. C, 2012, 116, 11946 CrossRef CAS.
-
T. Lu, Multiwfn Manual, Version 3.6(dev), Section 3.100.8, available at http://sobereva.com/multiwfn.
- W. Y. Zhang, P. P. Heng, H. S. Su, T. G. Ren, L. Wang and J. L. Zhang, J. Phys. Chem. C, 2018, 122, 25219 CrossRef CAS.
- W. Ma, Y. Jiao and S. Meng, J. Phys. Chem. C, 2014, 118, 16447 CrossRef CAS.
-
M. J. Frisch, G. W. Trucks, H. B. Schlegel, G. E. Scuseria, M. A. Robb, J. R. Cheeseman, G. Scalmani, V. Barone, B. Mennucci, G. A. Petersson, H. Nakatsuji, M. Caricato, X. Li, H. P. Hratchian, A. F. Izmaylov, J. Bloino, G. Zheng, J. L. Sonnenberg, M. Hada, M. Ehara, K. Toyota, R. Fukuda, J. Hasegawa, M. Ishida, T. Nakajima, Y. Honda, O. Kitao, H. Nakai, T. Vreven, J. A. Montgomery Jr., J. E. Peralta, F. Ogliaro, M. Bearpark, J. J. Heyd, E. Brothers, K. N. Kudin, V. N. Staroverov, R. Kobayashi, J. Normand, K. Raghavachari, A. Rendell, J. C. Burant, S. S. Iyengar, J. Tomasi, M. Cossi, N. Rega, J. M. Millam, M. Klene, J. E. Knox, J. B. Cross, V. Bakken, C. Adamo, J. Jaramillo, R. Gomperts, R. E. Stratmann, O. Yazyev, A. J. Austin, R. Cammi, C. Pomelli, J. W. Ochterski, R. L. Martin, K. Morokuma, V. G. Zakrzewski, G. A. Voth, P. Salvador, J. J. Dannenberg, S. Dapprich, A. D. Daniels, O. Farkas, J. B. Foresman, J. V. Ortiz, J. Cioslowski and D. J. Fox, Gaussian 09, Revision D.01, Gaussian, Inc., Wallingford, CT, 2009 Search PubMed.
- F. J. Devlin, J. W. Finley, P. J. Stephens and M. J. Frisch, J. Phys. Chem., 1995, 99, 16883 CrossRef CAS.
- J. Tomasi, B. Mennucci and R. Cammi, Chem. Rev., 2005, 105, 2999 CrossRef CAS.
- J. P. Perdew, M. Ernzerhof and K. Burke, J. Chem. Phys., 1996, 105, 9982 CrossRef CAS.
- J. Hao, L. Ruhlmann, Y. L. Zhu, Q. Li and Y. G. Wei, Inorg. Chem., 2007, 46, 4960 CrossRef CAS.
-
T. Lu, Molclus Program, Version 1.5, http://www.keinsci.com/research/molclus.html.
- S. Grimme, S. Ehrlich and L. Goerigk, J. Comput. Chem., 2011, 32, 1456 CrossRef CAS.
- E. R. Johnson, S. Keinan, P. Mori-Sánchez, J. Contreras-García, A. J. Cohen and W. Yang, J. Am. Chem. Soc., 2010, 132, 6498 CrossRef CAS.
-
T. Lu, Multiwfn, Version 3.6, A multifunctional wavefunction analyzer, see http://multiwfn.codeplex.com.
- Y. Zhao, N. E. Schultz and D. G. Truhlar, J. Chem. Theory Comput., 2006, 2, 364 CrossRef.
- B. Delley, J. Chem. Phys., 2000, 113, 7756 CrossRef CAS.
- J. P. Perdew, K. Burke and M. Ernzerhof, Phys. Rev. Lett., 1996, 77, 3865 CrossRef CAS.
- T. Mudchimo, S. Namuangruk, N. Kungwan and S. Jungsuttiwong, Appl. Catal., A, 2018, 557, 79 CrossRef CAS.
- J. P. Perdew and Y. Wang, Phys. Rev. B: Condens. Matter Mater. Phys., 1992, 45, 13244 CrossRef.
- U. C. Singh and P. A. Kollman, J. Comput. Chem., 1984, 5, 129 CrossRef CAS.
- B. H. Besler, K. M. Merz and P. A. Kollman, J. Comput. Chem., 1990, 11, 431 CrossRef CAS.
- J. Preat, D. Jacquemin, C. Michaux and E. A. Perpète, Chem. Phys., 2010, 376, 56 CrossRef CAS.
- A. Mishra, M. K. R. Fischer and P. Buerle, Angew. Chem., Int. Ed., 2009, 48, 2474 CrossRef CAS.
- Y. P. Wen, W. Y. Zhang, X. R. Zhu, J. L. Zhang and L. Wang, Energy, 2018, 158, 537 CrossRef CAS.
- S. Nachimuthu, W. C. Chen, E. G. Leggesse and J. C. Jiang, Phys. Chem. Chem. Phys., 2016, 18, 1071 RSC.
- R. Jose, A. Kumar, V. Thavasi, K. Fujihara, S. Uchida and S. Ramakrishna, Appl. Phys. Lett., 2008, 93, 023125 CrossRef.
- B. G. Kim, C. G. Zhen, E. J. Jeong, J. Kieffer and J. Kim, Adv. Funct. Mater., 2012, 22, 1606 CrossRef CAS.
- Z. S. Wang, K. Hara, Y. Dan-oh, C. Kasada, A. Shinpo, S. Suga, H. Arakawa and H. Sugihara, J. Phys. Chem. B, 2005, 109, 3907 CrossRef CAS PubMed.
- K. Srinivas, K. Yesudas, K. Bhanuprakash, V. J. Rao and L. Giribabu, J. Phys. Chem. C, 2009, 113, 20117 CrossRef CAS.
- W. Li, J. Wang, J. Chen, F. Q. Bai and H. X. Zhang, Phys. Chem. Chem. Phys., 2014, 16, 9458 RSC.
Footnote |
| † Electronic supplementary information (ESI) available: Details including the average dye electrostatic potential, dissociative (D) and molecular (M) adsorption modes. Figures displaying experimental and theoretical absorption spectra of [Mo6O18(N-1-C10H6-2-CH3)]2−; optimized most stable dimer structures as well as the interaction energies ΔEtot for studied dyes; possible adsorption configurations for dyes 3 and 4 on the TiO2 surface; optimized geometrical structures with adsorption energies (Eads) and specific interatomic distances for dyes 3 and 4 on the TiO2 surface. Tables compiling experimental and theoretical absorption spectra of [Mo6O18(N-1-C10H6-2-CH3)]2−; the calculated excitation energies Ev (eV), maximum absorption wavelengths λmax (nm), oscillator strengths f and major electronic compositions for dimers of dyes 1–4. See DOI: 10.1039/c9tc04025k |
|
| This journal is © The Royal Society of Chemistry 2020 |
Click here to see how this site uses Cookies. View our privacy policy here.  ,
Li-Kai
Yan
 * and
Zhong-Min
Su


