Development of a U-bent plastic optical fiber biosensor with plasmonic labels for the detection of chikungunya non-structural protein 3
Ankitha
George
a,
M. S.
Amrutha
 a,
Priyanshu
Srivastava
 b,
Sujatha
Sunil
*b,
V. V. R.
Sai
*c and
Ramanathan
Srinivasan
 *a
*a
aDepartment of Chemical Engineering, Indian Institute of Technology, Madras, India. E-mail: srinivar@iitm.ac.in
bInternational Centre for Genetic Engineering and Biotechnology, Delhi, India. E-mail: sujatha@icgeb.res.in
cDepartment of Applied Mechanics, Indian Institute of Technology, Madras, India. E-mail: vvrsai@iitm.ac.in
First published on 2nd October 2020
Abstract
This study presents a novel plasmonic fiber optic sandwich immunobiosensor for the detection of chikungunya, an infectious mosquito-borne disease with chronic musculoskeletal pain and acute febrile illness, by exploiting non-structural protein 3 (CHIKV-nsP3) as a biomarker. A plasmonic sandwich immunoassay for CHIKV-nsP3 was realized on the surface of a compact U-bent plastic optical fiber (POF, 0.5 mm core diameter) with gold nanoparticles (AuNPs) as labels. The high evanescent wave absorbance (EWA) sensitivity of the U-bent probes allows the absorption of the light passing through the fiber by the AuNP labels, upon the formation of a sandwich immunocomplex of CHIKV-nsP3 on the core surface of the U-bent probe region. A simple optical set-up with a low-cost green LED and a photodetector on either end of the U-bent probe gave rise to a detection limit of 0.52 ng mL−1 (8.6 pM), and a linear range of 1–104 ng mL−1 with a sensitivity of 0.1043A530 nm/log(CnsP3). In addition, the plasmonic POF biosensor shows strong specificity towards the CHIKV-nsP3 analyte in comparison with Pf-HRP2, HIgG, and dengue whole virus. The results illustrate the potential of plasmonic POF biosensors for direct and sensitive point-of-care detection of the chikungunya viral disease.
Introduction
Biosensors are analytical devices that use state-of-the-art technology with various biological entities to find applications in a variety of fields, especially disease diagnosis.1,2 The integration of the extreme specificity and sensitivity of bioaffinity molecules and physiochemical transducers to provide sophisticated and accurate bioanalytical results paved the way for the development and further research of handy and straightforward portable diagnostic devices.3 Biosensors can be developed either as label-free or labeled, in which the former generates signals directly when a biorecognition event takes place.4,5 The latter one requires an external element physically or chemically attached to the biomolecule of interest, and it will generate or amplify the signal due to additional interactions.6 Biosensors employ micro- and nanofabrication techniques with various sensing strategies such as electrochemical, optical, piezoelectric, or magnetic methods,7 and they have shown potential to be utilized for early and fast diagnosis of deadly infectious diseases, including vector-borne diseases.8Chikungunya is amongst the major mosquito-borne diseases that are responsible for lifelong disabilities owing to the rheumatoid and neurological complications it inflicts on the affected individuals.9 Currently, the diagnosis of this viral infection is deficient due to its overlapping clinical symptoms with other diseases such as dengue and zika.10,11 Detection of antibodies against the chikungunya virus (CHIKV) is still the preferred way of diagnosis, and several recent attempts have been made to detect CHIKV antigens in patient samples.12,13 For this purpose, several viral proteins have been utilized, such as envelope proteins, namely, CHIKV E1 and E2,12,14 and non-structural protein 3 (CHIKV-nsP3).13,15,16 Similarly, immuno-chromatographic tests and biosensing have also been employed to detect antigens with varying success rates.13,14,16–18 Amongst these methods, biosensing schemes are gaining popularity owing to the ease of techniques and portability of the assays as point-of-care diagnostics with limited expertise and infrastructure.13,17,18
Fiber-optic biosensors based on evanescent wave absorbance, especially U-bent fiber optic sensor probes in combination with plasmonic nanomaterials, offer several advantages, including dipping or drop-casting of samples for biochemical reactions, rapid and real-time response and improved analyte detection limits with more straightforward optoelectronic instrumentation.19,20 The sensing mechanism is based on the evanescent wave (EW) at the core–medium interface of a decladded fiber, which is an exponentially decaying fraction of light penetrating the optically thinner medium during total internal reflection.21,22 While the intensity of EW depends on the refractive index (RI) of the adjacent medium, the light propagating through the fiber can undergo attenuation in the presence of optically active elements (e.g., a chromophore) within the EW field. The optical absorption through the U-bent probe is directly proportional to the number of chromophores and their extinction coefficient. It can be monitored in real-time.23,24 Currently, plastic optical fibers (POF) are being considered as a better replacement of conventional silica fibers in view of their handiness, flexibility, and ease of machinability,25–27 and compared to straight probes, the U-bent probe geometry in optical fibers has been proven to provide a significant improvement in the absorbance sensitivity.28–32 The multimode fibers typically employed in the construction of U-bent probes allow the use of a pair of simple LEDs and a photodetector to couple light into the fiber and measure the optical losses, respectively.21,29,33,34 Fiber probes with suitable modifications can be used for the detection of biological and environmental samples, with an excellent limit of detection (LOD).35,36
In this work, we have developed a U-bent POF based biosensor with plasmonic labels to detect CHIKV-nsP3. To the best of our knowledge, this is the first report on the detection of the CHIKV antigen using an optical transduction method. A labeled sandwich immunoassay was established using POFs, in which the target analytes were introduced to the optical fiber surface immobilized with the primary antibody, and the resulting antibody–antigen complex was captured with a secondary antibody conjugated with gold nanoparticles (AuNPs). The AuNPs were used as labels on account of their higher extinction coefficient than those of conventional labels, ability to conjugate biomolecules, and tunable size and shape.37–39 The LOD, sensitivity, and specificity of the developed immunosensors were evaluated. The surface morphological changes after performing the sandwich immunoassay were characterized using scanning electron microscopy (SEM).
Experimental
Materials and reagents
Super ESKATM plastic optical fibers of 250 and 500 μm (SK 10 and SK 20, respectively) were purchased from Keiko Corporation, Japan. Sulphuric acid (H2SO4), hexamethylene diamine (HMDA), gold(III) chloride (HAuCl4), sodium citrate dihydrate, sodium hydroxide (NaOH), thiolated polyethylene glycol (SH-PEG, M.W 6000 Da), monoclonal anti-polyhistidine antibody, phosphate buffered saline (PBS) and bovine serum albumin (BSA) were procured from Sigma Aldrich, India. Glutaraldehyde was purchased from Fluka. All the chemicals used in the experiments were of analytical grade. Milli-Q water (18.2 MΩ cm at 25 °C, from Millipore) was used in all the experiments.Fabrication of U-bent POF probes
The core and cladding of the POF are made of polymethyl methacrylate (PMMA) and a fluorinated polymer, with a refractive index of 1.49 and 1.41, respectively. The U-bent POF probes were made as described elsewhere.26 Briefly, 25 cm long 250 and 500 μm POFs bent at the middle portion were inserted into capillary glass tubes of 1 and 1.75 mm diameters, respectively. The capillaries were sealed with Scotch tape and heated at 95 °C for 10 min to obtain U-bent probes with 0.75 and 1.5 mm bend diameters, respectively. The U-bent region was decladded through chemical etching by incubating the probes in ethyl acetate for 2 minutes. The variations between the probes were minimized by carefully choosing the probes with an RI sensitivity of around 3.404 ± 0.11A530 nm RIU-1 for further analysis. The RI sensitivity was verified by exposing the POFs to sucrose solutions of various concentrations, as described elsewhere.26Surface functionalization
The decladded surface was pretreated by rinsing the fiber probe with ethanol and then thoroughly washing with de-ionized water (DI). The cleaned U-bent probe surface was then exposed to 1 M H2SO4 for 5 minutes. This step is necessary to obtain carboxylic groups on the PMMA surface by the reduction of the methyl ester groups via acid hydrolysis.40 Then amine functional groups were generated on the surface by incubating the probes in 10% HMDA solution in 100 mM borate buffer for two hours at room temperature. The pH of the buffer was 11.5. After rinsing thoroughly with DI water, the probes were exposed to 2.5% glutaraldehyde for 30 minutes.Immobilization of primary antibodies
The anti-polyhistidine monoclonal antibody was used as the primary (receptor) antibody to capture the CHIKV-nsP3 protein through the histidine tags at its N-terminus. The glutaraldehyde functionalized fiber surface was incubated in 100 μg mL−1 of primary antibody diluted in 10 mM PBS and stored overnight at 4 °C. Biorecognition molecules were attached to the aldehyde functionalized probe surface through their amine groups via Schiff's base links.41 Subsequently, the probes were thoroughly washed with PBS and incubated in 5 mg mL−1 BSA for 30 minutes to block unbound sites.Gold nanoparticle synthesis and conjugation with capture antibodies
The anti-CHIKVnsP3 polyclonal antibody (CHIKV-nsP3Ab) was used as the detection antibody to perform the sandwich immunoassay with 40 nm AuNPs as labels. The purification and isolation of the CHIKV-nsP3 analyte and CHIKV-nsP3Ab were carried out as per the procedures described elsewhere.13 AuNPs of specific size were prepared in our lab as per the protocol described by Turkevich et al.42 Briefly, 200 μL of 0.05 M AuCl3 solution was added to 39.15 mL of DI water, and this solution was heated. As soon as boiling commenced, 0.647 mL of 5 mg mL−1 sodium citrate trihydrate solution was added. The heating was continued until the solution color changed to pale purple. Subsequently, the solution was allowed to cool to room temperature. The absorbance spectra of the synthesized AuNP solution was recorded using a UV-vis spectrophotometer, and the maximum absorbance peak was observed at 529 nm.The concentration of CHIKV-nsP3Ab for conjugation was optimized, as described in the section ‘AuNP bioconjugation with anti-CHIKV-nsP3 antibodies’. For conjugation, 100 μl of CHIKV-nsP3Ab at an optimum concentration was added to 1 mL of 40 nm AuNP (pH adjusted to 8.5) and incubated for 30 minutes. Subsequently, the unbound surface was blocked using 80 μl of 320 μM SH-PEG for 15 minutes to avoid any non-specific binding. Then the solution was centrifuged at 7000 rpm for 25 minutes to remove the excess antibodies. The process was repeated thrice, and the final AuNP solution conjugated with CHIKV-nsP3Ab (AuNP-CHIKVnsP3Ab) was resuspended in PBS to 100 μL volume. The solution was kept at 4 °C until further use.
Optical setup
In a halogen-lamp based biosensor setup, power level drifts can be a serious issue. With the advent of LEDs, the drift is not significant, and hence we employed a green LED source to mitigate this issue. The optical fiber probes were connected to a green LED light source (M530F2, 200 mA, Thorlabs Inc., USA) driven by a steady current supply, and an optical power meter (PM100USB, Thorlabs Inc., USA) at either of its ends using a multimode SMA905 connector and a bare fiber terminator (BFT1) (Thorlabs Inc., USA). The absorbance was measured with an integration time of 1 ms, and the values reported were the average of 3000 samples.Direct and sandwich immunoassays
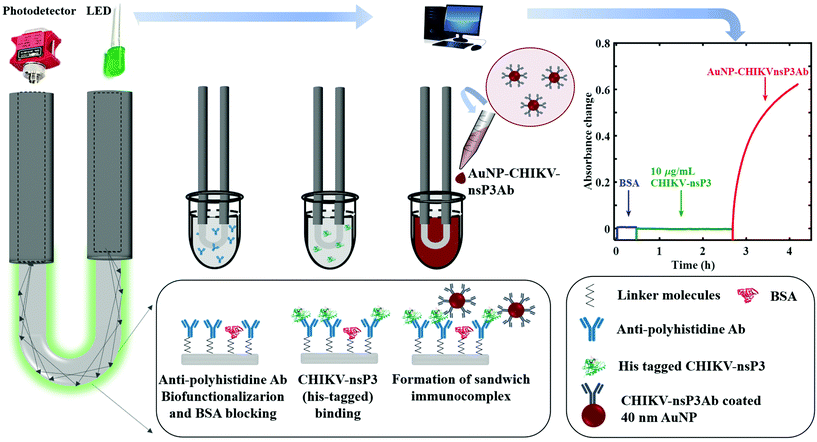
To perform a direct assay, i.e., without using a primary antibody, the aldehyde-treated fiber probes were incubated in 10 μg mL−1 CHIKV-nsP3 and left overnight at 4 °C. Subsequently, the probes were thoroughly washed in PBS before incubating them in 5 mg mL−1 BSA for ∼30 minutes to block the free aldehyde groups on the surface. The real-time absorbance change on the adsorption of AuNP-CHIKVnsP3Ab to the analyte bound probe was recorded.In sandwich immunoassay, a monoclonal anti-polyhistidine antibody was used as the bioreceptor (primary antibody) immobilized on the probe surface. CHIKV-nsP3 and AuNP-CHIKVnsP3Ab were used as the detection analyte and labeled secondary antibody, respectively. The U-bent probe surface was exposed to 30 μL of each sample taken in a 200 μL cell, and the real-time absorbance change was monitored as shown in Fig. 1. After incubating in CHIKV-nsP3 for ∼2 h, the biofunctionalized surfaces were exposed to AuNP-CHIKVnsP3Ab for ∼1.5 h. The sensitivity and LOD of the sensor, derived using the sandwich immunoassay, were assessed by analyzing the samples with different concentrations of the CHIKV-nsP3 analyte. A separate probe was employed for each concentration of the analyte. Control experiments were carried out by incubating the biofunctionalized probe directly onto AuNP-CHIKVnsP3Ab, i.e., without exposing the probe to the analyte. All the experiments were repeated three times, and the average and standard deviations are presented.
Surface characterization
The morphological changes from the bare probe to AuNP-CHIKVnsP3Ab-adsorbed fiber were evaluated using SEM analysis (S4800 SEM, Hitachi, Japan). An acceleration voltage of 5 keV was used in the SEM analysis.Specificity analysis
An ideal biosensor should have the ability to specifically quantify the analyte of interest while yielding little or no signal when exposed to other biomolecules.33 In order to analyze the specificity of the fiber optic immunosensor towards CHIKV-nsP3, it was exposed to different bio-analytes such as human immunoglobulin (HIgG), histidine-rich protein II of Plasmodium falciparum (Pf-HRP2) and dengue virus (DENV), and the absorbance changes were compared with those of the probes exposed to CHIKV-nsP3.Results and discussion
Earlier studies reveal that U-bent POF probes with a fiber core diameter less than 1000 μm and a bend diameter equal to thrice that of the fiber core are optimum for achieving the highest refractive index sensitivity.26,43 In order to identify the optimum POF diameter for biosensing, the U-bent probes fabricated using 250 and 500 μm POFs were evaluated using a model analyte. Human immunoglobulin G (HIgG) was chosen as the model analyte, and a plasmonic sandwich assay with HIgG was realized using POFs of different diameters. The HIgG detection results are described in the following section. Subsequently, POFs with the optimal diameter were used in CHIKV-nsP3 detection.Optimum U-bent POF probe geometry for biosensing
Here, goat anti-human IgG (GaHIgG) antibodies that are specific to fragment antigen-binding (Fab) and fragment crystallizable (Fc) regions of HIgG were used as the capture and detection antibodies, respectively. The capture antibodies were immobilized on the aldehyde functionalized U-bent probes, as described earlier. The AuNPs conjugated with 25 μg mL−1 Fc-GaHIgG (Gabs) were obtained as per a procedure reported in the literature.37A plasmonic sandwich immunoassay was realized on the U-bent probes made of 250 and 500 μm POFs using LEDs and a PD setup, as shown in Fig. 2(a) and (b), respectively, and the absorbance response was monitored in real-time. The Fab-GaHIgG immobilized U-bent probes were exposed to BSA solution for 15 minutes to minimize any non-specific binding. Then, the probes were incubated in the Gabs solution for 20 minutes to investigate the non-specific adsorption of Gabs on the BSA-coated probe surface. There was no considerable increase in the absorbance at 540 nm, indicating negligible adsorption of Gabs on the sensor surface. Subsequently, a sandwich immunocomplex formation on the U-bent probes was realized by incubating the probes in 1 μg mL−1 HIgG and Gabs for ∼1 hour and ∼30 minutes, respectively. Average absorbance responses of 1.14 ± 0.23 and 0.98 ± 0.043 were obtained from 250 and 500 μm U-bent probes, respectively. Although the 250 μm POF probes gave rise to nearly 15% more response, they were too flexible to position them tightly into microcentrifuge vials containing the analyte and Gabs. Because of this reason, a higher standard deviation of 20.2% was observed for 250 μm probes in comparison with 4.4% for 500 μm probes. Since the U-bent probes made of the 500 μm POF were easy to handle, they were used in all subsequent studies.
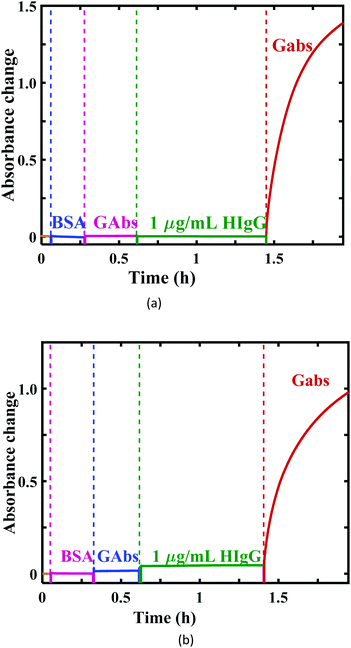 | ||
| Fig. 2 The real-time absorbance changes for HIgG detection using a plastic optical fiber with core diameters of (a) 250 μm and (b) 500 μm. | ||
AuNP bioconjugation with anti-CHIKV-nsP3 antibodies
Anti-CHIKV-nsp3 polyclonal antibodies were developed in-house as described elsewhere.13 Conjugation of AuNPs with CHIKV-nsp3Ab involves an investigation of the optimum dilution factor for the antibodies to be added to the AuNP solution and for the validation of the activity of AuNP-CHIKV-nsP3Ab conjugates.An optimum concentration of CHIKV-nsP3Ab for AuNP conjugation maximizes the presence of active antigen-binding sites by enabling a suitable orientation of the antibodies on the AuNP surface.44 To investigate the optimum concentration of CHIKV-nsP3Ab, several dilutions of the antibodies, including 1![[thin space (1/6-em)]](https://www.rsc.org/images/entities/char_2009.gif) :
:![[thin space (1/6-em)]](https://www.rsc.org/images/entities/char_2009.gif) 50, 1
50, 1![[thin space (1/6-em)]](https://www.rsc.org/images/entities/char_2009.gif) :
:![[thin space (1/6-em)]](https://www.rsc.org/images/entities/char_2009.gif) 150, 1
150, 1![[thin space (1/6-em)]](https://www.rsc.org/images/entities/char_2009.gif) :
:![[thin space (1/6-em)]](https://www.rsc.org/images/entities/char_2009.gif) 300, 1
300, 1![[thin space (1/6-em)]](https://www.rsc.org/images/entities/char_2009.gif) :
:![[thin space (1/6-em)]](https://www.rsc.org/images/entities/char_2009.gif) 600, and 1
600, and 1![[thin space (1/6-em)]](https://www.rsc.org/images/entities/char_2009.gif) :
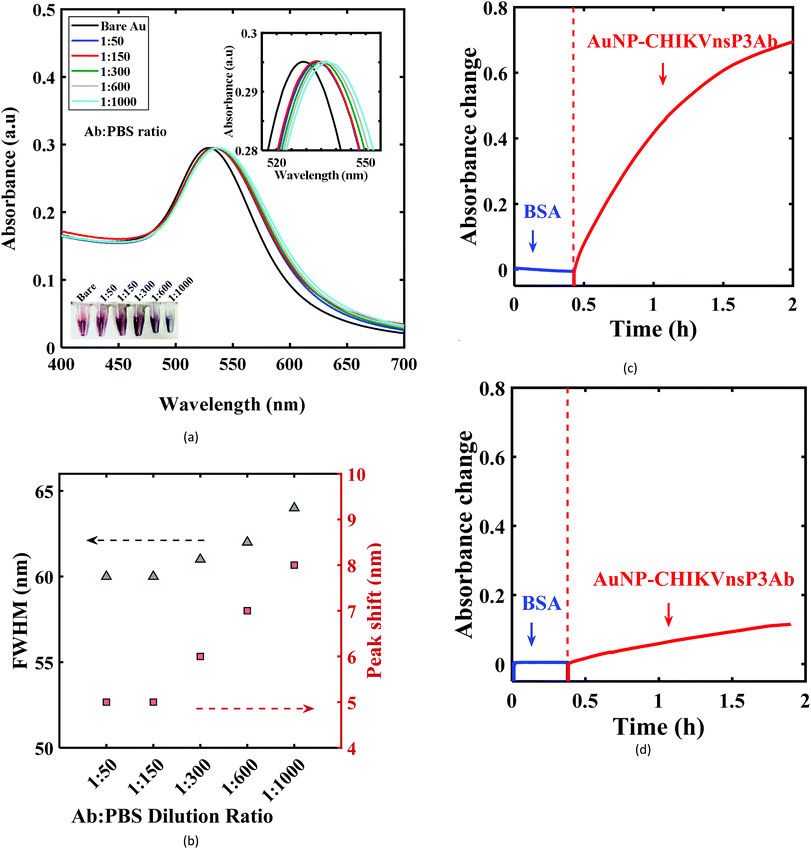
:![[thin space (1/6-em)]](https://www.rsc.org/images/entities/char_2009.gif) 1000, were prepared and added to AuNP solution (100 μL in 1 mL respectively) to obtain the AuNP bioconjugates. UV-visible absorbance spectra were obtained from these preparations, as shown in Fig. 3a (normalized). Their spectral characteristics, including the peak wavelength shift and the full width at half maxima (FWHM) of the plasmonic resonance response, were compared with those of bare AuNPs (Fig. 3b). When the dilution ratio was changed from 1
1000, were prepared and added to AuNP solution (100 μL in 1 mL respectively) to obtain the AuNP bioconjugates. UV-visible absorbance spectra were obtained from these preparations, as shown in Fig. 3a (normalized). Their spectral characteristics, including the peak wavelength shift and the full width at half maxima (FWHM) of the plasmonic resonance response, were compared with those of bare AuNPs (Fig. 3b). When the dilution ratio was changed from 1![[thin space (1/6-em)]](https://www.rsc.org/images/entities/char_2009.gif) :
:![[thin space (1/6-em)]](https://www.rsc.org/images/entities/char_2009.gif) 50 to 1
50 to 1![[thin space (1/6-em)]](https://www.rsc.org/images/entities/char_2009.gif) :
:![[thin space (1/6-em)]](https://www.rsc.org/images/entities/char_2009.gif) 150, the red-shift in the peak wavelength (peak at 534 nm), as well as the FWHM, remained at 5 nm and 60 nm, respectively. On the other hand, beyond a dilution ratio of 1
150, the red-shift in the peak wavelength (peak at 534 nm), as well as the FWHM, remained at 5 nm and 60 nm, respectively. On the other hand, beyond a dilution ratio of 1![[thin space (1/6-em)]](https://www.rsc.org/images/entities/char_2009.gif) :
:![[thin space (1/6-em)]](https://www.rsc.org/images/entities/char_2009.gif) 150, an increase in these characteristics was observed.
150, an increase in these characteristics was observed.
The photographic images of the vials with AuNP-CHIKV-nsP3Ab conjugates for dilutions of 1![[thin space (1/6-em)]](https://www.rsc.org/images/entities/char_2009.gif) :
:![[thin space (1/6-em)]](https://www.rsc.org/images/entities/char_2009.gif) 300 and beyond showed a visible change in the color from pink to pale purple (inset in Fig. 3a). A red-shift is anticipated after antibody conjugation due to the difference in the local refractive index.45 However, this is also possible with the aggregation of AuNPs due to the insufficiency of antibodies to completely cover a given AuNP surface and bridging two or more AuNPs.46 These results reveal a possible agglomeration of an increasing fraction of the AuNPs with dilution due to incomplete surface coverage by the antibodies. While 1
300 and beyond showed a visible change in the color from pink to pale purple (inset in Fig. 3a). A red-shift is anticipated after antibody conjugation due to the difference in the local refractive index.45 However, this is also possible with the aggregation of AuNPs due to the insufficiency of antibodies to completely cover a given AuNP surface and bridging two or more AuNPs.46 These results reveal a possible agglomeration of an increasing fraction of the AuNPs with dilution due to incomplete surface coverage by the antibodies. While 1![[thin space (1/6-em)]](https://www.rsc.org/images/entities/char_2009.gif) :
:![[thin space (1/6-em)]](https://www.rsc.org/images/entities/char_2009.gif) 50 and 1
50 and 1![[thin space (1/6-em)]](https://www.rsc.org/images/entities/char_2009.gif) :
:![[thin space (1/6-em)]](https://www.rsc.org/images/entities/char_2009.gif) 150 dilutions gave rise to a similar peak shift and FWHM, a lower antibody concentration is anticipated to provide a suitable side-on antibody orientation and a higher number of antigen-binding sites.44 Hence, the CHIKV-nsP3Ab dilution of 1
150 dilutions gave rise to a similar peak shift and FWHM, a lower antibody concentration is anticipated to provide a suitable side-on antibody orientation and a higher number of antigen-binding sites.44 Hence, the CHIKV-nsP3Ab dilution of 1![[thin space (1/6-em)]](https://www.rsc.org/images/entities/char_2009.gif) :
:![[thin space (1/6-em)]](https://www.rsc.org/images/entities/char_2009.gif) 150 was chosen as the optimum concentration for AuNP bioconjugation.
150 was chosen as the optimum concentration for AuNP bioconjugation.
Subsequently, the binding affinity of AuNP-CHIKV-nsP3Ab towards the CHIKV-nsP3 analyte was evaluated by performing a direct assay as follows. The functionalized U-bent probes were immobilized with CHIKV-nsP3 by incubating them in 10 μg mL−1 of CHIKV-nsP3 overnight at 4 °C and washing them with PBS. The bio-functionalized probes were then exposed to 5 mg mL−1 BSA to block unbound sites. Then, the probes were incubated in the AuNP-CHIKV-nsP3Ab solution to perform a direct assay. Fig. 3c shows the transient absorbance response due to the binding of AuNP-CHIKV-nsP3Ab to the analyte on the U-bent POF probe surface. Upon exposure to Gabs, a significant increase in the absorbance response of ∼0.72 ± 0.026 was seen. A control experiment was performed using a U-bent probe without the analyte on its surface. Instead of CHIKV-nsP3, the probe was incubated in BSA, and then it was exposed to AuNP-CHIKVnsP3Ab, and the results are shown in Fig. 3d. A small change in absorbance (∼0.12 ± 0.01) attributed to non-specific binding was observed from the control probe. With these results, we could confirm the activity of the AuNP-CHIKV-nsP3Ab conjugates towards CHIKV-nsP3 analyte detection.
Realization of a plasmonic POF immunobiosensor
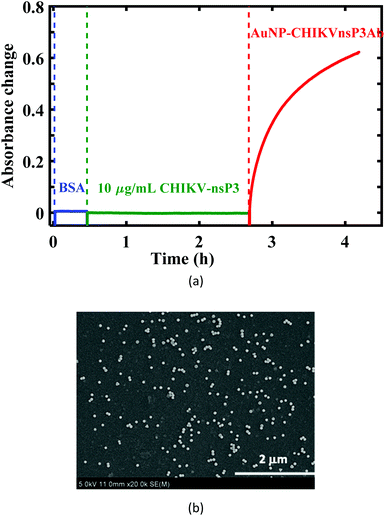
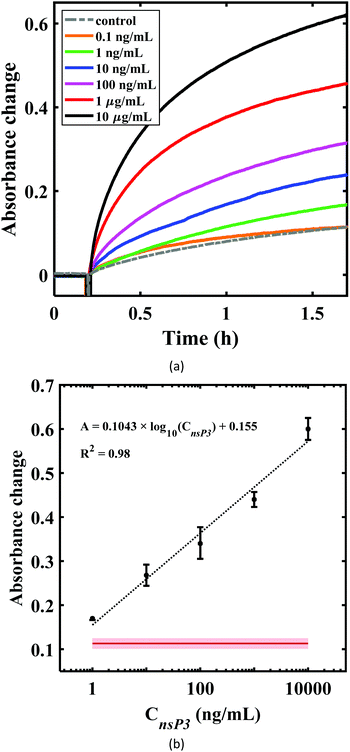
A proof-of-concept U-bent POF based plasmonic sandwich immunosensor was realized using a compact set-up consisting of a green LED and a photodetector. Fig. 4a shows the absorbance response obtained in real-time from a 500 μm U-bent POF probe functionalized with poly-histidine antibodies incubated in 5 mg mL−1 BSA solution, followed by the CHIKV-nsP3 (10 μg mL−1) sample solution and AuNP-CHIKV-nsP3Ab solution for 2 h and 1.5 h, respectively. No considerable change in the sensor absorbance response was observed during incubation in BSA and analyte solutions. A significant increase in the response was observed as soon as the CHIKV-nsP3 bound probes were exposed to AuNP-CHIKV-nsP3Ab due to the rapid formation of the sandwich immunocomplex with AuNP labels on the probe surface. Absorbance values as high as 0.62 ± 0.03 (a.u.) were obtained. In a control experiment, where the capture antibody functionalized U-probes were directly exposed to AuNP-CHIKV-nsP3Ab without incubating in the CHIKV-nsP3 sample solution, a peak absorbance of ∼0.113 ± 0.004 was observed. This indicates a considerable non-specific adsorption on 18% of the antigen-binding sites, similar to that observed in Fig. 3d. These results corroborate the results from an earlier reported study.37 The SEM image of the probe, shown in Fig. 4b, confirms the presence of AuNPs on the probe surface.Subsequently, sensor responses for various analyte concentrations ranging from 0.1 to 10![[thin space (1/6-em)]](https://www.rsc.org/images/entities/char_2009.gif) 000 ng mL−1 were obtained, as shown in Fig. 5a. The absorbance values obtained for 0.1 ng mL−1 were almost close to that of the control, i.e., without the analyte. Fig. 5b shows the dose–response curve for CHIKV-nsP3 concentrations between 1 ng mL−1 and 104 ng mL−1. The horizontal red line in Fig. 5b corresponds to the mean of the blank sample response ± three times the standard deviation. The absorbance response was linear over the complete range of the analyte concentrations investigated in this study. In this range, the relationship between the sensor absorbance response (A530 nm) and CHIKV-nsP3 concentration (CnsP3) was obtained as ΔA530 nm = 0.1043
000 ng mL−1 were obtained, as shown in Fig. 5a. The absorbance values obtained for 0.1 ng mL−1 were almost close to that of the control, i.e., without the analyte. Fig. 5b shows the dose–response curve for CHIKV-nsP3 concentrations between 1 ng mL−1 and 104 ng mL−1. The horizontal red line in Fig. 5b corresponds to the mean of the blank sample response ± three times the standard deviation. The absorbance response was linear over the complete range of the analyte concentrations investigated in this study. In this range, the relationship between the sensor absorbance response (A530 nm) and CHIKV-nsP3 concentration (CnsP3) was obtained as ΔA530 nm = 0.1043![[thin space (1/6-em)]](https://www.rsc.org/images/entities/char_2009.gif) log10(Cnsp3) + 0.155; R2 = 0.98, where CnsP3 is in ng mL−1. The LOD, calculated as the sum of the mean value of the blank signal and thrice the standard deviation,47 was found to be 0.52 ng mL−1. On the other hand, the smallest concentration that can be practically quantified, denoted by the limit of quantification (LOQ), is defined as the sum of the blank signal and ten times the standard deviation.47 The LOQ was found to be 0.96 ng mL−1, which is close to the experimentally observed concentration of the sample, which yielded a signal that is clearly distinguishable from the blank signal, viz. 1 ng mL−1.
log10(Cnsp3) + 0.155; R2 = 0.98, where CnsP3 is in ng mL−1. The LOD, calculated as the sum of the mean value of the blank signal and thrice the standard deviation,47 was found to be 0.52 ng mL−1. On the other hand, the smallest concentration that can be practically quantified, denoted by the limit of quantification (LOQ), is defined as the sum of the blank signal and ten times the standard deviation.47 The LOQ was found to be 0.96 ng mL−1, which is close to the experimentally observed concentration of the sample, which yielded a signal that is clearly distinguishable from the blank signal, viz. 1 ng mL−1.
Specificity of the immunobiosensor
The specificity of the developed immunobiosensor was evaluated by comparing the absorbance changes for 10 μg mL−1 CHIKV-nsP3 with those of other bio-analytes at the same concentration, and the results are presented in Fig. 6. The absorbance change for 10 μg mL−1 of CHIKV-nsP3 was 0.62 ± 0.03, whereas the blank sample, HIgG, Pf-HRP2 and DENV yielded absorbance responses of 0.113 ± 0.004, 0.1 ± 0.06, 0.12 ± 0.02 and 0.12 ± 0.014, respectively. These results indicate that the proposed sensor demonstrates appreciable specificity towards CHIKV-nsP3.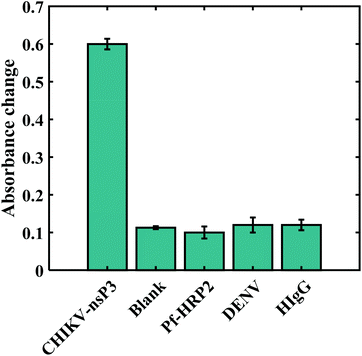 | ||
| Fig. 6 Absorbance response for 10 μg mL−1 CHIKV-nsP3 compared to those of the blank and other bioanalytes:10 μg mL−1 of Pf-HRP2, DENV, and HIgG. | ||
One of the best validations is the utility of any technique in detecting a specific analyte in patient samples. In real patient sera, interference from other molecules can cause problems, and further modifications to the protocol may be necessary to achieve specific detection of nsP3 with a LOD of 1 ng mL−1. In the case of arboviral infections such as chikungunya, the viral titers can reach as high as 109 genome copies per mL in the infected blood.48 In the case of dengue, studies have shown that the LOD could be as low as 0.07 μg mL−1 of NS1 proteins in infected patient sera.49 In the case of chikungunya, the presence of a massive amount of viral proteins, including those of CHIKV-nsP3 in the patient sera, supports the use of this protein for diagnosis purposes.50 In the present study, the POF based biosensor exhibited an LOD of ∼1 ng mL−1 of nsP3, whereas traditional techniques such as western blot and ELISA have LOD values of 10 and 1 ng mL−1 of nsP3, respectively,13 making the sensitivity of the POF based biosensor comparable to that of ELISA.13
The LOD obtained with the labeled technique for the optical biosensor (0.52 ng mL−1) is much lower compared to that of the label-free detection of the same biomarker using an impedance biosensor (8 ng mL−1) and a quartz crystal microbalance (500 ng mL−1).13 The enhancement of the optical signal by the AuNP-CHIKVnsP3Ab labels results in a lower LOD compared to the label-free detection techniques. Apart from that, optical-based sensing is known to be electrically passive compared to the other two biosensing techniques21,51 and thus appears to be the most promising among the three.
Conclusions
As the conventionally available methods for the detection of chikungunya are laboratory based and time consuming, an EWA based U-bent POF was proposed for the detection of one of its viral proteins, CHIKV-nsP3. A sandwich immunoassay with 40 nm AuNPs as labels was performed using an immunobiosensor with CHIKV-nsP3 as the detection analyte. A significant change in the absorbance response for analyte-bound probes was observed in comparison with the control, and SEM confirmed the binding of the labeled secondary antibody to the probe. We evaluated the relevant sensor parameters of the immunobiosensor: the LOD was 0.52 ng mL−1, and the sensitivity was 0.1043 A530 nm/log(CnsP3). The developed immunosensor also showed appreciable specificity. The results demonstrate the potential of EWA based U-bent POFs as an excellent alternative to both conventional diagnostic methods and label-free biosensors, for the early detection of the chikungunya viral disease.In this proof-of-the-concept study, the CHIKV-nsP3 analyte was His-tagged mainly to aid in the purification of the protein, and it was absent in the real serum samples. Hence, the sandwich assay may involve polyclonal antibodies against CHIKV-nsP3 as capture antibody instead of anti-polyhistidine antibodies utilized to illustrate these feasibility studies. Given the design of the plasmonic fiber optic sandwich immunosensor demonstrated here, a monoclonal antibody against CHIKV-nsP3 may be utilized to conjugate AuNPs for highly specific detection of chikungunya infection.
Conflicts of interest
The authors declare no conflict of interest.Acknowledgements
Financial support provided by the Department of Biotechnology, Ministry of Science and Technology (DBT), India in the project BT/PR11837/MED/32/347/2014, is gratefully acknowledged.References
- S. Vigneshvar, C. C. Sudhakumari, B. Senthilkumaran and H. Prakash, Front. Bioeng. Biotechnol., 2016, 4, 11 CrossRef CAS.
- M. S. Cheng and C. S. Toh, Analyst, 2013, 138, 6219–6229 RSC.
- A. P. Turner, Chem. Soc. Rev., 2013, 42, 3184–3196 RSC.
- G. Zanchetta, R. Lanfranco, F. Giavazzi, T. Bellini and M. Buscaglia, Nanophotonics, 2017, 6, 627–645 CAS.
- B. Pejcic, R. De Marco and G. Parkinson, Analyst, 2006, 131, 1079–1090 RSC.
- A. Syahir, K. Usui, K. Y. Tomizaki, K. Kajikawa and H. Mihara, Microarrays, 2015, 4, 228–244 CrossRef CAS.
- M. L. Sin, K. E. Mach, P. K. Wong and J. C. Liao, Expert Rev. Mol. Diagn., 2014, 14, 225–244 CrossRef CAS.
- L. Baril, Handbook of Biosensors and Biochips, 2008 Search PubMed.
- J. Jain, K. Nayak, N. Tanwar, R. Gaind, B. Gupta, J. S. Shastri, R. K. Bhatnagar, M. K. Kaja, A. Chandele and S. Sunil, Clin. Infect. Dis., 2017, 65, 133–140 CrossRef CAS.
- N. Kaur, J. Jain, A. Kumar, M. Narang, M. K. Zakaria, A. Marcello, D. Kumar, R. Gaind and S. Sunil, New Microbes New Infect., 2017, 20, 39–42 CrossRef CAS.
- V. Londhey, S. Agrawal, N. Vaidya, S. Kini, J. Shastri and S. Sunil, J. Assoc. Physicians India, 2016, 64, 36–40 Search PubMed.
- J. Jain, T. Okabayashi, N. Kaur, E. Nakayama, T. Shioda, R. Gaind, T. Kurosu and S. Sunil, Virol. J., 2018, 15, 84 CrossRef.
- A. George, M. S. Amrutha, P. Srivastava, V. V. R. Sai, S. Sunil and R. Srinivasan, J. Electrochem. Soc., 2019, 166, B1356–B1363 CrossRef CAS.
- T. Okabayashi, T. Sasaki, P. Masrinoul, N. Chantawat, S. Yoksan, N. Nitatpattana, S. Chusri, R. E. M. Vargas, M. Grandadam and P. T. Brey, J. Clin. Microbiol., 2015, 53, 382–388 CrossRef CAS.
- A. Singh, A. Kumar, R. Yadav, V. N. Uversky and R. Giri, Sci. Rep., 2018, 8, 5822 CrossRef.
- M. E. Álvarez-Argüelles, S. R. Alba, M. R. Pérez, J. A. B. Riveiro and S. M. García, in Current Topics in Neglected Tropical Diseases, IntechOpen, 2019 Search PubMed.
- C. Singhal, A. Dubey, A. Mathur, C. S. Pundir and J. Narang, Process Biochem., 2018, 74, 35–42 CrossRef CAS.
- C. Singhal, M. Khanuja, N. Chaudhary, C. S. Pundir and J. Narang, Sci. Rep., 2018, 8, 7734 CrossRef.
- C. Chen and J. Wang, Analyst, 2020, 145, 1605–1628 RSC.
- E. Benito-Pena, M. G. Valdes, B. Glahn-Martinez and M. C. Moreno-Bondi, Anal. Chim. Acta, 2016, 943, 17–40 CrossRef CAS.
- G. Liang, Z. Luo, K. Liu, Y. Wang, J. Dai and Y. Duan, Crit. Rev. Anal. Chem., 2016, 46, 213–223 CrossRef CAS.
- H. Usman, M. H. Abu Bakar, A. S. Hamzah and A. b. Salleh, Sens. Rev., 2016, 36, 40–47 CrossRef.
- M. E. Bosch, A. J. R. Sanchez, F. S. Rojas and C. B. Ojeda, Sensors, 2007, 7, 797–859 CrossRef CAS.
- M. Divagar, A. Gowri, S. John and V. V. R. Sai, Sens. Actuators, B, 2018, 262, 1006–1012 CrossRef CAS.
- N. Cennamo, S. Di Giovanni, A. Varriale, M. Staiano, F. Di Pietrantonio, A. Notargiacomo, L. Zeni and S. D'Auria, PLoS One, 2015, 10, e0116770 CrossRef.
- A. Gowri and V. V. R. Sai, Sens. Actuators, B, 2016, 230, 536–543 CrossRef CAS.
- N. Cennamo and L. Zeni, Macromol. Symp., 2020, 389, 1900074 CrossRef CAS.
- D. Marazuela and M. C. Moreno-Bondi, Anal. Bioanal. Chem., 2002, 372, 664–682 CrossRef.
- R. Bharadwaj, V. V. Sai, K. Thakare, A. Dhawangale, T. Kundu, S. Titus, P. K. Verma and S. Mukherji, Biosens. Bioelectron., 2011, 26, 3367–3370 CrossRef CAS.
- V. V. Sai, T. Kundu and S. Mukherji, Biosens. Bioelectron., 2009, 24, 2804–2809 CrossRef CAS.
- G. Wandermur, D. Rodrigues, R. Allil, V. Queiroz, R. Peixoto, M. Werneck and M. Miguel, Biosens. Bioelectron., 2014, 54, 661–666 CrossRef CAS.
- G. Liang, Z. Zhao, Y. Wei, K. Liu, W. Hou and Y. Duan, RSC Adv., 2015, 5, 23990–23998 RSC.
- A. Leung, P. M. Shankar and R. Mutharasan, Sens. Actuators, B, 2007, 125, 688–703 CrossRef CAS.
- T. Gessei, T. Arakawa, H. Kudo and K. Mitsubayashi, Analyst, 2015, 140, 6335–6342 RSC.
- Z. Huang, X. Lei, Y. Liu, Z. Wang, X. Wang, Z. Wang, Q. Mao and G. Meng, ACS Appl. Mater. Interfaces, 2015, 7, 17247–17254 CrossRef CAS.
- Y. Liu, Z. Huang, F. Zhou, X. Lei, B. Yao, G. Meng and Q. Mao, Nanoscale, 2016, 8, 10607–10614 RSC.
- B. Ramakrishna and V. V. R. Sai, Sens. Actuators, B, 2016, 226, 184–190 CrossRef CAS.
- M. Gandhi, S. Chu, K. Senthilnathan, P. Babu, K. Nakkeeran and Q. Li, Appl. Sci., 2019, 9, 949 CrossRef CAS.
- C. Nietzold and F. Lisdat, Analyst, 2012, 137, 2821–2826 RSC.
- R. N. Lopes, D. M. C. Rodrigues, R. C. S. B. Allil and M. M. Werneck, Measurement, 2018, 125, 377–385 CrossRef.
- M. Divagar and V. V. R. Sai, IEEE Sens. Conf. Proc., 2018, 1–4 Search PubMed.
- J. Turkevich, P. C. Stevenson and J. Hillier, Discuss. Faraday Soc., 1951, 11, 55 RSC.
- C. G. Danny, M. D. Raj and V. V. R. Sai, J. Lightwave Technol., 2020, 38, 1580–1588 CAS.
- B. Saha, T. H. Evers and M. W. Prins, Anal. Chem., 2014, 86, 8158–8166 CrossRef CAS.
- K. Tripathi and J. D. Driskell, ACS Omega, 2018, 3, 8253–8259 CrossRef CAS.
- R. T. Busch, F. Karim, J. Weis, Y. Sun, C. Zhao and E. S. Vasquez, ACS Omega, 2019, 4, 15269–15279 CrossRef CAS.
- J. Mocak, A. M. Bond, S. Mitchell and G. Scollary, Pure Appl. Chem., 1997, 69, 297–328 CAS.
- S. C. Weaver and M. Lecuit, N. Engl. J. Med., 2015, 372, 1231–1239 CrossRef CAS.
- P. R. Young, P. A. Hilditch, C. Bletchly and W. Halloran, J. Clin. Microbiol., 2000, 38, 1053–1057 CrossRef CAS.
- Y. W. Kam, F. M. Lum, T. H. Teo, W. W. Lee, D. Simarmata, S. Harjanto, C. L. Chua, Y. F. Chan, J. K. Wee, A. Chow, R. T. Lin, Y. S. Leo, R. Le Grand, I. C. Sam, J. C. Tong, P. Roques, K. H. Wiesmuller, L. Renia, O. Rotzschke and L. F. Ng, EMBO Mol. Med., 2012, 4, 330–343 CrossRef CAS.
- R. Verma and B. D. Gupta, Analyst, 2013, 138, 7254–7263 RSC.
| This journal is © The Royal Society of Chemistry 2021 |

