Implantable HDAC-inhibiting chemotherapeutics derived from hydrophobic amino acids for localized anticancer therapy†
Somnath Dharmaraj
Bhagat‡
a,
Abhishek
Chanchal‡
a,
Mansi
Gujrati
b,
Aditi
Banerjee
a,
Ram Kumar
Mishra
*b and
Aasheesh
Srivastava
 *a
*a
aDepartment of Chemistry, Indian Institute of Science Education and Research Bhopal, Bhopal Bypass Road, Bhopal, Madhya Pradesh 462066, India. E-mail: asrivastava@iiserb.ac.in
bDepartment of Biological Sciences, Indian Institute of Science Education and Research Bhopal, Bhopal Bypass Road, Bhopal, Madhya Pradesh 462066, India. E-mail: rkmishra@iiserb.ac.in
First published on 30th October 2020
Abstract
Epigenetic targeting of different cancers by inhibiting particular histone deacetylase (HDAC) isozymes is a promising treatment approach against cancer. Development of locally-implantable molecular inhibitors of HDAC (henceforth called HDACi) promises high tumour site concentration and reduced systemic degradation of the HDACi. Herein, we report the design of such implantable HDACi based on amphiphilic derivatives of hydrophobic amino acids endowed with a hydroxamic acid (hxa)-based zinc-binding residue. The amino acids present in HDACi influenced the HDAC isozyme that could be inhibited most effectively; the L-phenylalanine derivative 4e inhibited the HDAC6 isozyme most potently (IC50 ∼ 88 nM), while the L-isoleucine derivative 4h was most effective against the isozyme HDAC2 (IC50 ∼ 94 nM). We also noticed that the L-Phe derivative 4e was up to 5× more potent towards inhibiting HDAC6 than its optical antipode 4f derived from D-Phe. This was rationalized in terms of the varying extent of penetration of the enantiomeric inhibitors inside the catalytic tunnel of the enzyme. Since the isozymes HDAC6 and HDAC2 are overexpressed in different cancer cells, 4e and 4h elicited selective anticancer activity in different cancer cell lines. Additive therapeutic action of the combination therapy of 4e and 4h was observed on lung cancer cells that overexpress both these isozymes. Further, 4e formed implantable self-assembled hydrogels that achieved sustained and selective killing of cancer cells in the vicinity of implantation.
1. Introduction
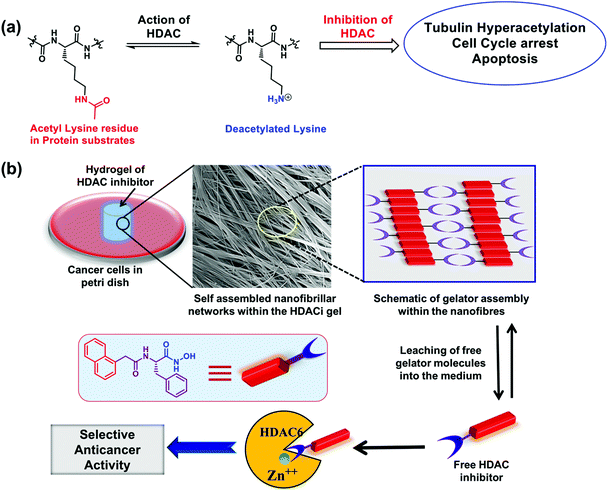
Epigenetic changes in cellular functioning are known to occur during the onset and progression of many cancers.1 These changes are executed through altered expression of particular isozymes of histone acetyl transferases (HATs) and histone deacetylases (HDACs). HDACs are a group of eighteen structurally diverse enzymes that catalyse the hydrolysis of acetyl groups from the N-acetyl-lysine residues present in a wide variety of histone and non-histone proteins during post-translational protein alteration (Fig. 1a).2 Aberrant expression of specific isozymes of HDACs is a well-documented early critical event in the progression of certain cancers.3 For example, the isozyme HDAC6, found in the nucleus and cytosol, is over-expressed in malignancies of the prostate,4 breast, lung and liver.1,5 Similarly, isozyme HDAC2 is overexpressed in gastric cancer6 and lung carcinoma.7 Inhibition of these particular isozymes is therefore clinically relevant not only for the control and treatment of multiple types of cancer, but also for tackling other health conditions such as inflammation, HIV, neurodegenerative diseases, and many more.8,9 There is also growing evidence that small molecule inhibitors of HDACs (subsequently abbreviated as HDACi) can also potentiate the immunotherapy of cancer. Consequently, a wide variety of HDACi are actively being explored, with more than 490 clinical trials conducted in the last few years.2 Currently, four HDACi, viz. vorinostat (or SAHA, for cutaneous T-cell lymphoma (CTCL)), romidepsin (for CTCL and peripheral T-cell lymphoma (PTCL)), belinostat (for relapsed or refractory PTCL), and panobinostat (for multiple myeloma), are already approved for clinical usage. However, their non-selective action on the different HDAC isozymes leads to poor discrimination between cancer and non-cancer cells.10A predominant fraction of HDACi with promising anticancer abilities possess hydroxamic acid (hxa) residue as the zinc binding group (ZBG) that sequesters the Zn(II) ion present in the active site of many HDACs.11,12 However, glucuronidation or hydrolysis of the hxa unit may result in the systemic inactivation of such HDACi.13 This unfavourable transformation is often overcome by designing pro-inhibitors that release active HDACi in the vicinity of a tumour by exploiting the unique biochemical characteristics of the tumour microenvironment, such as altered local pH,14–16 increased ROS levels and enhanced levels of lipases and esterases.17–19 Another key challenge in HDACi-based cancer therapy is the pan-HDAC inhibiting nature of many achiral HDACi, such as SAHA and trichostatin A (TSA), that potently (but indiscriminately) inhibit all the HDAC isozymes, including those involved in the normal functioning of healthy cells.20 Consequently, these HDACi may cause unintended clinical consequences. These aspects require careful consideration when designing the next generation of HDACi.21
Based on the above understanding, we envisaged preparing novel HDACi molecules endowed with isozyme selectivity and implantability in order to achieve improved discrimination of cancer cells over normal cells, reduce the chances of systemic degradation and afford a high local concentration of the HDACi at the tumor site, resulting in improved translational potential of the HDACi. We employed hydrophobic amino acids in the design of these HDACi in order to utilize the chirality of the amino acids to modulate the potency of HDAC inhibition. Our screening yielded two novel HDACi molecules: the L-phenylalanine derivative 4e and the L-isoleucine derivative 4h that achieved 50% inhibition of isozymes HDAC6 and HDAC2, respectively, at concentrations <100 nM. These molecules also exhibited potent anticancer activity at the cellular level, both in two-dimensional cell cultures and in the three-dimensional multi-cell tumor spheroid (MCTS) models. Compound 4e also produced an implantable supramolecular hydrogel that could kill cancer cells in its vicinity by regulating the epigenetic pathways of the cells (Fig. 1b).
2. Results and discussion
2.1 Design of the HDACi hydrogelators
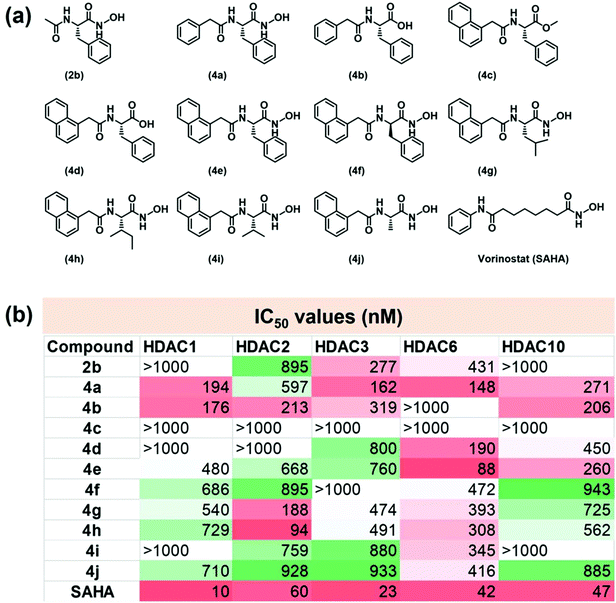
Many anti-neoplastic HDACi share a common pharmacophore architecture consisting of an alkyl chain flanked by an aromatic cap on one end and a ZBG on the other. The aromatic cap enhances the recognition of a specific isozyme of HDAC and engages in favourable interactions with the hydrophobic residues present in the catalytic tunnel of the enzyme, while the linker allows the ZBG to closely approach the metal center.22 We hypothesized that incorporating amino acids in the design of HDACi would offer additional chirality control on their interaction with the HDACs, while the ZBG is comprised of a carboxylic acid or the hxa residue of the amino acid fragment. We appended benzyl (Bz) or naphthyl (Nap) units at the N-terminal of the amino acid to act as the aromatic caps of these HDACi. The structures of the molecules thus designed are presented in Fig. 2a. These compounds were prepared in good to moderate yields by reported procedures (Fig. S1†).23–25 We were conscious that such amphiphilic amino acid derivatives may also have a strong self-assembling propensity.20 Hence, we wished to exploit these common structural features to impart both HDACi and hydrogelation abilities to these molecules, with the aim of exploring avenues for localized epigenetic therapy against cancer.2.2. Screening for in vitro HDAC inhibition activity
Subsequent to their purification and chemical characterization, these amino acid derivatives were screened for HDACi activity using a commercial kit that assays the HDAC inhibition through changes in fluorescence intensity in the reaction vial. In our screening, the achiral FDA-approved HDACi drug vorinostat, or SAHA, was employed as a positive control. It exhibited its well-known pan-inhibitor activity against all the isozymes of HDAC.26–28 The results of this screening are summarized in Fig. 2b and Fig. S3, ESI.† Certain structure–activity correlations were discernible from this screening. First, the simplest derivative, 2b, exhibited poor HDAC inhibition ability, even if it had some isozyme selectivity. The potency of HDAC inhibition was increased by employing the Bz unit in 4a, although this molecule exhibited poor isozyme selectivity. Replacing the hxa unit of 4a with a carboxylic acid in 4b had a mixed influence on the HDACi profile. It reduced the potency towards isozymes HDAC3 and HDAC6 but retained the effectiveness against isozymes 1, 2 and 10. However, esterification of the carboxylic acid residue in 4c completely abolished the HDACi capabilities, presumably due to its reduced Zn binding.Increasing the aromatic bulk by replacing the Bz-residue in 4b with the Nap-residue in 4d improved the isozyme selectivity significantly; 4d was most effective against HDAC6 only, albeit with modest potency. This may be attributed to the influence of greater steric requirements for the Nap residue in approaching the active site of the enzyme and to the stronger aromatic interactions with amino acid side-chains found within the catalytic tunnel of HDAC. Converting the carboxylic acid residue in 4d to an hxa residue in 4e improved the HDACi potency while retaining the isozyme selectivity to a certain extent. Hence, based on their positive influence on the HDACi profile of these molecules, the Nap and hxa residues were retained in the subsequently screened derivatives and only the amino acid unit was varied in these molecules. While D-Phe was used in 4f, L-Leu was employed in 4g, L-Ile in 4h, L-Val in 4i, and L-Ala in 4j. Analysis of the HDAC inhibition profiles of these molecules showed that considerably more potent HDAC inhibition was observed when the linker amino acid contained an aromatic side chain (e.g. the Phe-derivative 4e) or large aliphatic side chain (e.g. the Leu- and Ile-derivatives, 4g and 4h, respectively) than for the derivatives of Val (4i) or Ala (4j) which have much shorter aliphatic side chains in the amino acid residue. On the basis of these observations, we propose that a linker amino acid with an aromatic or large aliphatic side chain enjoys stronger interactions with the amino acid residues present in the enzyme, thus affording potent HDACi performance of the derivatives containing them. Our in vitro screening provided two lead molecules, viz. 4e and 4h, that elicited highly potent HDACi performance against isozyme HDAC6 (IC50 = 88 nM) and isozyme HDAC2 (IC50 = 94 nM), respectively (Fig. S3a and b†), where IC50 is the concentration of HDACi that results in 50% inhibition of enzyme activity.
2.3 Influence of chirality of amino acid on HDAC inhibition activity
Since the L-Phe derivative 4e turned out to be a promising HDACi lead against the isozyme HDAC6, we explored the influence of the chirality at the amino acid linker on the potency of HDAC6 inhibition by this compound. We noticed markedly different HDACi performances from 4e and its optical antipode 4f (prepared from D-Phe), with 4e being ca. 5× more potent in inhibiting HDAC6 than 4f. To obtain insights into the possible interactions that result in this difference, we undertook computational docking studies for these compounds on the zinc binding groove of HDAC6 homology protein (PDB ID 1ZZ1) or human HDAC6 (PDB ID 5EDU). Docking studies indicated that 4e adopted a distinct orientation in the zinc binding groove where its Nap residue becomes proximal to the Phe-208 of the protein (Fig. 3a and Fig. S4†). The inhibitors are shown as a green stick model while the catalytic pocket of the protein is shown as grey ribbon. The zinc ion present at the active site is shown in purple. Additional interactions between the phenyl ring of 4e and the Phe-152 of the protein were also indicated. In contrast, in the case of 4f, the phenyl side-chain of the D-Phe residue was spatially proximal to Phe-208 (Fig. 3b) while its Nap residue interacts weakly with a hydrophobic residue of the protein. The calculated distances between the –CO and –OH residues of 4e and the Zn(II) of the protein were 1.6 Å and 3.3 Å, respectively, while those for 4f were significantly longer at 4.15 Å and 5.2 Å, respectively (Fig. 3b). Thus, the computational studies indicated that 4e had much stronger interaction with the zinc binding groove of the HDAC protein compared to 4f. Moreover, dissimilar penetration of these enantiomeric molecules in the Zn-containing cavity of the protein occurs;28,294e had a closer position to the metal ion present in the protein than 4f and, hence, elicited more potent activity.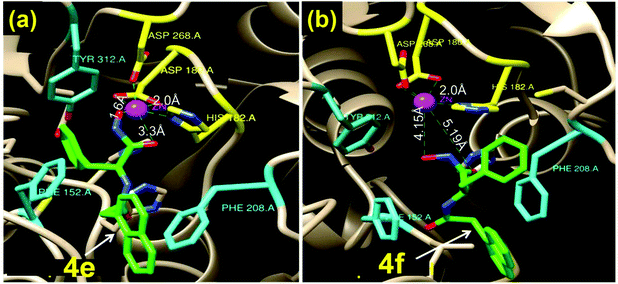 | ||
| Fig. 3 Docking study into the interactions of the enantiomeric Phe-derivatives 4e and 4f within the catalytic pocket of HDAC6 (PDB 1zz1). The inhibitor is shown in a green stick model while the protein is shown as a grey ribbon. (a) Compound 4e is incorporated snugly into the active site of the protein (shortest distance between Zn(II) and 4e = 1.6 Å); (b) 4f remains much farther from Zn(II) (shortest distance between Zn(II) and 4f = 4.15 Å). | ||
2.4 Anticancer potential of 4e
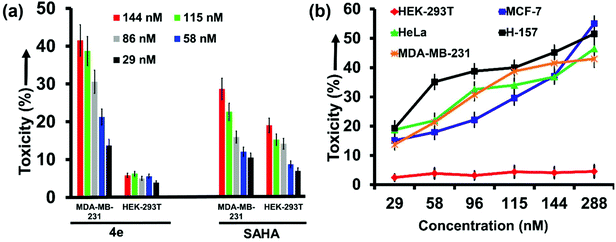
The kit-based assay revealed that 4e and 4h act most potently on the HDAC isozymes 6 and 2, respectively. Further substantiation of their therapeutic ability at cell level was therefore explored (Fig. 4). SAHA was the positive control in this study as well. The cell lines were procured from commercial sources as detailed in the ESI.† Cytotoxicity evaluation by MTT assay revealed that 4e elicited strong and selective toxicity in MDA-MB-231 cells (breast cancer cell line), while the HEK-293T cells (non-cancerous immortal cell line) remained largely unscathed by exposure to 4e. For example, at 115 nM concentration of 4e, 41% mortality was seen in MDA-MB-231 cells with only 5% in HEK-293T cells (Fig. 4a). We attribute this to the selective HDACi activity of 4e. In contrast, SAHA exhibited poor selectivity for cancer cells over non-cancer cells due to its pan-inhibitory nature.We expanded our investigations on the anticancer activity of 4e by including other cancer cell lines such as MCF-7 (breast) and H-157 (oral) that overexpress HDAC6.37,38 Exposure to even nanomolar concentrations of 4e caused significant mortality in all these cell lines. The concentration of 4e that causes 50% of the cells to die (CC50 value) was <300 nM for MCF-7 and H-157 cells (Fig. 4b). Thus, the observed CC50 of 4e was ca. 4× its kit-based IC50 value. Contrastingly, SAHA is known to have CC50 values ranging from 0.5–10 mM depending upon the tumor cell line treated.39
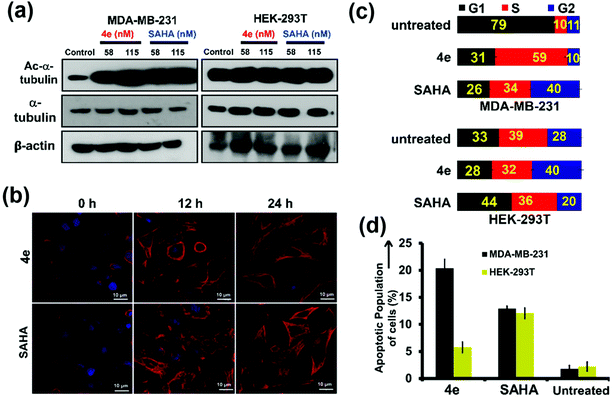
The mechanism of action of 4e on cancer cells was explored in detail. Tubulin is amongst the known non-histone proteins that is targeted by cytosolic HDAC6.40 Inhibition of HDAC6 enhances the acetylation levels of tubulin.41 The downstream effects of this include altered assembly of microtubules (polymerized tubulin), decreased cell motility, and induction of apoptosis.29,42 Hence, the effect of 4e pre-treatment on α-tubulin acetylation levels as well as on the architecture of microtubules was studied by western blot and confocal laser scanning microscopy (CLSM). Exposure of MDA-MB-231 cells to either 4e or SAHA (positive control) for 24 h resulted in enhancement in the extent of α-tubulin acetylation (Fig. 5a, left panel, first row, compare lane 1 with lanes 2 and 3). However, the total levels of α-tubulin in the cells remained unaffected (Fig. 5a, left panel, second row). A similar pre-treatment of HEK-293T cells with these compounds did not elicit any notable change in the extent of α-tubulin acetylation in the western blot (Fig. 5a, right panel, first row, compare lane 1 with lanes 4 and 5). The architecture of acetylated microtubules in MDA-MB-231 cells upon treatment with a sub-lethal dose (58 nM) of 4e or SAHA was assessed at different time points using CLSM (Fig. 5b). At the beginning of the treatment (0 h), acetylated α-tubulin was mostly incorporated into scattered microtubule segments. Cells treated for 12 h and 24 h with 4e or SAHA showed a conspicuous increase in the content of acetylated α-tubulin that was still being incorporated in microtubule segments. Consistent with the observations from western blot, the total α-tubulin levels and their distribution were indistinguishable between the treated samples and the untreated controls in CLSM (Fig. S5†).
Inhibition of HDAC also causes cell-cycle arrest, leading to apoptosis.43,44 Such cell-cycle arrest by HDACi occurs due to transcriptional alterations in the genes involved in regulating the cell cycle.44 We employed flow cytometry analysis to assess if there is any change in the distribution of cells in different stages of the cell cycle upon treatment of cells with 4e. This study revealed that treatment with 115 nM 4e for 24 h resulted in a significant (i.e. ∼6×) increase in the fraction of cells present in the S-phase (59% for treated cells vs. 10% for control cells). In parallel, the fraction of cells in the G1 phase diminished considerably (from 79% in control to 29% upon 4e-treatment, Fig. 5c and Fig. S6†). This data indicates that treatment of cancerous cells with 4e arrested them in the S-phase of the cell-cycle. On the other hand, the noncancerous HEK-293T cells demonstrated very similar cell-cycle distribution profiles for the untreated and 4e-treated cells. Under these conditions, the pan-inhibitor SAHA caused the G2/M arrest of MDA-MB-231 cells.45,46
Thus, 4e selectively induced S-phase cell-cycle arrest in the breast cancer cells. The consequent increase in apoptosis in the MDA-MB-231 cells upon 4e treatment was also confirmed by flow cytometry using annexin-V as an apoptotic marker. Upon treatment with 115 nM 4e, ca. 20% of MDA-MB-231 cells exhibited apoptotic characteristics (Fig. 5d, black bars and Fig. S7†) compared to <5% in the untreated cells or treated HEK-293T cells (Fig. 5d, greenish-yellow bars and Fig. S7†). From these studies, we infer that the selective inhibition of HDAC6 by 4e causes enhancement in the extent of tubulin acetylation in breast cancer cells. Further, it arrests cells in the S-phase of the cell cycle and leads to apoptotic cell death. The non-cancer cells, on the other hand, are unaffected under this treatment.
2.5 Effect of 4e treatment on multicellular tumor spheroids (MCTS)
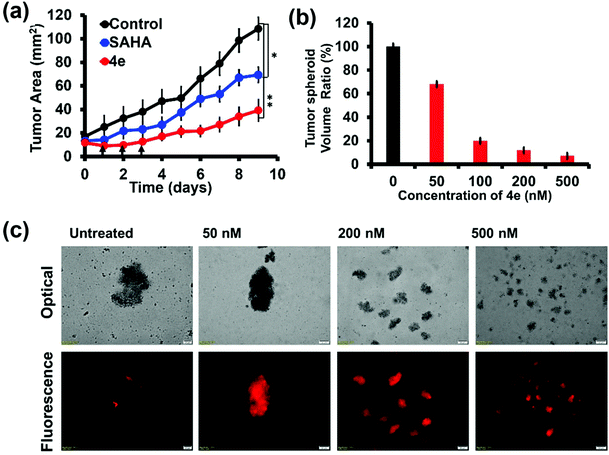
We also evaluated the efficacy of 4e on three-dimensional (3D) tumor spheroids formed from MCF-7 (breast cancer) cells. These ex vivo tumor spheroids are also called multicellular tumor spheroids (MCTS). They more closely imitate the cell–cell and cell–matrix interactions observed in in vivo tumors.48 Hence, MCTS have emerged as robust intermediate platforms to screen potential therapeutic molecules in cancer research in the last decade.49,50 Treatment of MCF-7 MCTS with 4e as well as SAHA (200 nM each) caused significant reduction in the tumour size (Fig. 6a). The initial triple dose treatment with 4e caused about 75% reduction in the spheroid area after 10 days. The effect of 4e treatment started with the first dose and was accentuated as additional doses were administered. Dose-dependent and time-dependent inhibition in the growth of MCF-7 MCTS upon treatment with 4e were also confirmed by microscopic examination (Fig. 6b and Fig. S8†). Propidium iodide uptake by MCTS cells treated with 4e confirmed the strong cytotoxic effects of 4e (Fig. 6c). Thus, 4e exhibited an overwhelmingly strengthened inhibitory effect by enhancing the cell death and reducing the growth of the tumour spheroids.2.6 Anticancer potential of 4h and combination therapy of 4h and 4e
The cytotoxicity profile of the Ile-derivative 4h was also evaluated in HEK-293T, HeLa and A549 cells (Fig. 7a). We found that 4h elicited ∼18% cytotoxicity at 288 nM concentration in the non-cancerous cells, viz. HEK-293T, while the cytotoxicity towards HeLa and A549 cells was 39% and 58%, respectively. These numbers correlate well with the in vitro HDAC-inhibition profile of 4h. HeLa cells overexpress HDAC6 but not HDAC2 and are less affected by 4h, which targets the latter more effectively. A549 cells overexpress both these HDAC isozymes and hence are affected more significantly by 4h.29,47 We conceived that a combination therapy of 4e and 4h should elicit an even stronger response in A549 cells due to the inhibition of both HDAC6 (by 4e) and HDAC2 (by 4h). Indeed, this combination therapy achieved >90% cell death in A549 cells at a concentration of 288 nM each, while only 42% and 60% cytotoxicity were respectively achieved by 4e and 4h at this concentration when given individually (Fig. 7b). The effectiveness of this combination therapy on A549 cells is reflected in the reduction of the CC50 values to ∼100 nM (Fig. 7c). In contrast, the combination therapy was not so effective on HeLa cells that overexpress only HDAC6. The non-cancerous HEK-293T cells that do not overexpress any of these HDAC isozymes were least affected by 4e and 4h, individually or in combination. Thus, combination therapy of 4e and 4h significantly improves the efficacy and selectivity towards lung cancer cells exclusively.2.7 Hydrogelation by 4e
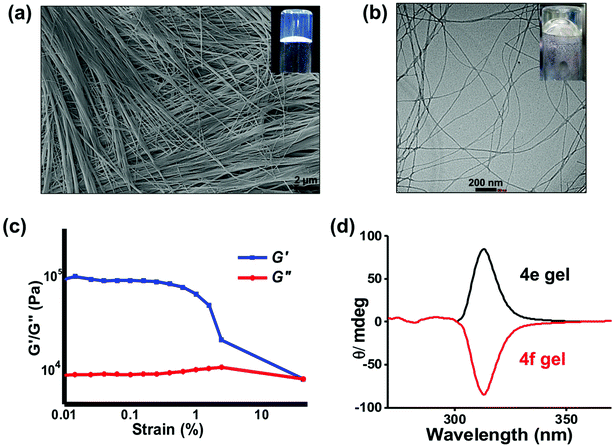
We have earlier reported the hydrogelation abilities of the carboxylic acid derivative 4d and other amino acid derivatives.23,25,30,31 Intermolecular H-bonding as well as π–π stacking interactions are implicated in the self-assembly of this class of gelators. Interestingly, we also recently found that the Au(III)-complex of 4d generates multiple reactive oxygen species (ROS) from water and shows cytotoxicity towards cancer cells.32 With this background, we next explored the hydrogelation ability of 4e. The hxa group in 4e has a pKa value of 6.4 (Fig. S9†), in agreement with the reported values for other molecules that contain the hxa unit.33–35 Employing higher concentrations (>0.8 mg mL−1 or >2.3 mM) of this compound indeed produced thermo-reversible, self-supporting hydrogels. The inset of Fig. 8 shows a digital image of the optically-clear hydrogel formed by 4e at its minimum gelation concentration (MGC) of 2.3 mM. The self-assemblies present in the hydrogels formed by 4e in water were characterized by electron microscopy. Dense, three-dimensional (3D) networks of nanofibers were observed in both SEM and TEM (Fig. 8a and b). Such fibrillar networks restrict the flow of water, leading to hydrogel formation. These gels were thermally stable up to 84 ± 2 °C at 4 mg ml−1 concentration of the gelator. To the best of our knowledge, 4e is the first example of a molecular hydrogelator possessing a hydroxamic acid residue. Unlike the other hydrogels employed for biomedical applications as mere passive scaffolds, the hydrogels formed by 4e can be expected to exhibit anticancer abilities due to the potent HDACi profile of 4e. Rheological studies at a constant oscillatory frequency of 1 Hz at room temperature (22 °C) were conducted on the formed hydrogels. Fig. 8c shows that the storage modulus (G′) of the sample is in the range of 105 Pa, whereas its loss modulus (G′′) is initially in the range of 104 Pa (Fig. S10†). This data confirms that a viscoelastic gel is formed by 4e and also indicates that the gel can flow easily when sheared. The gel exhibited weak frequency dependencies within the frequency range from 0.1 to 100 rad s−1 due to its high elasticity.The optical antipode of 4e, viz. 4f, also produced hydrogels. The optical clarity of the hydrogels formed by 4e and 4f allowed us to record the circular dichroism (CD) spectra of these hydrogels (Fig. 8d). Opposite ellipticity is discernible in their CD profiles, indicating opposite helicity of the self-assembled nanofibers produced by the two optical antipodes.36 Variable temperature CD studies on the hydrogel formed by 4e showed a gradual decrease in the ellipticity at 300 nm and 240 nm upon heating (Fig. S11†). This indicates the disassembly of the self-assembled helical nanofibers as the temperature is raised.
Due to the deprotonation of the hxa residue, the self-assembly of 4e was also pH-responsive. At pH = 9.0, 4e formed a clear, free-flowing solution since the hxa residue is completely ionized to the anionic hydroxamate form. When this solution was added to simulated body fluid (SBF) at pH 7.2, a gelatinous mass was produced instantaneously as a result of partial reversion of the hydroxamate to hxa (Fig. S12†). This obliterates the negative charge on the molecule and increases the H-bonding elements to promote self-assembly. We envisage that this pH-induced self-assembly of 4e can be exploited for localized delivery of 4e at the site of a tumor, as well as for combination therapy.
2.8 Localized anticancer therapy potential of hydrogels of 4e
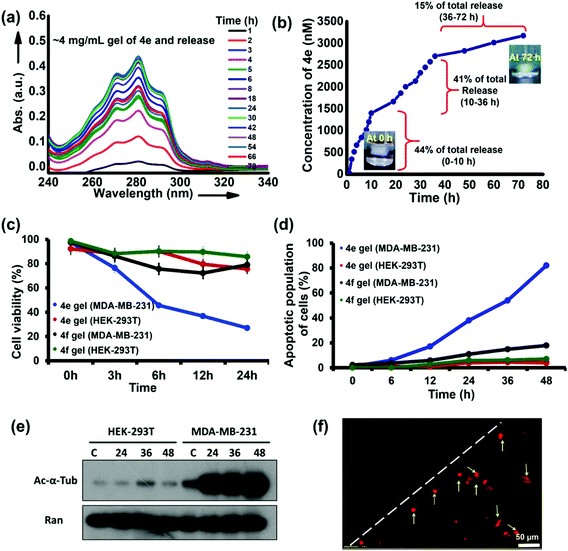
The potent HDACi abilities of 4e are retained at the cellular level and in MCTS, producing a significant reduction in the viability of cancer cells at nanomolar concentrations of this molecule. Moreover, 4e also produced hydrogels at higher (millimolar) concentrations. We hypothesized that the hydrogels of 4e could act as erodible reservoirs for gradual and sustained release of free 4e molecules to produce potent and selective killing of cancer cells in the vicinity of the hydrogels. Our premise was that a self-assembled hydrogel exists in a dynamic equilibrium with the dissolved (free) gelator molecules.51 Hence, sustained and continuous leaching/diffusion of the free 4e molecules from the hydrogel was predicted. This premise was confirmed by keeping a cylindrical piece of hydrogel (volume ∼500 mm3) of 4e in a simulated body fluid (SBF) reservoir. The sustained diffusion of free 4e molecules from the hydrogel into the SBF was evidenced through UV-vis spectroscopy of the SBF (Fig. 9a). A burst release of free gelator molecules followed by their slow and sustained release from the gel (Fig. 9b) was observed in these studies.Finally, we evaluated the local anticancer potential of the hydrogel form of 4e. Breast cancer cells (MDA-MB-231) grown in a Petri dish were exposed to 4e in its hydrogel form (4 mg mL−1 concentration, volume of the gel ∼125 mm3) for different durations. Preliminary assessment of the cytotoxicity in the vicinity of the gel was made by microscopic examination of propidium iodide (PI) uptake by the cells. We found a significant increase in the uptake of PI by the MDA-MB-231 cells adjoining the hydrogel. Under similar exposure conditions, even after 48 h of incubation, a negligible population of HEK-293T cells was found to take up PI (Fig. 9d). The apoptotic population of MDA-MB-231 cells in the vicinity of 4e hydrogel increased substantially with time. After 48 h, ca. 40% of the cell population exhibited characteristics of apoptosis (Fig. 9d and Fig. S13†). Under similar treatment of non-cancerous cells (HEK-293T), only about 6% of the population exhibited apoptotic characteristics (Fig. 9d and Fig. S14†). The hydrogels of 4f (the optical antipode of 4e) were much less effective and both HEK-293T and MDA-MB-231 cells in the vicinity of this hydrogel exhibited good viability.
The cellular-level changes in MDA-MB-231 cells that were in the proximity of 4e hydrogel were probed. As compared to the control treatment, time-dependent hyperacetylation of α-tubulin was observed in MDA-MB-231 cells. However, the levels of acetylated α-tubulin were initially low in HEK-293T cells and showed no perceptible change upon treatment with 4e (Fig. 9e). While the levels of acetylated α-tubulin seem saturated in treatment conditions in MDA-MB-231 cells, it is evident that significant increase is observed between the control (lane “c”) and 24 h treatment samples, which is not the case for HEK-293T cells (Fig. 9e), highlighting the selectivity of the action of 4e even when delivered in a self-assembled hydrogel form. The propidium iodide (PI) uptake by cells in the vicinity of the hydrogel was analyzed using fluorescent microscopy and flow cytometry. We found that there was a significant increase in the uptake of PI by MDA-MB-231 cells incubated with the 4e hydrogel (Fig. 9f and Fig. S15†). Again, under similar treatment, the PI-stained population for HEK-293T cells was very low, even at 48 h of incubation, with 4e (Fig. S16†). Thus, 4e selectively acted against cancer cells even when administered in the self-assembled hydrogel form, while the hydrogels of its optical antipode 4f were ineffective. In other words, the therapeutic potential of 4e is retained in its hydrogel form. This also provides an example of a therapeutic hydrogel effective against cancer cells while remaining relatively benign to non-cancerous cells. These results have important implications in localized anticancer therapy through epigenetic alterations achieved by selective inhibition of particular HDAC isozymes.
3. Conclusions
In conclusion, we demonstrate the design features that impart potent HDAC inhibition activity as well as hydrogelation abilities to short amino acid derivatives. The hydroxamic acid derivatives of L-Phe (4e) and L-Ile (4h) inhibited HDAC6 and HDAC2 with IC50 values of 88 nM and 94 nM, respectively. As a result, 4e achieved selective targeting of oral and breast cancer cells in which HDAC6 is overexpressed. The optical antipode of 4e, viz. 4f, had inferior potency to inhibit HDAC6 and hence exhibited lower toxicity towards cancer cells. Hyperacetylation of α-tubulin, cell-cycle arrest in the S-phase and increased apoptosis were induced by 4e in breast cancer cells. The compound was also effective against cervical and mouth cancer cell lines that overexpress HDAC6. It achieved up to 70% reduction in the volume of 3D tumor spheroids of MCF-7 at just 200 nM concentration while the non-cancer cells were minimally affected by 4e. The L-Ile derivative 4h showed an additive action with 4e on lung cancer cells, with 50% of the cells killed at 100 nM concentration. The therapeutic potential of 4e is retained even in its hydrogel form, while the hydrogels of its antipode 4f were ineffective. The breast cancer cells in the vicinity of the 4e hydrogels exhibited apoptotic characteristics due to the leaching of free 4e from the gel. Thus, in this work, we have shown a unique opportunity to undertake localized anti-cancer therapy through the design of novel self-assembling HDAC inhibitors derived from amino acids.Abbreviations
| HDACi | Molecular inhibitors of histone deacetylase |
| μM | Micromolar |
| nM | Nanomolar |
| μg | Microgram |
| TLC | Thin layer chromatography |
| IC50 | Half-maximal inhibitory concentration |
| CC50 | Half-maximal cytotoxicity concentration |
| PBS | Phosphate buffered saline |
| DMSO | Dimethyl sulphoxide |
| Xe | Xenon |
| MCTS | Multicellular tumor spheroids |
| PI | Propidium iodide |
Funding sources
This work was financially supported by the Science and Engineering Research Board of India through project no. EMR/2016/006545.Conflicts of interest
There are no conflicts to declare.Acknowledgements
Somnath D. Bhagat and Mansi Gujrati thank UGC, India for Senior Research Fellowships. Abhishek Chanchal thanks IISER Bhopal for the institute postdoctoral fellowship. We thank Ms Tulsi Upadhyay for initial help with docking studies. We thank the DST-FIST supported TEM Facility in the department for the TEM images.References
- A. V. Bieliauskas and M. K. H. Pflum, Chem. Soc. Rev., 2008, 37, 1402–1413 CAS.
- J. E. Bolden, M. J. Peart and R. W. Johnstone, Nat. Rev. Drug Discovery, 2006, 5, 769–784 CAS.
- D. Y. Lee, J. J. Hayes, D. Pruss and A. P. Wolffe, Cell, 1993, 72, 73–84 CrossRef CAS.
- B. E. Gryder, M. K. Rood, K. A. Johnson, V. Patil, E. D. Raftery, L.-P. D. Yao, M. Rice, B. Azizi, D. F. Doyle and A. K. Oyelere, J. Med. Chem., 2013, 56, 5782–5796 CrossRef CAS.
- G. P. Delcuve, D. H. Khan and J. R. Davie, Clin. Epigenet., 2012, 4, 5 CrossRef CAS.
- J. Song, J. H. Noh, J. H. Lee, J. W. Eun, Y. M. Ahn, S. Y. Kim, S. H. Lee, W. S. Park, N. J. Yoo, J. Y. Lee and S. W. Nam, APMIS, 2005, 113, 264–268 CrossRef CAS.
- K. H. Jung, J. H. Noh, J. K. Kim, J. W. Eun, H. J. Bae, H. J. Xie, Y. G. Chang, M. G. Kim, H. Park, J. Y. Lee and S. W. Nam, J. Cell. Biochem., 2012, 113, 2167–2177 CrossRef CAS.
- F. A. Schroeder, C. Wang, G. C. Van de Bittner, R. Neelamegam, W. R. Takakura, A. Karunakaran, H. Y. Wey, S. A. Reis, J. Gale, Y. L. Zhang, E. B. Holson, S. J. Haggarty and J. M. Hooker, ACS Chem. Neurosci., 2014, 5, 1055–1062 CrossRef CAS.
- H. K. Lu, L. R. Gray, F. Wightman, P. Ellenberg, G. Khoury, W.-J. Cheng, T. M. Mota, S. Wesselingh, P. R. Gorry, P. U. Cameron, M. J. Churchill and S. R. Lewin, PLoS One, 2014, 9, e113341 CrossRef.
- J. M. Wagner, B. Hackanson, M. Lübbert and M. Jung, Clin. Epigenet., 2010, 1, 117–136 CrossRef CAS.
- A. V. Bieliauskas, S. V. W. Weerasinghe and M. K. H. Pflum, Bioorg. Med. Chem. Lett., 2007, 17, 2216–2219 CrossRef CAS.
- A. T. Negmeldin and M. K. H. Pflum, Bioorg. Med. Chem. Lett., 2017, 27, 3254–3258 CrossRef CAS.
- R. M. Balliet, G. Chen, C. J. Gallagher, R. W. Dellinger, D. Sun and P. Lazarus, Cancer Res., 2009, 69, 2981–2989 CrossRef CAS.
- X. Xu, P. E. Saw, W. Tao, Y. Li, X. Ji, S. Bhasin, Y. Liu, D. Ayyash, J. Rasmussen, M. Huo, J. Shi and O. C. Farokhzad, Adv. Mater., 2017, 29, 201700141 Search PubMed.
- S. Zheng, S. Guo, Q. Zhong, C. Zhang, J. Liu, L. Yang, Q. Zhang and G. Wang, ACS Med. Chem. Lett., 2018, 9, 149–154 CrossRef CAS.
- Q. Zhu, X. Yu, Q. Shen, Q. Zhang, M. Su, Y. Zhou, J. Li, Y. Chen and W. Lu, Bioorg. Med. Chem., 2018, 26, 4706–4715 CrossRef CAS.
- S. D. Bhagat, U. Singh, R. K. Mishra and A. Srivastava, ChemMedChem, 2018, 13, 2073–2079 CrossRef CAS.
- Y. Liao, L. Xu, S. Ou, H. Edwards, D. Luedtke, Y. Ge and Z. Qin, ACS Med. Chem. Lett., 2018, 9, 635–640 CrossRef CAS.
- K. B. Daniel, E. D. Sullivan, Y. Chen, J. C. Chan, P. A. Jennings, C. A. Fierke and S. M. Cohen, J. Med. Chem., 2015, 58, 4812–4821 CrossRef CAS.
- S. Balasubramanian, E. Verner and J. J. Buggy, Cancer Lett., 2009, 280, 211–221 CrossRef CAS.
- F. Yang, N. Zhao, D. Ge and Y. Chen, RSC Adv., 2019, 9, 19571–19583 RSC.
- P. L. Zinzani, V. Bonthapally, D. Huebner, R. Lutes, A. Chi and S. Pileri, Crit. Rev. Oncol. Hematol., 2016, 99, 214–227 CrossRef.
- A. Reddy M, A. Sharma and A. Srivastava, Chem. – Eur. J., 2012, 18, 7575–7581 CrossRef.
- M. Singh, S. Kundu, A. Reddy M, V. Sreekanth, R. K. Motiani, S. Sengupta, A. Srivastava and A. Bajaj, Nanoscale, 2014, 6, 12849–12855 RSC.
- S. D. Bhagat and A. Srivastava, CrystEngComm, 2016, 18, 4369–4373 RSC.
- S. Minucci and P. G. Pelicci, Nat. Rev. Cancer, 2006, 6, 38–51 CrossRef CAS.
- S. Shukla, Z. Shariat-Madar, L. A. Walker and B. L. Tekwani, Mol. Cell. Neurosci., 2016, 77, 11–20 CrossRef CAS.
- O. Trott and A. J. Olson, J. Comput. Chem., 2010, 31, 455–461 CAS.
- Y. Miyake, J. J. Keusch, L. Wang, M. Saito, D. Hess, X. Wang, B. J. Melancon, P. Helquist, H. Gut and P. Matthias, Nat. Chem. Biol., 2016, 12, 748–754 CrossRef CAS.
- A. Reddy M, A. Sharma, Q. Maqbool and A. Srivastava, RSC Adv., 2013, 3, 18900 RSC.
- A. Reddy M and A. Srivastava, Soft Matter, 2014, 10, 4863–4868 RSC.
- S. D. Bhagat and A. Srivastava, Biomater. Sci., 2020, 8(17), 4750–4756 RSC.
- P. D. Bonnitcha, B. J. Kim, R. K. Hocking, J. K. Clegg, P. Turner, S. M. Neville and T. W. Hambley, Dalton Trans., 2012, 41, 11293–11304 RSC.
- W. L. Mock and H. Cheng, Biochemistry, 2000, 39, 13945–13952 CrossRef CAS.
- L. Bauer and O. Exner, Angew. Chem., Int. Ed. Engl., 1974, 13, 376–384 CrossRef.
- B. Sharma, A. Singh, T. K. Sarma, N. Sardana and A. Pal, New J. Chem., 2018, 42, 6427–6432 RSC.
- M. A. Glozak, N. Sengupta, X. Zhang and E. Seto, Gene, 2005, 363, 15–23 CrossRef CAS.
- P. Marks, R. A. Rifkind, V. M. Richon, R. Breslow, T. Miller and W. K. Kelly, Nat. Rev. Cancer, 2001, 1, 194–202 CrossRef CAS.
- K. Huber, G. Doyon, J. Plaks, E. Fyne, J. W. Mellors and N. Sluis-Cremer, J. Biol. Chem., 2011, 286, 22211–22218 CrossRef CAS.
- J. Asthana, S. Kapoor, R. Mohan and D. Panda, J. Biol. Chem., 2013, 288, 22516–22526 CrossRef CAS.
- M. Namdar, G. Perez, L. Ngo and P. A. Marks, Proc. Natl. Acad. Sci. U. S. A., 2010, 107, 20003–20008 CrossRef CAS.
- M. V. Blagosklonny, R. Robey, D. L. Sackett, L. Du, F. Traganos, Z. Darzynkiewicz, T. Fojo and S. E. Bates, Mol. Cancer Ther., 2002, 1, 937–941 CAS.
- E. Bernhart, N. Stuendl, H. Kaltenegger, C. Windpassinger, N. Donohue, A. Leithner and B. Lohberger, Oncotarget, 2017, 8, 77254–77267 CrossRef.
- M. Mottamal, S. Zheng, T. L. Huang and G. Wang, Molecules, 2015, 20, 3898–3941 CrossRef CAS.
- J. E. Bolden, W. Shi, K. Jankowski, C.-Y. Kan, L. Cluse, B. P. Martin, K. L. MacKenzie, G. K. Smyth and R. W. Johnstone, Cell Death Dis., 2013, 4, e519 CrossRef CAS.
- A. Newbold, K. J. Falkenberg, H. M. Prince and R. W. Johnstone, FEBS J., 2016, 283, 4032–4046 CrossRef CAS.
- W. Shan, Y. Jiang, H. Yu, Q. Huang, L. Liu, X. Guo, L. Li, Q. Mi, K. Zhang and Z. Yang, Am. J. Cancer Res., 2017, 7, 1213–1226 CAS.
- E. C. Costa, A. F. Moreira, D. de Melo-Diogo, V. M. Gaspar, M. P. Carvalho and I. J. Correia, Biotechnol. Adv., 2016, 34, 1427–1441 CrossRef.
- O. Aydin, E. Vlaisavljevich, Y. Y. Durmaz, Z. Xu and M. E. H. ElSayed, Mol. Pharmaceutics, 2016, 13, 4054–4065 CrossRef CAS.
- J. Friedrich, C. Seidel, R. Ebner and L. A. Kunz-Schughart, Nat. Protocols, 2009, 4, 309–324 CAS.
- J. Zhou, X. Du, N. Yamagata and B. Xu, J. Am. Chem. Soc., 2016, 138, 3813–3823 CrossRef CAS.
Footnotes |
| † Electronic supplementary information (ESI) available. See DOI: 10.1039/d0bm01417f |
| ‡ These authors contributed equally to this work. |
| This journal is © The Royal Society of Chemistry 2021 |

