DOI:
10.1039/D0CE01539C
(Paper)
CrystEngComm, 2021,
23, 202-209
Spacer group-controlled luminescence and response of C3-symmetric triphenylamine derivatives towards force stimuli†
Received
21st October 2020
, Accepted 9th November 2020
First published on 9th November 2020
Abstract
Two C3-symmetric triphenylamine derivatives with three terminal cyano units as electron acceptors were prepared to investigate the effect of the spacer group on their photophysical properties and responses towards force. Their electronic transitions were carefully studied by electrochemistry, solvent-dependent spectroscopy and quantum chemical calculations. The results suggested that introducing a double bond between the donor and acceptor results in the longer absorption and emission wavelengths of TPAVCN owing to elevated HOMO and lowered LUMO energy levels and induces a larger excited state dipole moment because of the extended conjugated length. In polar solvents, both TPACN and TPAVCN possessed a longer emission wavelength. Theoretical calculations suggested that bathochromic shifts in emission bands could be ascribed to the large polar excited states owing to the light excitation-induced intramolecular charge transfer. Moreover, TPAVCN had a larger charge transfer length and average degree of the spatial extension of hole and electron distribution because of its longer molecular length. In crystals, TPAVCN had a longer emission wavelength relative to that of TPACN. Moreover, both compounds could reversibly change their fluorescence under force and solvent annealing stimuli, and their mechanochromic properties were regulated by spacer groups. TPACN changed its fluorescence from blue to cyan with a spectral shift of 12 nm after grinding, but a large spectral shift of 30 nm, and an obvious fluorescent color change from green to yellow were observed while grinding pristine TPAVCN solids.
Introduction
The potential function and applications of organic molecules have attracted significant attention. Numerous functions and applications have been reported, such as optical devices and sensors,1 electronic2 and magnetic3 field, force,4 optical memory and switching devices.5 Recently, mechanofluorochromism (MFC) has developed widely. Organic molecules with MFC properties can change their luminescence under force stimuli in an aggregate state. Under force stimuli, including shearing, crushing, grinding, rubbing, and pressure, these molecules might alter their packing models or molecular structures,4 which induces sharp changes in emissive energy gaps. MFC functional molecules have potential applications and are widely used in memory chips6–8 and security inks.9,10 So far, numerous functional units such as trephenylethene,11,12 9,10-divinylanthracene,13–16 triphenylamine,17–19 β-diketone boron complexes,20 phenothiazine,21 borondiiminates,22 and cyano-ethylene,23–25 have been used as building blocks to prepare smart organic molecules with MFC activity. These examples suggest that nonplanar and electron donor–acceptor (D–A) structures always endow molecules with the MFC properties. Most of these molecules possess a linear or C2-symmetric conformation, which results in large dipole moment and loose stacking between chromophores in a solid state.26 Under mechanical force stimuli, pristine intermolecular π-stacking in such aggregates can be easily destroyed and changed. Simultaneously, a linear D–A structure may enlarge alternation in π-stacking and then induce a large emission spectral shift. However, the fluorescence responses of C3-symmetric luminescent organic molecules towards force stimuli are rare,27,28 and some molecules are not sensitive towards force stimuli.29 So, it is necessary and worth to develop more C3-symmetric MFC molecules.
In this case, two C3-symmetric triphenylamine derivatives with three terminal cyano moieties as acceptors (Scheme 1) were designed and prepared. Moreover, the influences of the spacer group between triphenylamine and cyano units on their photophysical and MFC behaviors were studied. The results indicate that the spacer groups strongly affect the intrinsic electronic structure. A double bond as a spacer led to a bathochromic shift in the absorption and emission spectra owing to the narrowing of the energy gaps and could adjust their response towards force stimuli. A large fluorescence shift of 30 nm was observed, while the mechanical force was applied in the TPAVCN solid, but only a 12 nm shift emerged as the spacer group was a single bond.
 |
| | Scheme 1 Molecular structure of TPACN and TPAVCN. | |
Results and discussion
Design and synthesis
To explore the MFC of C3-symmetric molecules and the corresponding effect of spacer groups, two simple triphenylamine derivatives (TPACN and TPAVCN) were synthesized, in which nonplanar and three-armed triphenylamine was selected as the molecular core and electron donor. Single and double bonds were used as spacer units, and three-terminal cyano moieties played the acceptor role. Scheme 2 shows their synthesis routes. Two compounds could be prepared by the one-step Heck or Suzuki reaction. After purification via column chromatography, colorless TPACN and yellow TPAVCN solids were obtained in moderate yields.
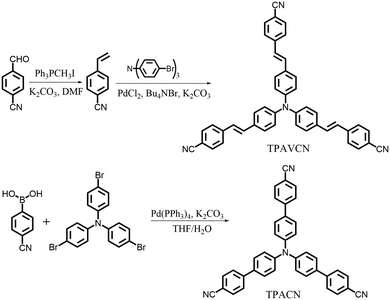 |
| | Scheme 2 Synthesis routes of two compounds. | |
Photophysical properties in a solution
Their photophysical properties in solutions have been investigated and compared by absorption and emission spectra. The two compounds were soluble in common solvents, such as toluene, THF, dichloromethane (DCM), ethyl acetate (EA), N,N-dimethylformamide (DMF) and dimethyl sulfoxide (DMSO), but they also showed small solubility in nonpolar n-hexane and cyclohexane. The colors of solutions in n-hexane were colorless and yellowish for TPACN and TPAVCN, respectively (Fig. 1). The absorption maximum of TPACN in n-hexane was located at 359 nm, and TPAVCN had a red-shifted absorption band with a maximum at 409 nm, suggesting that the double bond endows TPAVCN with a small electron transition gap (Table 1). To understand how the spacer groups affect energy gaps, electrochemical measurements and quantum chemical calculations were performed. Both compounds present reversible peaks in the oxidation region with an E1/2ox of 0.65 V for TPACN and 0.45 V for TPAVCN. Their HOMO energy levels were determined to be −5.42 and −5.25 eV for TPACN and TPAVCN, respectively. Then, LUMO energy levels were estimated from HOMO energy levels and Egs and were −2.87 and −2.98 eV, respectively (Table 1). This result indicates that the three double bonds allow TPAVCN to have an elevated HOMO and lower LUMO energy levels, which results in a small energy gap and a bathochromic absorption band of TPAVCN.
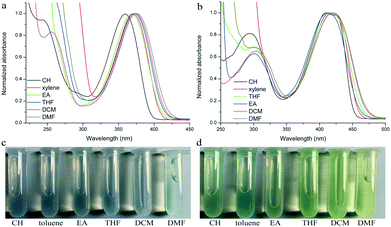 |
| | Fig. 1 Absorption spectra and corresponding photos of (a and c) TPACN and (b and d) TPAVCN under natural light in different solvents. | |
Table 1 Photophysical data of two compounds
|
|
λ
abs
(nm) |
λ
em
(nm) |
HOMOc (eV) |
LUMOd (eV) |
E
g
(eV) |
HOMOf (eV) |
LUMOf (eV) |
|
Maximal absorption peak in cyclohexane.
Maximal emission peak in cyclohexane.
Electrochemical method was used to obtain the HOMO energy levels by comparing it with an external reference, the ferrocene/ferrocenium (Fc/Fc+, 4.8 eV relative to vacuum).
The lUMO energy level was estimated by the equation: ELUMO = EHOMO + Eg.
E
g is the energy gap and is determined from the edge of the absorption spectrum.
Energy levels were obtained from quantum chemical calculations after configuration optimization.
|
| TPACN |
359 |
407 |
−5.42 |
−2.87 |
2.55 |
−5.56 |
−2.00 |
| TPAVCN |
408 |
451 |
−5.25 |
−2.98 |
2.27 |
−5.30 |
−2.33 |
To understand their intrinsic electron transitions, quantum chemical calculations were carried out. First, their configurations were optimized in vacuum without symmetry restriction, and then corresponding frontier orbitals could be visualized. Based on the optimized configurations, their electron transitions were simulated via time-dependent DFT calculations. The results are listed in Fig. 2 and Table S1.† Because of their C3-symmetry, their dipole moments are very small in the ground state. TPACN possesses two transitions with similar gaps from HOMO to LUMO or LUMO+1, respectively (Fig. 2, left). Because of the very small differences in two gaps, only one absorption band was observed (Fig. S2†). Moreover, HOMO mainly distributes in the triphenylamine unit, and LUMO and LUMO+1 mainly distribute in two arms, not three arms, meaning an asymmetric distribution. Moreover, the density in two-terminal cyano and adjacent phenyl ring increases. Table S2† shows quantitative contributions of atomic orbitals to frontier orbitals through the orbital composition analysis based on the natural atomic orbital (NAO) method. The results indicate that all three frontier orbitals originate from p orbitals of atoms, and the contents of three-terminal N atoms are less than 0.64% and the ratio of center N atom reaches 25.4% in HOMO. In contrast, the highest content of the peripheral N atom is more than 6.6% in LUMO, and the content of the central N atom is zero. The change in the orbital distribution implies that an electron transition from HOMO to LUMO or LUMO+1 after light irradiation will lead to intramolecular charge transfer (ICT) from the central triphenylamine moiety to peripheral two 4-cyanophenyl units. Then, the molecule at the excitation state will be more polar relative to that in the ground state. Furthermore, the calculation results also indicate that TPAVCN has higher HOMO and lower LUMO energy levels, which agrees with the result obtained from electrochemical measurements. Moreover, a similar change in orbital distributions was found after TPAVCN was excited by light (Fig. 2, right, and Table S3†), suggesting that a large polar excited state is expected too.
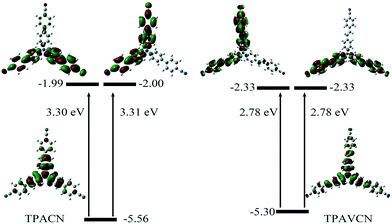 |
| | Fig. 2 Frontier orbitals, corresponding energy levels and transition energies based on quantum chemical calculations. | |
The hole–electron analyses were performed by Multiwfn in order to further clarify the impact of spacer groups on charge transfer phenomena.30Fig. 3 shows the distributions of hole and electron and their centroids (Chole and Cele) after the electron transition.31 The results indicate that positive charges located at triphenylamine units and negative charges mainly distribute in peripheral groups of two arms after two compounds were excited by light and the charge centroids are separate (Fig. 3b and d). The D indexes (expressing the charge transfer length by the distance between the centroid of the hole and electron) are 3.33 and 2.90 Å for the S0 → S1 and S0 → S2 excitations of TPACN, respectively. TPAVCN has larger D indexes, being 3.57 and 3.37 Å, for two similar transitions, respectively. This result illuminates that three double bonds extend the molecular length, and then give more obvious charge separation after light excitation. So, a larger dipole moment in the excited state of TPAVCN is expected.
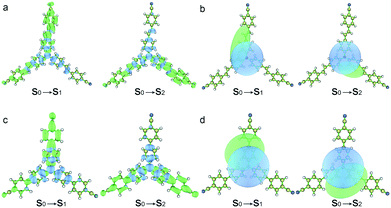 |
| | Fig. 3 (a and c) Distributions of hole and electron (green and blue represent the electron and hole distributions, respectively), and (b and d) corresponding Chole and Cele. | |
To verify the ICT transition and obtain the excited state dipole moment, solvent-dependent absorption and emission spectra were recorded. As shown in Fig. 1a and b, cyclohexane solutions of both compounds possessed the shortest absorption wavelengths, and the absorption spectra in other solvents slightly changed (Table 2). In contrast, the emission spectra had continuous red-shifts, while solvent polarity increased. For example, the maxima of TPACN are 407 nm in CH, 420 nm in toluene, 450 nm in EA, and further red-shifted to 486 nm in DMF. In addition, TPACN has a narrow emission band with a vibrational structure in low polar solvents and the emission band became wide in polar solvents (Fig. 4a). These phenomena indicate that the fluorescence of TPACN is from the ICT transition, and the excited state dipole moment (μe) is considerably larger than that of the S0 state (μg).32,33 There are bathochromic shifts and widening in the emission spectra of TPAVCN too, suggesting ICT property.
Table 2 Absorption and fluorescence date of two compounds in different solvents
| Solvent |
|
CH |
Toluene |
EA |
THF |
DCM |
DMF |
| TPACN |
λ
abs (nm) |
359 |
370 |
368 |
372 |
374 |
375 |
|
λ
em (nm) |
407 |
420 |
450 |
453 |
461 |
486 |
| TPAVCN |
λ
abs (nm) |
409; 423 |
415 |
412 |
417 |
420 |
420 |
|
λ
em (nm) |
451 |
465 |
503 |
510 |
520 |
558 |
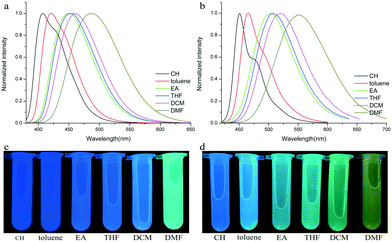 |
| | Fig. 4 Fluorescence spectra and corresponding photos of (a and c) TPACN and (b and d) TPAVCN in different solvents. | |
Based on solvent-dependent fluorescence spectra, their excited state dipole moments can be given by eqn (1),34 in which ![[small nu, Greek, tilde]](https://www.rsc.org/images/entities/i_char_e0e1.gif) max is the emission maxima, f(ε,n) is the solvent polarity function, ε is the relative permittivity (dielectric constant) and n is the refractive index. ε0 is the vacuum permittivity, h is the Planck constant and c is the speed of light. β is the equivalent spherical radius of the solute and can be obtained via Gaussian calculation. They are 6.27 and 6.82 Å for TAPCN and TPAVCN, respectively. The μg values are determined by quantum chemical calculation after configuration optimization and are 0.1594 and 0.4229 Debye for TAPCN and TPAVCN, respectively.
max is the emission maxima, f(ε,n) is the solvent polarity function, ε is the relative permittivity (dielectric constant) and n is the refractive index. ε0 is the vacuum permittivity, h is the Planck constant and c is the speed of light. β is the equivalent spherical radius of the solute and can be obtained via Gaussian calculation. They are 6.27 and 6.82 Å for TAPCN and TPAVCN, respectively. The μg values are determined by quantum chemical calculation after configuration optimization and are 0.1594 and 0.4229 Debye for TAPCN and TPAVCN, respectively.
| |  | (1) |
where
f(
ε,
n) =
f(
ε,
n) − 1/2 ×
f(
n2) = (
ε − 1)/(2
ε + 1) − 1/2 × (
n2 − 1)/(
n2 + 1).
The emission maxima ![[small nu, Greek, tilde]](https://www.rsc.org/images/entities/i_char_e0e1.gif) max of two compounds is plotted against the solvent polarity parameter f(ε) −
max of two compounds is plotted against the solvent polarity parameter f(ε) −  f(n2) in Fig. S3.† From the slope S (Δ(
![[small nu, Greek, tilde]](https://www.rsc.org/images/entities/i_char_e0e1.gif) max)/Δ(f(ε) −
max)/Δ(f(ε) −  f(n2)) of two plots and the corresponding ground state dipole moment μg, the excited state dipole moments can be calculated by using eqn (1) and are 17.5 and 20.1 Debye for TPACN and TPAVCN, respectively. A larger μe of TPAVCN implies that double bonds indeed promote an excited state with a larger polarity relative to TPACN because double bonds extend the separation of positive and negative charges in excited states. These differences in. the intrinsic electron transition will affect their photoluminescence behaviors and responsive properties towards force stimuli in solid states.
Photophysical properties and responses towards force stimuli in solid-state
The colors of the as-synthesized solids of the two compounds are different, and TPACN is colorless and TPAVCN is yellow and emitted different color fluorescence under 365nm light (Fig. 5a and b). The absorption peak of TPACN red-shifted from 359 nm in CH to 427 nm in the pristine solid-state, suggesting the presence of π-stacking in solids.35–38 The red-shifted absorption band could be found for TPAVCN after crystallization too, also implying π–π packing. The pristine TPACN solids emitted blue fluorescence and have a maximal emission peak at 465 nm (Fig. 5c). TPAVCN crystals emitted green fluorescence with a maximum at 509 nm.
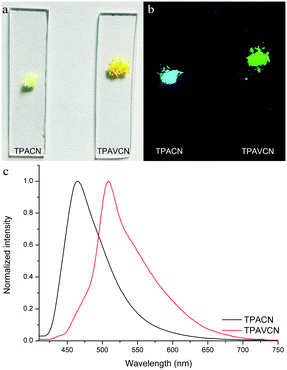 |
| | Fig. 5 Photos of two compounds under (a) natural and (b) 365 nm lights, and (c) fluorescence spectra of pristine two compounds. | |
To investigate the effect of molecular staking on their emission behaviors, we tried to obtain their crystal structures via single-crystal analysis. Unfortunately, only good yellow crystals of TPAVCN for the single-crystal analysis were obtained. The diffusion of n-hexane to the CH2Cl2 solution of TPAVCN at room temperature for about one week afforded yellow sheet-shaped crystals suitable for X-ray analysis. Although the large rod-shaped crystals of TPACN could be obtained from similar solvent diffusion, the diffraction signals were too weak to analyze its stacking structure. Thesingle crystal X-ray diffraction analysis reveals that TPAVCN crystallizes in the monoclinic Cc space group. In its crystal structure, molecules stack in the 1D head-to-tail aggregate (J-aggregate) along one arm direction (Fig. 6a and b) and the slip angle is 25.35°. Donor triphenylamine units overlap with acceptor 4-cyanophenyl moieties via electrostatic attraction between local dipole moments. The shortest C–C distance between the donor and acceptor reaches 3.38 Å, but the interplanar distance of terminal 4-cyanophenyl groups is as large as 4.6 Å. Such intermolecular stacking induces a redshift of 55 nm in the absorption spectra after aggregation.39–41 In the top view, it can be observed that the π–π interaction is absent between the other two arms within 1D J-aggregate, and there are large voids between molecules. These voids are filled by other 1D aggregates (Fig. 6c), and an obvious π-stacking does not exist between 1D aggregates. Such loose stacking is expected to be easily destroyed by force, so the MFC phenomenon will emerge for TPAVCN.42–44 Although detailed stacking information in TPACN crystals is unknown, J-aggregate is believed to be present in the crystal because a large red-shift of 68 nm in the absorption spectra exists by comparing with its solution.
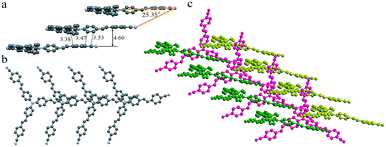 |
| | Fig. 6 1D stacking in (a) front and (b) top views, and (c) packing between three 1D stacking. Hydrogen atoms are hidden for clarity. | |
The MFC behaviors of two compounds were investigated through emission, absorption and XRD techniques under mechanical crushing. Table 3, Fig. S3† and 7 show the data for absorption and fluorescence spectral peaks before and after grinding. TPACN did not show an obvious color change after grinding and was kept colorless. The fluorescence color changed from blue to cyan. The emission peak at 465 nm shifted to 477 nm, meaning a spectral shift value of 12 nm (Fig. 7a). While fuming the ground solid with saturated CH2Cl2 vapor for 10s, the fluorescence of solids could be restored to blue fluorescence, which could turn into cyan again after grinding. Moreover, such spectral conversions could be repeated numerous times (Fig. S4†), being suggestive of a reversible MFC process.45–47 X-ray diffraction patterns and absorption spectra of pristine and ground solids were also recorded to understand the MFC mechanism. As shown in Fig. 8a, numerous strong diffraction peaks were found for the pristine solid, and many peaks became weak or disappeared after grinding. The result indicates that ordered stacking in pristine solid has been destroyed under force and the ground solid was at an amorphous state.48–50 After fuming with CH2Cl2 vapor, some weak diffraction peaks became strong and the disappeared peaks emerged again, suggesting the reappearance of the ordered arrangement and restoration of the original crystalline phase after fuming.51–55 XRD results illustrate that the MFC process of TPACN is accompanied by a phase transition between ordered crystals and disordered amorphous powder. An evident blue-shift of 34 nm in the absorption spectrum after grinding was found (Fig. S5†), indicating the change of the original π-stacking in the crystal state. So, sharp conversion in intermolecular interaction should be responsible for the MFC behavior of TPACN.
Table 3 Absorption and fluorescence data of two compounds under different states
|
|
λ
abs (nm) |
Δλabs (nm) |
λ
em (nm) |
Δλem (nm) |
| Pristine |
Ground |
Pristine |
Ground |
| TPACN |
427 |
393 |
34 |
465 |
477 |
12 |
| TPAVCN |
464 |
441 |
23 |
509 |
539 |
30 |
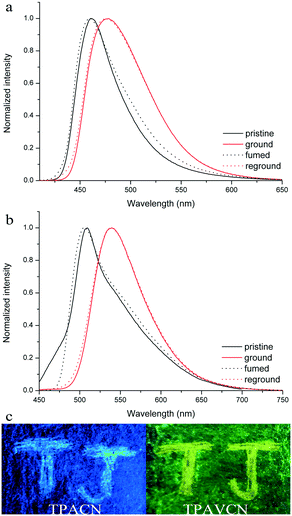 |
| | Fig. 7 Fluorescence spectra of (a) TPACN and (b) TPAVCN solids under different states, and (c) images of two compounds on pieces of the weighing paper in response towards grinding under 365 nm light. | |
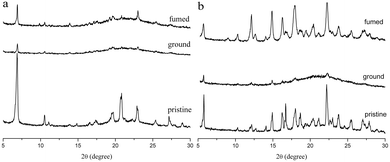 |
| | Fig. 8 XRD patterns of (a) TPACN and (b) TPAVCN in different states. | |
On the other hand, TPAVCN possessed a larger fluorescence spectral shift than that of TPACN under force stimuli. After grinding, the emission peak red-shifted from 509 nm to 539 nm, indicating a bathochromic shift of 30 nm, and the ground solids showed yellow fluorescence under 365 nm light (Fig. 7c). In addition, the fluorescence color of the ground solids could be recovered too after fuming with CH2Cl2 vapor, revealing reversible MFC behaviors. The XRD data indicated that the phase transition between the crystalline and amorphous states exists in the MFC process of TPAVCN too. A smaller blue-shift of 23 nm relative to that of TPACN was observed after grinding. The result indicates that the change of π-stacking is not significant. However, TPAVCN possesses a more obvious fluorescence conversion. It may be ascribed to its large excited-state dipole moment, which will result in a significant change in the emission wavelength even if a slight variation in π-stacking existed. It is clear that the two crystals possessed blue-shifts in absorption after grinding, suggesting pristine J-aggregates and intermolecular weak interactions destroyed. In such disordered aggregates, molecules in the excited state will have a large conformation change through vibrational relaxation, which induces an energy decrease in the excited state. As a result, red-shifted fluorescence is observed.
Conclusions
Two C3-symmetric triphenylamine derivatives with three terminal cyano units were synthesized and the effect of spacer groups on the photophysical properties in solutions and aggregate states were investigated. The absorption and emission spectra, electrochemical measurements and quantum chemical calculations suggest that a double bond as spacer groups might lead to longer absorption and emission wavelengths because rising HOMO and decreased LUMO energy levels bring about a small energy gap. Double bonds also resulted in an evident charge separation and then caused a larger excited state dipole moment compared to that with a single bond as a spacer unit. Moreover, both compounds exhibited MFC behaviors. However, the compound with double bonds had excellent MFC properties and possessed a large spectral shift after grinding. The obtained results clearly indicate that C3-symmetric molecules may have mechanofluorochromism, and spacer moieties within molecules play an important role in regulating both molecular photophysical and response properties towards external stimuli. More number of C3-symmetric molecules with excellent MFC properties by introducing proper spacer groups will be developed.
Experimental section
Measurements and instruments
1H and 13C NMR spectra were recorded using a Bruker Avance 400 MHz spectrometer at 400 and 101 MHz in CDCl3. UV-vis spectra were recorded on a Mapada UV-1800pc spectrophotometer. Fluorescence emission spectra were recorded on a Hitachi F-4700 fluorescence spectrophotometer. C, H, and N elemental analyses were performed on a PerkinElmer 240C elemental analyzer. XRD patterns were obtained on a Bruker D8 Advance X-ray diffraction instrument equipped with graphite-mono-chromatized CuKα radiation (λ = 1.5418 Å) at a scanning rate of 0.02 ° s−1 in the 2θ range from 5° to 30°. Cyclic voltammetry was employed using a three-electrode cell and an electrochemistry work station (CHI 604) at room temperature at a scan rate of 50 mV s−1. The working electrode was a Pt disc, a Pt wire was used as the auxiliary electrode, and an Ag/AgCl electrode was used as the reference electrode. Tetrabutylammonium tetrafluoroborate (TBABF4, 0.1 M) was used as the supporting electrolyte in dry CH2Cl2, and the ferrocenium/ferrocene (Fc/Fc+) redox couple was used as a potential reference. Grinding and fuming the annealing process: the ground sample was obtained by grinding the pristine solid in a mortar, and then was placed in a weighing bottle with CH2Cl2 to obtain fumed samples. Geometrical optimization was performed by density functional theory (DFT) calculations at the B3LYP/6-31G(d) level with the Gaussian 09 W program package. Electronic transition data were obtained by the TD/DFT-mpw1pw91-B3LYP/6-31G(d) calculation based on the conformation at the ground state. Wavefunction analysis was performed with Multiwfn software.
Preparation of single crystal
TPACN (5.0 mg) was dissolved in 3 mL CH2Cl2 and 5 mL n-hexane was slowly added on top of the solution. The mixture was placed for 3 days, and yellow crystals were obtained. Single crystal X-ray diffraction experiments were carried on a Bruker Rigaku RAXIS-RAPID CCD-based diffractometer with graphite monochromatized Cu Kα radiation (λ = 1.54184 Å) using the φ–ω scan technique at room temperature. Multiscan absorption corrections were applied with the SADABS program. The crystal structure was solved using direct methods and refined with the SHELXL-2015 program. CCDC 1973463 contains the supplementary crystallographic data.
Synthesis
4-Cyanostyrene.
4-Cyanobenzaldehyde (2.0 g, 15 mmol), K2CO3 (2.1 g, 15 mmol), and Ph3PCH3I (7.3 g, 18 mmol) were added to DMF (20 mL). The mixture was heated at 110 °C for 3 days. After cooling to room temperature, the mixture was poured into the NaCl dilute solution (150 mL) and was extracted with dichloromethane. The organic phase was washed with water three times. After removing solvents, the crude product was purified via column chromatography (silica, PE/EA = 8/1) to obtain the corresponding products as a colorless oil. Yield: 1.47 g (75%). 1H NMR (400 MHz, CDCl3) δ 7.61 (d, J = 8.4 Hz, 2H), 7.48 (d, J = 8.4 Hz, 2H), 6.73 (dd, J = 17.6, 10.9 Hz, 1H), 5.88 (d, J = 17.6 Hz, 1H), 5.45 (d, J = 10.9 Hz, 1H).
4,4′,4′′-(1E,1′E,1′′E)-2,2′,2′′-(4,4′,4′′-nitrilotris(benzene-4,1-diyl))tris(ethene-2,1-diyl)tribenzonitrile (TPAVCN).
4-Cyanostyrene (3.0 g, 23 mmol), tris(4-bromophenyl)amine (5.8 g, 12 mmol), Bu4NBr (4.0 g, 12 mmol) and K2CO3 (2.2 g, 16 mmol) were added to dry DMF (30 mL). After N2 was bubbled in the mixture for 5 min, PdCl2 (5.0 mg) was added and the mixture was stirred at 120 °C for 1 day. The mixture was poured into the NaCl dilute solution (150 mL) and was extracted with DCM three times. The solvent was removed in rotary evaporators, and the residue was purified via column chromatography (PE/DCM = 1/1) to obtain the corresponding product as yellow solid. Yield: 0.8 g (28%). Elemental analysis: C, 85.38; H, 4.41; N, 10.21; found: C, 85.31; H, 4.47; N, 10.27. 1H NMR (400 MHz, CDCl3) δ 7.63 (d, J = 8.4 Hz, 6H), 7.57 (d, J = 8.4 Hz, 6H), 7.46 (d, J = 8.6 Hz, 6H), 7.18 (d, J = 16.3 Hz, 3H), 7.14 (d, J = 8.6 Hz, 6H), 7.01 (d, J = 16.3 Hz, 3H) (Fig. S6†). 13C NMR (101 MHz, CDCl3) δ 147.22, 141.97, 132.51, 131.58, 131.55, 128.06, 126.69, 125.65, 124.40, 119.03, 110.41 (Fig. S7†).
4′,4′′,4′′‘-nitrilotribiphenyl-4-carbonitrile (TPACN).
Tris(4-bromophenyl)amine (2.62 g, 5.53 mol), 4-cyanophenylboronic acid (4.00 g, 27.2 mmol) and K2CO3 (7.5 g, 54.3 mmol) were added in 150 mL THF and the mixture was stirred for 5 min. After water (2.0 mL) was added, the mixture was purged with nitrogen at room temperature. After adding Pd(Pph3)4 (5.0 mg), the mixture was refluxed for 48 h and poured into 500 mL water. The crude product was obtained by suction filtration, and purified via column chromatography (silica, DCM/PE = 2/1). Yield: 84%. Elemental analysis: C, 86.24; H, 4.82; N, 8.94; found: C, 86.20; H, 4.89; N, 8.84. 1H NMR (400 MHz, CDCl3) δ 7.73 (d, J = 8.7 Hz, 6H), 7.68 (d, J = 8.7 Hz, 6H), 7.55 (d, J = 8.7 Hz, 6H), 7.27 (d, J = 8.7 Hz, 6H) (Fig. S8†). 13C NMR (101 MHz, CDCl3) δ 147.53, 144.74, 133.99, 132.69, 128.30, 127.17, 124.72, 118.98, 110.60 (Fig. S9†).
Conflicts of interest
There are no conflicts to declare.
Acknowledgements
This work was supported by the Scientific Research Foundation of Tianjin Normal University (Grant No. 5RL151), and the Science &Technology Development Fund of Tianjin Education Commission for Higher Education (2018ZD12).
Notes and references
- C. Y. K. Chan, J. W. Y. Lam, Z. Zhao, S. Chen, P. Lu, H. H. Y. Sung, H. S. Kwok, Y. Ma, I. D. Williams and B. Z. Tang, J. Mater. Chem. C, 2014, 2, 4320–4327 RSC.
- D. Chen and Q. Pei, Chem. Rev., 2017, 117, 11239–11268 CrossRef CAS.
- F. J. Wang, H. Bässler and Z. Valy Vardeny, Phys. Rev. Lett., 2008, 101, 236805 CrossRef CAS.
- M. Raisch, D. Genovese, N. Zaccheroni, S. B. Schmidt, M. L. Focarete, M. Sommer and C. Gualandi, Adv. Mater., 2018, 30, 1802813 CrossRef.
- H. Li, M. Pang, X. Guo and J. Meng, Chem. Res. Chin. Univ., 2015, 31, 357–361 CrossRef CAS.
- Z. Chi, X. Zhang, B. Xu, X. Zhou, C. Ma, Y. Zhang, S. Liu and J. Xu, Chem. Soc. Rev., 2012, 41, 3878–3896 RSC.
- C. Arivazhagan, A. Maity, K. Bakthavachalam, A. Jana, S. K. Panigrahi, E. Suresh, A. Das and S. Ghosh, Chem. – Eur. J., 2017, 23, 7046–7051 CrossRef CAS.
- J.-C. Yang, Y.-C. Ho and Y.-H. Chan, ACS Appl. Mater. Interfaces, 2019, 11, 29341–29349 CrossRef CAS.
- M. Irie, T. Fukaminato, T. Sasaki, N. Tamai and T. Kawai, Nature, 2002, 420, 759–760 CrossRef CAS.
- X. Zhu, R. Liu, Y. Li, H. Huang, Q. Wang, D. Wang, X. Zhu, S. Liu and H. Zhu, Chem. Commun., 2014, 50, 12951–12954 RSC.
- R. Misra, T. Jadhav, B. Dhokale and S. M. Mobin, Chem. Commun., 2014, 50, 9076–9078 RSC.
- X. Y. Shen, Y. J. Wang, E. Zhao, W. Z. Yuan, Y. Liu, P. Lu, A. Qin, Y. Ma, J. Z. Sun and B. Z. Tang, J. Phys. Chem. C, 2013, 117, 7334–7347 CrossRef CAS.
- L. Zhou, D. Xu, H. Gao, A. Han, X. Liu, C. Zhang, Z. Li and Y. Yang, Dyes Pigm., 2017, 137, 200–207 CrossRef CAS.
- L. Zhou, D. Xu, H. Gao, A. Han, Y. Yang, C. Zhang, X. Liu and F. Zhao, RSC Adv., 2016, 6, 69560–69568 RSC.
- P. Galer, R. C. Korošec, M. Vidmar and B. Šket, J. Am. Chem. Soc., 2014, 136, 7383–7394 CrossRef CAS.
- X. Wang, Q. Liu, H. Yan, Z. Liu, M. Yao, Q. Zhang, S. Gong and W. He, Chem. Commun., 2015, 51, 7497–7500 RSC.
- Y. Gong, Y. Tan, J. Liu, P. Lu, C. Feng, W. Z. Yuan, Y. Lu, J. Z. Sun, G. He and Y. Zhang, Chem. Commun., 2013, 49, 4009–4011 RSC.
- S.-Z. Pu, Q. Sun, C.-B. Fan, R.-J. Wang and G. Liu, J. Mater. Chem. C, 2016, 4, 3075–3093 RSC.
- J. Jia and H. Zhao, Tetrahedron Lett., 2019, 60, 252–259 CrossRef CAS.
- Z. Wang, M. Wang, J. Peng, Y. Xie, M. Liu, W. Gao, Y. Zhou, X. Huang and H. Wu, J. Phys. Chem. C, 2019, 123, 27742–27751 CrossRef CAS.
- P. Xue, T. Zhang and Y. Han, J. Mater. Chem. C, 2019, 7, 9537–9544 RSC.
- Z. Zhang, Z. Wu, J. Sun, B. Yao, G. Zhang, P. Xue and R. Lu, J. Mater. Chem. C, 2015, 3, 4921–4932 RSC.
- Y. Lim, I. Choi, H. Lee, I. W. Kim and J. Y. Chang, J. Mater. Chem. C, 2014, 2, 5963–5968 RSC.
- J. Zhao, Z. Chi, Y. Zhang, Z. Mao, Z. Yang, E. Ubba and Z. Chi, J. Mater. Chem. C, 2018, 6, 6327–6353 RSC.
- M. Herder, B. M. Schmidt, L. Grubert, M. Pätzel, J. Schwarz and S. Hecht, J. Am. Chem. Soc., 2015, 137, 2738–2747 CrossRef CAS.
- X. Huang, L. Qian, Y. Zhou, M. Liu, Y. Cheng and H. Wu, J. Mater. Chem. C, 2018, 6, 5075–5096 RSC.
- Y. Lim, I. Choi, H. Lee, I. W. Kim and J. Y. Chang, J. Mater. Chem. C, 2014, 2, 5963–5968 RSC.
- Y. Zhang, Y. Q. Feng, J. H. Wang, G. Han, M. Y. Li, Y. Xiao and Z. D. Feng, RSC Adv., 2017, 7, 35672–35680 RSC.
- M. Fang, J. Yang, Q. Liao, Y. Gong, Z. Xie, Z. Chi, Q. Peng, Q. Li and Z. Li, J. Mater. Chem. C, 2017, 5, 9879–9885 RSC.
- T. Lu and F. Chen, J. Comput. Chem., 2012, 33, 580–592 CrossRef CAS.
- T. Le Bahers, C. Adamo and I. Ciofini, J. Chem. Theory Comput., 2011, 7, 2498–2506 CrossRef CAS.
- T. Yoshihara, V. A. Galievsky, S. I. Druzhinin, S. Saha and K. A. Zachariasse, Photochem. Photobiol. Sci., 2003, 2, 342–353 RSC.
- P. Pander, S. Gogoc, M. Colella, P. Data and F. B. Dias, ACS Appl. Mater. Interfaces, 2018, 10, 28796–28802 CrossRef CAS.
- V. M. Divac, D. Šakić, T. Weitner and M. Gabričević, Spectrochim. Acta, Part A, 2019, 212, 356–362 CrossRef CAS.
- M. Sun, L. Zhai, J. Sun, F. Zhang, W. Mi, J. Ding and R. Lu, Dyes Pigm., 2019, 162, 67–74 CrossRef CAS.
- Z. Mao, Z. Yang, Z. Fan, E. Ubba, W. Li, Y. Li, J. Zhao, Z. Yang, M. P. Aldred and Z. Chi, Chem. Sci., 2019, 10, 179–184 RSC.
- P. Xue, J. Ding, P. Chen, P. Wang, B. Yao, J. Sun, J. Sun and R. Lu, J. Mater. Chem. C, 2016, 4, 5275–5280 RSC.
- J. Jiao, C. Tan, Z. Li, Y. Liu, X. Han and Y. Cui, J. Am. Chem. Soc., 2018, 140, 2251–2259 CrossRef CAS.
- Y. Qi, W. Xu, R. Kang, N. Ding, Y. Wang, G. He and Y. Fang, Chem. Sci., 2018, 9, 1892–1901 RSC.
- Y. Wu and W. Zhu, Chem. Soc. Rev., 2013, 42, 2039–2058 RSC.
- P. Xue, B. Yao, J. Sun, Z. Zhang, K. Li, B. Liu and R. Lu, Dyes Pigm., 2015, 112, 255–261 CrossRef CAS.
- L. Yao, X. Huang, H. Xia, H. He and L. Shen, Dyes Pigm., 2021, 184, 108747 CrossRef CAS.
- Y. Xu, Y. Li, Y. Meng and H. Li, Nanoscale, 2020, 12, 16433–16437 RSC.
- P. Xue, P. Chen, J. Jia, Q. Xu, J. Sun, B. Yao, Z. Zhang and R. Lu, Chem. Commun., 2014, 50, 2569–2571 RSC.
- B. Li, B. Lawrence, G. Li and H. Ge, Angew. Chem., 2020, 59, 3078–3082 CrossRef CAS.
- P. Josse, M. Allain, J. P. Calupitan, Y. Jiang, C. Cabanetos and J. Roncali, Adv. Opt. Mater., 2020, 8, 2000420 CrossRef CAS.
- S. Jena, P. Dhanalakshmi, G. Bano and P. Thilagar, J. Phys. Chem. B, 2020, 124, 5393–5406 CrossRef CAS.
- Y. Zhang, M. Qile, J. Sun, M. Xu, K. Wang, F. Cao, W. Li, Q. Song, B. Zou and C. Zhang, J. Mater. Chem. C, 2016, 4, 9954–9960 RSC.
- Y. Yin, H. Hu, Z. Chen, H. Liu, C. Fan and S. Pu, Dyes Pigm., 2021, 184, 108828 CrossRef CAS.
- T. Sun, D. Cheng, Y. Chai, J. Gong, M. Sun and F. Zhao, Dyes Pigm., 2019, 170, 107619 CrossRef CAS.
- P. Xue, B. Yao, J. Sun, Q. Xu, P. Chen, Z. Zhang and R. Lu, J. Mater. Chem. C, 2014, 2, 3942–3950 RSC.
- Y. Lai, J. Huang, S. Wu, Q. Zhu and Y. Liu, Dyes Pigm., 2019, 166, 8–14 CrossRef CAS.
- J. Sun, H. Yang, O. Simalou, K. Lv, L. Zhai, J. Zhao and R. Lu, New J. Chem., 2019, 43, 10134–10140 RSC.
- H. Gao, P. Xue, J. Peng, L. Zhai, M. Sun, J. Sun and R. Lu, New J. Chem., 2019, 43, 77–84 RSC.
- Z. Yang, P. Xue, L. Zhang and P. Chen, New J. Chem., 2019, 43, 14603–14608 RSC.
Footnote |
| † Electronic supplementary information (ESI) available: Cyclic voltammetry curve, quantum chemical calculation data, solvatochromic plots and solid absorption spectra. CCDC 1973463. For ESI and crystallographic data in CIF or other electronic format see DOI: 10.1039/d0ce01539c |
|
| This journal is © The Royal Society of Chemistry 2021 |
Click here to see how this site uses Cookies. View our privacy policy here.  *
*


![[small nu, Greek, tilde]](https://www.rsc.org/images/entities/i_char_e0e1.gif) max is the emission maxima, f(ε,n) is the solvent polarity function, ε is the relative permittivity (dielectric constant) and n is the refractive index. ε0 is the vacuum permittivity, h is the Planck constant and c is the speed of light. β is the equivalent spherical radius of the solute and can be obtained via Gaussian calculation. They are 6.27 and 6.82 Å for TAPCN and TPAVCN, respectively. The μg values are determined by quantum chemical calculation after configuration optimization and are 0.1594 and 0.4229 Debye for TAPCN and TPAVCN, respectively.
max is the emission maxima, f(ε,n) is the solvent polarity function, ε is the relative permittivity (dielectric constant) and n is the refractive index. ε0 is the vacuum permittivity, h is the Planck constant and c is the speed of light. β is the equivalent spherical radius of the solute and can be obtained via Gaussian calculation. They are 6.27 and 6.82 Å for TAPCN and TPAVCN, respectively. The μg values are determined by quantum chemical calculation after configuration optimization and are 0.1594 and 0.4229 Debye for TAPCN and TPAVCN, respectively.
![[small nu, Greek, tilde]](https://www.rsc.org/images/entities/i_char_e0e1.gif) max of two compounds is plotted against the solvent polarity parameter f(ε) −
max of two compounds is plotted against the solvent polarity parameter f(ε) −  f(n2) in Fig. S3.† From the slope S (Δ(
![[small nu, Greek, tilde]](https://www.rsc.org/images/entities/i_char_e0e1.gif) max)/Δ(f(ε) −
max)/Δ(f(ε) −  f(n2)) of two plots and the corresponding ground state dipole moment μg, the excited state dipole moments can be calculated by using eqn (1) and are 17.5 and 20.1 Debye for TPACN and TPAVCN, respectively. A larger μe of TPAVCN implies that double bonds indeed promote an excited state with a larger polarity relative to TPACN because double bonds extend the separation of positive and negative charges in excited states. These differences in. the intrinsic electron transition will affect their photoluminescence behaviors and responsive properties towards force stimuli in solid states.


