Electromechanical coupling in elastomers: a correlation between electrostatic potential and fatigue failure†
Yan A.
Santos da Campo
 a,
Dylan
Mehler
b,
Ezequiel
Lorenzett
b,
Kelly S.
Moreira
b,
Ana L.
Devens
b,
Leandra P.
dos Santos
 c,
Fernando
Galembeck
c and
Thiago A. L.
Burgo
 *ab
*ab
aDepartment of Chemistry, Federal University of Santa Maria, Santa Maria, RS 97105-900, Brazil. E-mail: thiago.burgo@ufsm.br
bDepartment of Physics, Federal University of Santa Maria, Santa Maria, RS 97105-900, Brazil
cInstitute of Chemistry, University of Campinas, Campinas, SP 13083-970, Brazil
First published on 24th September 2021
Abstract
The recent discovery of electromechanical coupling in elastomers showed periodic electrification in phase with rubber stretching but following different electrostatic potential patterns. In this work, a Kelvin electrode monitored silicone and natural rubber electrification for extended periods until the rubber tubing underwent rupture. The electric potential of the rubber follows regular, quasi-sinusoidal patterns at the beginning and during the whole run, except when close to rubber fatigue failure, changing into complex waveforms. The attractors on natural latex and silicone rubber become chaotic at roughly 50 seconds before rubber rupture when the nearby orbits diverge wildly. Thus, mechanical-to-electrical transduction in rubber alerts fatigue failure nearly one minute ahead of the breakdown. Moreover, electrostatic potential maps of stretched rubbers show the electrification of the rupture sites, evidencing the electrostatic contribution to the breakdown. These results show the convenient features of electromechanical coupling in rubbers for the non-contact, real-time prediction of the rubber fatigue failure, adding to the possibility of environmental energy harvesting.
Introduction
Elastomers account for a small fraction of overall materials production, but they are hardly replaceable by other types of materials due to their unique combination of mechanical properties. For this reason, large or small rubber parts are found in almost every transportation equipment, industrial machinery, robotic devices, medical ware and household goods. Large amounts of rubber are used to make vehicle tires and other parts that involve safety concerns such as firefighting hoses, vibration absorbers and transportation belts that are subjected to periodic mechanical efforts for extended periods. The risk associated with the rubber product failure1 and the complexity of rubber materials and products led to the development of the equipment for their non-destructive examination.2The most important rubber materials are made from cross-linked macromolecules, forming insoluble networks, and they are often loaded with other organic or inorganic constituents that play important roles. This makes rubber analysis especially difficult, requiring a number of specific, special techniques. Moreover, the mobility of rubber surface components produces a quick surface change even with a small change in the environment, placing a limitation on the usefulness of techniques that require rubber contact with definite materials or immersion in a liquid or high vacuum, for instance.
A point of special concern is rubber heterogeneity, either in the raw materials or in the finished goods. An industrial rubber product may contain ten or more components, whose processing requires energetic mixing. Even if this is successful, thermodynamically driven de-mixing may introduce heterogeneity in the finished material, whose detection is a challenge, considering the already mentioned analytical difficulties. In particular, natural latex is complex since it is a natural product whose properties depend on the agricultural environment and on latex processing that adds or eliminates different components which may have an important effect on the final rubber properties.3–6 Moreover, during their use, rubber materials undergo chemical reactions, whose detection requires the creative development of specific methods.7
The pre-service or in-service, real-time monitoring of parts made with rubbers, is desirable to detect material degradation, modification and wear that may lead to failure. Many efforts have led to significant advances in our understanding of rubbers,8 while extensive literature review has pointed out to four major categories of factors that influence mechanical fatigue life of rubber components:9 mechanical load, environmental conditions, rubber formulation and the change in the mechanical properties due to the dissipative aspects of the constitutive response of rubber. In fact, with a certain degree of accuracy, it is possible to predict the dynamic fatigue life of rubbers under constant load conditions by knowing the strain length.10 In addition, due the high entropy state of rubbers, mechanochemical reactions are less pronounced on pre-strained elastomers under periodic deformations, withstanding oscillation strokes for longer periods until rupture.10 On the other hand, it is not always an easy task, being aware that all these variables and rubbers suddenly undergo fatigue failure.
Real-time monitoring can increase safety in equipment use, probably increasing also the service lifetime of rubber goods. Unfortunately, excluding direct and camera-aided visual inspections,11 in-service real-time monitoring is rarely possible for any material. Moreover, extracting information from optical inspection requires significant expertise, but this is being changed by the inputs from artificial intelligence, large arrays of sensors, massive data processing and other recent developments.
Digital image correlation (DIC) is a powerful analytical optical technique capable of comparing images during testing to produce full-field strain and displacement maps.12,13 The maps are very intuitive and used to visualize contour, deformation, vibration and strain on almost any material over the full two-dimensional surface of the test specimen.14,15 On the other hand, DIC usually requires the creation of a speckle pattern onto the specimen using aerosol sprays16 (matt white and/or black), but this can modify important surface properties. In addition, DIC is not suitable for long-time monitoring of samples under periodic motion hence it is not capable of predicting fatigue failure in a specific time. Moreover, since DIC relies on complex measurement chains,17 it has inherent source of errors such as those from the displacements obtained with DIC algorithms.
Due to the discrete and invisible nature of electrostatic charges18 and the lack of firm knowledge on the nature of the charged carriers of dielectric materials,19–22 the electrical properties of dielectric elastomers have not been investigated. In fact, electrostatic phenomena are seldom mentioned in the studies of rubber fatigue and electrostatic measurements have not been used in rubber analysis and monitoring, with a few exceptions.23 For example, rubbers were found to be sensitive to electric charges built during periodic deformation and the fatigue life is increased by grounding the rubber specimen,24 but no explanation was then provided to describe this phenomenon.9 In addition, the electrostatic techniques of materials analysis are not widespread because the measured potential or charge is not easily correlated to the changes in material composition due to the limitations of current knowledge on the mechanism of charge formation, accumulation and transfer, in dielectrics.25–29 Fortunately, this area is now receiving greater attention30 and there has been conceptual and instrumental progress.31–34
Recently, our group has published new results on rubber electrostatic charging and the methods used allow the detection of rubber modification triggered by mechanochemical action.35 Very high electrostatic potentials are displayed on rubbers during periodic loads36 with an important contribution from relative humidity (RH).35 Moreover, rubbers exhibit this electromechanical coupling throughout their lifetime, but the electrostatic potentials have a very peculiar behavior close to rubber fatigue.37 This motivated the acquisition of an extended time series of non-contact electrostatic potentials measured in periodically stretched rubbers that are presented and discussed in this study.
Experimental
Materials and methods
Natural latex for laboratory and medical use (Z255785, Sigma-Aldrich) and commercial silicone rubber tubes with an internal diameter of 3.175 mm and an external diameter of 6.35 mm were cut into 60 mm long pieces. The tubes were handled with antistatic gloves, which is positioned in the fatigue testing machine and cleaned by spraying isopropyl alcohol (99.5%) prior to use.Linear dynamic fatigue testing machine
Rubber tubes were mounted on metal holders lined with rubber films on a home-made fatigue testing machine equipped with a variable frequency drive and an amplitude set to 100 mm, as schematically shown in Fig. 1a. The tube sample has a useful test length of 20 mm (Fig. 1b), stretching to a maximum of 600% from its initial useful length. The stretching frequency was set to 1 Hz, except when indicated otherwise (electrostatic maps and ESI†). Fatigue tests were performed under repeated loading to failure.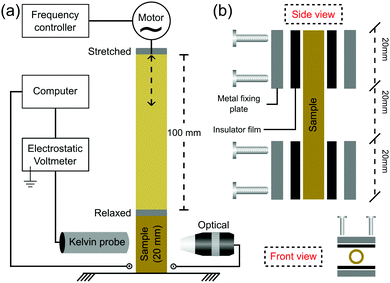 | ||
| Fig. 1 (a) Experimental setup used to measure the electric potential on periodically stretched rubbers and (b) the schematic description of the sample holder. | ||
Electrostatic potential measurements
Electrostatic potential measurements during repeated cyclic stretching were made with a low noise (3 mV), a high speed of response (3 ms) and a high-resolution (0.79 mm aperture size) Kelvin electrode (6000B-6, Trek Inc., USA) positioned at the center of the tubing surface and kept at 2 mm above it (Fig. 1a), as recommended by the manufacturer. The Kelvin electrode was connected to an electrostatic voltmeter (347, Trek Inc., USA), measuring the static potentials in the range of −3300 to +3300 V. The voltmeter output was connected to an electrometer (6514, Keithley, USA) via a low-noise triaxial cable under a high-speed acquisition rate of 120 readings s−1, using an USB-to-GPIB interface (KUSB-488b, Keithley, USA). The repeated cyclic stretching was performed only for the cleaned rubber specimens with low electrostatic potentials, down to 0 ± 2 V. The attractors from the electrostatic potential time series were plotted in two dimensions as V (t + Δt) vs. V (t) with a delay of Δt = 10 measured points (or 0.08 s), which was found as a convenient attractor for the data obtained in this study.Electrostatic potential maps were acquired by attaching the Kelvin electrode to a mechanical arm, where the rubber specimen was stretched to the desired position at a strain rate of 40 mm s−1. The temperature and relative humidity were continuously monitored using a digital thermohygrometer (Akrom KR420). All the experiments were conducted at 20–25 °C and 50–60% RH, where the samples were video recorded using a USB digital microscope (Decdeal).
Charge-density calculation
The surface charge density was estimated following a previously described procedure,20,38 where the virtual charges were placed on a 256 × 256-pixel matrix. The electrostatic potential generated by all the charges was calculated using the principle of superposition, where the number of charges per pixel is adjusted until the calculated and measured macroscopic electrostatic potentials match. The charge density was also confirmed using the solution to Poisson's equation for a uniform surface charge distribution in a circle.39Microscopy analysis of pristine and tested natural latex tubes
Atomic force microscopy (AFM) was performed using a Park NX10 microscope (Park Systems, Korea) equipped with SmartScan software version 1.0.RTM11a. Topography and phase-contrast images were obtained using a high-frequency rotated monolithic silicon probe (TAP300G, Budget Sensors, Bulgaria) with a nominal resonance frequency of 300 kHz and a force constant of 40 N m−1. All the measurements were made under ambient conditions at room temperature (21 ± 5 °C) and a relative humidity of 55 ± 10%. Images were treated offline using Park XEI software version 4.3.4Build22.RTM1.Scanning electron microscopy (SEM) was performed using a JSM6360 microscope (JEOL, USA) at 15 kV with 500× and 1000× magnifications.
Results and discussion
Elastomers display actual characteristic electromechanical coupling that is usually developed at larger deformations.35–37 Different from common crystalline (or semicrystalline) dielectrics, the stretched elastomers increase their surface area many-fold so that the strain-induced electrostatic charging built cannot be evaluated using compliant electrodes connected to amplifiers as it is commonly measured in flexoelectric and/or piezoelectric systems.40–43 The vibrating Kelvin electrode connected to an electrostatic voltmeter measures the electrostatic potential at the rubber surface due to the great advantage of its non-contact and non-destructive features. In addition, since the electric field between the capacitive probe and the testing surface is nullified (potential difference compensation), the presence of the instrument does not disturb the existing surface charge distribution, resulting in very low errors of the measurement.44 Thus, its configuration is highly suitable to measure the electrostatic response of rubbers subjected to large mechanical deformations.The macroscopic strain-induced electrostatic charging of natural latex is shown in Fig. 2a. Initially, the Kelvin electrode measures the electrostatic potential on the relaxed sample for approximately 30 s, following the stretching−relaxation cycles until the latex rupture. At the relaxed state, the Kelvin probe measures 0 V, but when latex is periodically pulled, the mechanical stimulus (strain gradient) is promptly transduced into the induced electrostatic potentials, reaching a negative potential of roughly −2.0 kV, as observed in the inset of Fig. 2a. Thus, quick discharging events are displayed on latex while returning to its unstrained relaxed position, reaching a close to zero electrostatic potential. In addition, the periodic quick charging and discharging events are produced in phase with a latex strain gradient until its rupture. In fact, periodic potentials appear irrespective of the oscillation frequency, but highly dependent on the strain gradient (see Fig. S1, ESI†). On the other hand, electrostatic potentials change quickly close to the latex fatigue, where regular and quasi-sinusoidal potentials are converted to much complex periodic waveforms, as shown in Fig. 2b.
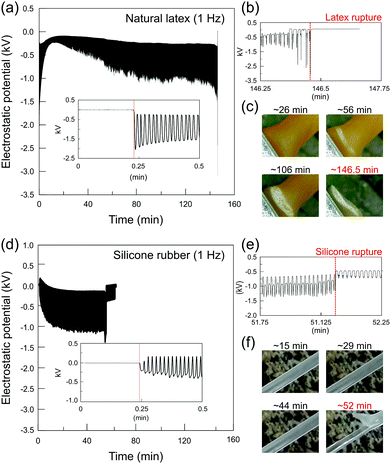 | ||
| Fig. 2 Representative plots of the electrostatic potential of (a) natural latex and (d) silicone rubber under stretching−relaxation cycles. The insets in (a) and (d) show the zoom-in plots at the beginning, while (b) and (e) are the zoom-in plots close to the rupture of the latex and silicone, respectively. Optical images for (c) latex and (f) silicone during the course of the experiment are shown along with the respective electrostatic potentials. For additional experiments, see Fig. S1 (ESI†). | ||
As observed in Fig. 2c, cyclic stretching–relaxation induces mechanochemical reactions on latex that undergoes physical–chemical transformations upon testing, acquiring a whitish color close to the region surrounding the rupture. Moreover, an important observation regarding the experiments using natural latex specimens is that the rupture always takes place in the same region, which is close to the stationary holder as observed in Fig. 1. As observed in Fig. 2, periodic potentials decrease slowly towards negative values and higher potential amplitudes are normally reached after crack propagation, but there is no direct correlation between electrostatic potentials and crack size (Fig. S2, ESI†). In fact, crack initiation is strongly related to macroscopic quantities such as stress or strain45–47 and the stationary holder concentrates higher strain gradients during the stretching experiments of natural latex (Fig. S9, ESI†).
Although the potentials on silicone rubber are not reproduced in detail, the patterns of both the elastomers share important common features. As observed in the inset graph of Fig. 2d, silicone rubber initially displays the positive and negative charges that build up which are also in phase with mechanical deformations, but the potentials move gradually to negative signals only. Compared with natural latex, sharper electrostatic potential peaks are observed in silicone rubber, which indicates that the electromechanical coupling of elastomers is dependent on and susceptible to their physical–chemical properties. Again, as shown in Fig. 2e, complex periodic waveforms are displayed close to specimen rupture, but differently from natural latex, the rupture site in silicone rubber is randomly distributed along the sample surface (Fig. 2f). In addition, silicone rubber does not undergo visual transformations such as whitish regions and/or clear signals of topographical defects any time before the rupture. In fact, many elastomers such as silicone rubber have a self-healing ability,48 further complicating the determination of the fatigue failure point.
The electromechanical coupling in rubbers has an important feature that cannot be explained only within the framework of flexoelectricity: the dependency on the relative humidity. In fact, the charge build up and dissipation in rubber materials can decrease to roughly 90% under dry conditions.35 In addition, natural latex and silicone rubber undergo important mechanochemical reactions under stress. Thus, hygroelectric potentials and contributions from mechanochemical reactions37 are important sources of charge build up in rubbers during periodic stretching. On the other hand, since rubbers display a quasi-linear relationship between the strain gradient and the electric response,44,49 flexoelectric potentials must also play a certain role on elastomers during deformation by breaking the inversion symmetry of polymer chains. Moreover, the strain-induced electrostatic potential of elastomers can have a dominating effect on triboelectrification, reversing the direction of charge transfer in contact charging.50
The surface charge density on natural latex or silicone rubber can be estimated from the macroscopic electrostatic potentials. For example, the excess charge that account for −1000 V observed with a Kelvin electrode in Fig. 2 is in the range of 700 electron charge units μm−2. Considering the volumes of the specimens, the surface charge density is converted to 0.07 charge units μm−3. Thus, it is possible to conclude that the net charge of rubber phases are due to small amounts of charge carriers, which are difficult to be detected chemically, even by sensitive surface analytical techniques.
Despite the mechanisms, the identification of dominant effects or the determination of charge carriers, rubbers make non-stop electromechanical couplings throughout their lifetime.37 In fact, both natural latex and silicone rubber undergo transformations that modify the mechanical-to-electrical transduction close to the rupture. On the other hand, since the strain-induced behavior of rubbers has important particularities, the identification of any peculiar change on the electrostatic behavior can be a challenging task even for trained electrostatic scientists. Thus, how can we extract information from electrostatic potentials to predict if rubber is about to undergo rupture?
Periodically stretched rubber is a dynamical system. This means that the electromechanical coupling (and other properties) changes with time, although only probabilities can be given for the prediction of rubber fatigue failure. Dissipative dynamical systems have motivated the development of many theories, but non-linear terms can lead to instability of a system (stochastic dynamics).51 Attractors play a major role in the study of the limit regimes of the dynamical dissipative systems. An attractor is a set of numerical values within a phase plane, which can appropriately represent the evolution of a non-linear dissipative dynamic system.52
Fig. 3 and 4 show the electrostatic potentials on the periodically stretched natural latex at different time intervals presented with the respective attractors (see also Fig. S3 and S4 for potentials and attractors of rubber at different oscillation frequencies, ESI†). Although only a minor difference is observed on the electrostatic potential profiles of both natural latex and silicone rubber, this slight difference is highlighted in the attractors. At the beginning of the stretching–relaxation cycles (Fig. 3a, b and 4a, b), the electrostatic potentials on latex and silicone display very well-defined attractors, keeping their overall shape for most of the time during the course of the experiment (Fig. 3c, d and 4c, d). The attractors from latex and silicone have differences among them that are related to the electrostatic response during mechanical-to-electrical transduction, as shown in Fig. 2. On the other hand, the attractors on natural latex change quickly at roughly 50 seconds before its rupture (Fig. 3e and f), while the outcome of further cyclic tests is chaotic attractors (Fig. 3e and f), indicating that nearby orbits diverge exponentially from one another with time53 (see also Fig. S7 and S8, ESI†). Silicone rubber has a similar behavior (Fig. 4e and f), but the attractors retain the initial pattern even 80 seconds before its rupture. Instead, roughly 60 seconds before silicone rubber fatigue failure, the attractors show a chaotic pattern which is observed until complete rupture (Fig. 3e and f).
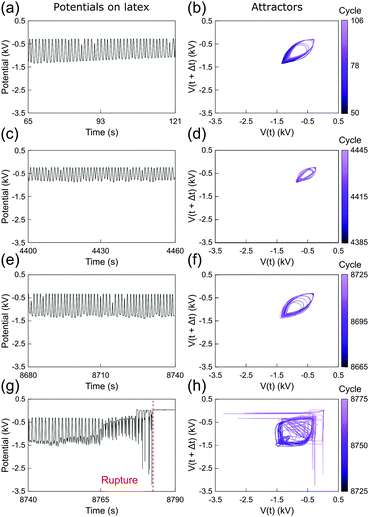 | ||
| Fig. 3 (a, c, e and g) Sections of the recorded time series of the electrostatic potential of the periodically stretched natural latex and (b, d, f and h) the respective attractors. See also Fig. S3 and S5 (ESI†). | ||
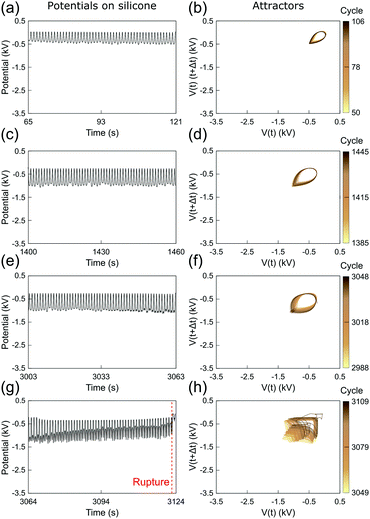 | ||
| Fig. 4 (a, c, e and g) Sections of the recorded time series of the electrostatic potential of the periodically stretched silicone rubber and (b, d, f and h) the respective attractors. See also Fig. S4 and S6 (ESI†). | ||
The attractors from the electrostatic potential measurements offer an accurate way to predict rubber fatigue failure, with a good safe margin of roughly 60 seconds before complete rupture. In fact, this approach and extended ones using induced or attached electrodes can find many real-world applications for online monitoring of rubber parts. On the other hand, whereas natural latex undergoes visual transformations due to the mechanochemical action in the region surrounding the rupture, silicone rubber has an intrinsic unpredictability regarding the exact location of the rupture. Thus, another relevant question arises from these observations: are the electrostatic potentials by any means correlated to the point of the rupture?
Rubbers electrification has never been an easy problem in electrostatics as rubbers are noted for being absent from the most published triboelectric series.54 In addition, even flexoelectric mechanisms in elastomers are much more complex than those in crystalline solids.55 On the other hand, electrostatic potential mappings at micro30 and/or macro20,22 scales have emerged as a powerful tool in electrostatics by explaining old paradigms substituting them for new concepts.18 In addition, the Kelvin electrode setup was recently used to acquire the electrostatic potential maps on natural latex, where the specimen displays a non-homogeneous charge distribution under stretching.44
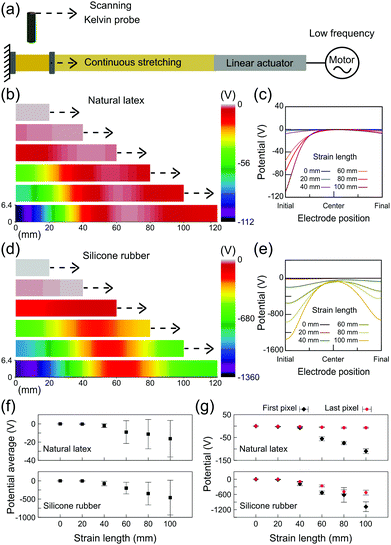
The electrostatic potential maps on the relaxed and stretched rubbers were obtained as schematically shown in Fig. 5a. Rubber tubes were scanned using a Kelvin probe setup at different fixed positions of stretching. Fig. 5b shows a representative potential map on natural latex along with the respective line profiles (Fig. 5c). The electrostatic potentials close to zero are found on relaxed latex, but negative potentials are displayed after stretching primarily close to the stationary holder, reaching −100 V in some spots although preserving low potentials near the moving holder of the testing machine. On the other hand, charge build up in silicone rubber reaches lower potentials and is far more distributed along the specimen (Fig. 5d). In fact, the electrostatic potential line profiles for silicone (Fig. 5e) show that the regions close to the stationary holder still have more negative potentials (as low as −1000 V), but the charge is also built up on many pixels along the sample. In addition, the error bars for the potential average (Fig. 5f) highlight the importance of electrostatic mapping on the study of electromechanical coupling. Since the charge is heterogeneously distributed along the stretched rubber, fixed and/or compliant electrodes connected to amplifiers would result in measurements far from representing the occurrence of potentials on the rubber surface during stretching. Finally, as shown in Fig. 5g, the potentials on the first and the last pixels describe a linear relationship between the strain gradient and the electric response, but after a stretching of 40 mm.
The results shown in Fig. 5 are timely: both natural latex and silicone rubber display a non-homogeneous charge distribution under stretching; although the charge build up in latex is highly localized, silicone rubber has the ability to distribute the charge carriers. The dissipation of charges built-up during cyclic deformation was long time ago related to the longer life of vulcanized rubbers,24 but no explanation has emerged since then.9 Here, we have shown that the electrostatic potentials are clearly interconnected to the local of the rupture on latex. In addition, since the electrostatic maps on silicone rubber displayed charged regions much more distributed along the specimen, the results help in understanding the unpredictability of the exact location of rupture events on silicone rubber. Moreover, as observed in the DIC results of the ESI† (Fig. S9), the strain gradients on natural latex and silicone rubber are strictly related to the electrostatic potentials measured using the Kelvin probe.
Mechanochemical reactions are far more evident on natural latex than on silicone rubber. In fact, as observed in the optical images of Fig. 2c and f, latex changes its color but no apparent modification is observed for silicone. Fig. 6 shows SEM micrographs of natural latex and silicone rubber before and after periodic stretching (see also Fig. S10 ESI,† for the AFM images of latex). Pristine rubbers have very smooth surfaces, but a remarkable difference is observed after the fatigue failure: natural latex is highly fragmented while silicone rubber still preserves most of its original morphology. Moreover, the mechanochemical action during stretching is not only related to complex micro- and nanomorphology transformations but is also responsible for novel oxidative chemical groups.37
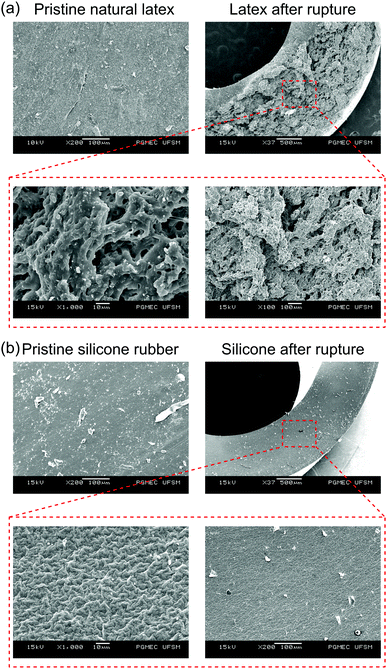 | ||
| Fig. 6 SEM micrographs of the (a) natural latex and (b) silicone rubber before and after fatigue tests at different magnifications. | ||
Conclusions
Mechanical-to-electrical transduction on the natural latex and silicone rubber receives essential contributions from their physical–chemical properties. Mechanochemical reactions take place during the stretching–relaxation cycles and affect the electromechanical coupling of elastomers. Consequently, the electrostatic potential profiles change slightly during each experimental run, but the respective attractors change wildly shortly before fatigue failure. Electrostatic potential monitoring can thus anticipate and estimate the location of rupture events as shown in the potential maps. Thus, the approach described in this work may provide real-world applications for the prediction of rubber fatigue failure, contributing to accident prevention and maintenance practices.Author contributions
Y. A. S. da Campo and D. Mehler contributed to the experimental work, data treatment and the discussion of results. K. S. Moreira, A. L. Devens and E. Lorenzett contributed to the electrostatic potential maps, microscopy and data treatment. L. P. dos Santos and F. Galembeck participated in the experimental design, discussion, interpretation and revision of the paper. T. A. L. Burgo is the group leader, who participated in the experimental design and some experiments, discussion, interpretation and writing.Conflicts of interest
There are no conflicts to declare.Acknowledgements
This work was supported by the Brazilian agencies MCTIC/CNPq (465452/2014-0), FAPESP (2014/50906-9) and Coordenação de Aperfeiçoamento de Pessoal de Nível Superior – Brasil (CAPES) – Finance Code 001 through the INCT/INOMAT (National Institute for Complex Functional Materials), EMU/FAPESP 2009/54066-7 and MCT/Finep/CT-Infra 02/2010. LPS acknowledges the CAPES (88887.284776/2018-00) for a postdoctoral fellowship and the Fapesp 2019/04565-9 for a research fellowship. KSM acknowledges the CAPES (No. 88887.480279/2020-00) for a doctoral degree fellowship. This work is currently also supported by the FAPESP PIPE project 2018/00834-2. The authors acknowledge Natália F. Daudt from the Mechanical Engineering Department (UFSM) for SEM analysis.References
- R. P. Brown, Rubber Product Failure (Rapra Review Reports), Smithers Rapra Press, Shawbury, 2002 Search PubMed.
- H. M. Reis and J. Golko, KGK Kautsch. Gummi Kunstst., 2000, 53, 694 Search PubMed.
- M. M. Rippel, C. A. P. Leite and F. Galembeck, Anal. Chem., 2002, 74, 2541 Search PubMed.
- M. M. Rippel, C. A. P. Leite, L.-T. Lee and F. Galembeck, Colloid Polym. Sci., 2005, 283, 570 Search PubMed.
- L. F. Valadares, E. M. Linares, F. C. Bragança and F. Galembeck, J. Phys. Chem. C, 2008, 112, 8534 Search PubMed.
- M. M. Rippel, E. M. Linares, F. C. Bragança, L. F. Valadares and F. Galembeck, J. Adhes. Sci. Technol., 2012, 26, 767 Search PubMed.
- D. Ehrhardt, KGK, Kautsch. Gummi Kunstst., 1999, 52, 109 Search PubMed.
- J. R. Beatty, Fatigue of Rubber, Rubber Chem. Technol., 1964, 37, 1341–1364 Search PubMed.
- W. V. Mars and A. Fatemi, Rubber Chem. Technol., 2004, 77, 391 Search PubMed.
- S. M. Cadwell, R. A. Merrill, C. M. Sloman and F. L. Yost, Ind. Eng. Chem. - Anal. Ed., 1940, 12, 19 Search PubMed.
- W.-H. Chuang, R. K. Fettig and R. Ghodssi, Sens. Actuators, A, 2005, 121, 557 Search PubMed.
- L. Chevalier, S. Calloch, F. Hild and Y. Marco, Eur. J. Mech. A: Solids, 2001, 20, 169 Search PubMed.
- R. Zhang, Appl. Mech. Mater., 2014, 444–445, 1532 Search PubMed.
- L. Meunier, G. Chagnon, D. Favier, L. Orgéas and P. Vacher, Polym. Test., 2008, 27, 76 Search PubMed.
- L. C. S. Nunes, Mater. Des., 2010, 31, 583 Search PubMed.
- J. B. Pascual-Francisco, L. I. Farfan-Cabrera and O. Susarrey-Huerta, Polym. Test., 2020, 81, 106226 Search PubMed.
- M. Bornert, F. Brémand, P. Doumalin, J.-C. Dupré, M. Fazzini, M. Grédiac, F. Hild, S. Mistou, J. Molimard, J.-J. Orteu, L. Robert, Y. Surrel, P. Vacher and B. Wattrisse, Exp. Mech., 2009, 49, 353 Search PubMed.
- F. Galembeck and T. A. L. Burgo, Chemical Electrostatics, Springer, Cham, 2017 Search PubMed.
- D. J. Lacks and R. M. Sankaran, J. Phys. D: Appl. Phys., 2011, 44, 453001 Search PubMed.
- T. A. L. Burgo, T. R. D. Ducati, K. R. Francisco, K. J. Clinckspoor, F. Galembeck and S. E. Galembeck, Langmuir, 2012, 28, 7407 Search PubMed.
- F. Galembeck, T. A. L. Burgo, L. B. S. Balestrin, R. F. Gouveia, C. A. Silva and A. Galembeck, RSC Adv., 2014, 4, 64280 Search PubMed.
- K. S. Moreira, D. Lermen, Y. A. S. da Campo, L. O. Ferreira and T. A. L. Burgo, Adv. Mater. Interfaces, 2020, 7, 2000884 Search PubMed.
- A. T. McPherson, Rubber Chem. Technol., 1963, 36, 1230 Search PubMed.
- B. A. Dogadkin, V. E. Gul and N. A. Morozova, Rubber Chem. Technol., 1960, 33, 970 Search PubMed.
- L. B. Schein, Science, 2007, 316, 1572 Search PubMed.
- L. S. McCarty and G. M. Whitesides, Angew. Chem., Int. Ed., 2008, 47, 2188 Search PubMed.
- C. Liu and A. J. Bard, J. Am. Chem. Soc., 2009, 6397–6401 Search PubMed.
- D. J. Lacks and T. Shinbrot, Nat. Rev. Chem., 2019, 3, 465 Search PubMed.
- Z. L. Wang and A. C. Wang, Mater. Today, 2019, 30, 34 Search PubMed.
- H. T. Baytekin, A. Z. Patashinski, M. Branicki, B. Baytekin, S. Soh and B. A. Grzybowski, Science, 2011, 333, 308 Search PubMed.
- R. Budakian and S. J. Putterman, Phys. Rev. Lett., 2000, 85, 1000 Search PubMed.
- J. V. Escobar, A. Chakravarty and S. J. Putterman, Diamond Relat. Mater., 2013, 36, 8–15 Search PubMed.
- T. A. L. Burgo and A. Erdemir, Angew. Chem., Int. Ed., 2014, 53, 12101 Search PubMed.
- T. A. L. Burgo, F. Galembeck and G. H. Pollack, J. Electrostat., 2016, 80, 30 Search PubMed.
- T. A. L. Burgo, B. C. Batista and F. Galembeck, ACS Omega, 2017, 2, 8940 Search PubMed.
- L. P. Santos, Y. A. Campo, D. S. da Silva, T. A. L. Burgo and F. Galembeck, Colloids Interfaces, 2018, 2, 55 Search PubMed.
- L. P. Santos, D. S. da Silva, B. C. Batista, K. S. Moreira, T. A. L. Burgo and F. Galembeck, Polymer, 2019, 171, 173 Search PubMed.
- T. A. L. Burgo, C. A. Rezende, S. Bertazzo, A. Galembeck and F. Galembeck, J. Electrostat., 2011, 69, 401 Search PubMed.
- V. T. C. Paiva, L. P. Santos, D. S. da Silva, T. A. L. Burgo and F. Galembeck, Langmuir, 2019, 35, 7703 Search PubMed.
- X. Jiang, W. Huang and S. Zhang, Nano Energy, 2013, 2, 1079 Search PubMed.
- V. I. Merupo, B. Guiffard, R. Seveno, M. Tabellout and A. Kassiba, J. Appl. Phys., 2017, 122, 144101 Search PubMed.
- S. Huang, T. Kim, D. Hou, D. Cann, J. L. Jones and X. Jiang, Appl. Phys. Lett., 2017, 110, 222904 Search PubMed.
- S. Huang, L. Qi, W. Huang, L. Shu, S. Zhou and X. Jiang, J. Adv. Dielectr., 2018, 8, 1830002 Search PubMed.
- E. Lorenzett, K. S. Moreira, Y. A. Santos da Campo, D. Mehler, A. L. Devens, M. A. Noras and T. A. L. Burgo, J. Appl. Phys., 2021, 129, 204502 Search PubMed.
- K. Legorju-Jago and C. Bathias, Int. J. Fatigue, 2002, 24, 85 Search PubMed.
- W. V. Mars and A. Fatemi, J. Mater. Sci., 2006, 41, 7324 Search PubMed.
- J. Choi, L. Quagliato, S. Lee, J. Shin and N. Kim, Int. J. Fatigue, 2021, 145, 106136 Search PubMed.
- Q. Shen, H. Liu, Y. Peng, J. Zheng and J. Wu, Polym. Chem., 2021, 12, 494 Search PubMed.
- K. S. Moreira, E. Lorenzett, A. L. Devens, Y. A. Santos da Campo, D. Mehler and T. A. L. Burgo, J. Appl. Phys., 2021, 129, 234502 Search PubMed.
- M. Sow, R. Widenor, A. Kumar, S. W. Lee, D. J. Lacks and R. M. Sankaran, Angew. Chem., Int. Ed., 2012, 51, 2695 Search PubMed.
- W. Demtröder, Mechanics and Thermodynamics, Springer, Cham, 2017 Search PubMed.
- E. N. Lorenz, J. Atmos. Sci., 1963, 20, 130–141 Search PubMed.
- C. Grebogi, E. Ott, S. Pelikan and J. A. Yorke, Phys. D, 1984, 13, 261 Search PubMed.
- A. F. Diaz and R. M. Felix-Navarro, J. Electrostat., 2004, 62, 277 Search PubMed.
- S. Baskaran, X. He, Q. Chen and J. Y. Fu, Appl. Phys. Lett., 2011, 98, 1 Search PubMed.
Footnote |
| † Electronic supplementary information (ESI) available. See DOI: 10.1039/d1cp02442f |
| This journal is © the Owner Societies 2021 |


