 Open Access Article
Creative Commons Attribution 3.0 Unported Licence
Rovibronic spectroscopy of PN from first principles†
Mikhail
Semenov
 ab,
Nayla
El-Kork
 c,
Sergei N.
Yurchenko
 *a and
Jonathan
Tennyson
 a
a
aDepartment of Physics and Astronomy, University College London, Gower Street, WC1E 6BT London, UK. E-mail: s.yurchenko@ucl.ac.uk
bDepartment of Science and Research, Moscow Witte University, 2nd Kozhukhovskiy Passage, Moscow, Russian Federation
cDepartment of Physics, Khalifa University, Abu Dhabi, United Arab Emirates
First published on 20th September 2021
Abstract
We report an ab initio study on the rovibronic spectroscopy of the closed-shell diatomic molecule phosphorous mononitride, PN. The study considers the nine lowest electronic states, X 1Σ+, A 1Π, C 1Σ−, D 1Δ, E 1Σ−, a 3Σ+, b 3Π, d 3Δ and e 3Σ− using high level electronic structure theory and accurate nuclear motion calculations. The ab initio data cover 9 potential energy, 14 spin–orbit coupling, 7 electronic angular momentum coupling, 9 electric dipole moment and 8 transition dipole moment curves. The Duo nuclear motion program is used to solve the coupled nuclear motion Schrödinger equations for these nine electronic states and to simulate rovibronic absorption spectra of 31P14N for different temperatures, which are compared to available spectroscopic studies. Lifetimes for all states are calculated and compared to previous results from the literature. The calculated lifetime of the A1Π state shows good agreement with an experimental value from the literature, which is an important quality indicator for the ab initio A–X transition dipole moment.
1 Introduction
Phosphorus is considered to be one of the key elements as a source of life and replication on our planet,1,2 with PN being one of the candidates in star and meteorite evolution to provide the necessary life building material. There have been multiple observations of PN in different media in space: hot dense molecular clouds,3,4 energetic star forming regions,5,6 cold cloud cores,5,7 red giant stars8–10 and protoplanetary nebula.8 Regardless of high astrophysical and astrobilogical importance, phosphorous mononitride is one of the experimentally least-well studied diatomic molecules of its isoelectronic group (P2, SiO, N2, CS).The molecule was reported for the first time by Curry et al.11 using a spectroscopic study. Many other subsequent spectroscopic studies have taken place including photoelectron,12 fluorescence,13 matrix infrared,14 microwave15–17 and Fourier Transform Infra-Red (FTIR).18 Most of the high resolution spectroscopy experiments with PN concentrated on the electronic system A 1Π–X 1Σ+,11,13,19–21 with E 1Σ+–X 1Σ+ being confirmed afterwards,22–24 and several valence and Rydberg states have been studied as well.25,26
Measured lifetimes can be important indicators of intensities and Einstein A coefficients. So far only one experimental work reports lifetime measurements for the A 1Π state of PN molecule27 using Hanle effect, with several ab initio works providing computed values for PN lifetimes.28,29
The mass spectrometric experiment by Gingeric30 reports PN's dissociation energy D0 to be 6.35 ± 0.22 eV, which is lower than experimental D0 values by Huffman et al.31 and Uy et al.,32 7.1 ± 0.05 eV and 7.57 ± 0.03 eV, respectively. In a combination of a high-level ab initio and microwave spectroscopy study, Cazzoli et al.17 suggested a D0 value of 6.27 eV. This is close both to the originally predicted value by Curry et al.33 and to the experimental value of Gingeric.30
Several theoretical investigations of PN are available in the literature. The most recent was carried out by Qin et al.29 who reported spectroscopic constants for the lowest five singlet (X 1Σ+, A 1Π, D 1Δ, C 1Σ−, 2 1Π), six triplet (including a 3Σ+, b 3Π, d 3Δ, e 3Σ−) and two quintet electronic states of PN. In that paper all the states were studied at the internally contracted multi-reference configuration interaction (icMRCI) level of theory with Davidson correction (+Q). Similarly, Abbiche et al.34 reported an ab initio study of seven states of PN, X 1Σ+, A 1Π, D 1Δ, C 1Σ−, 2 1Π, E 1Σ+, 3 1Σ+, as well as of 10 triplet and 3 quintet electronic states. The main purpose of their study was to interpret perturbation and predissociation effects in the observed transitions.
In this work we present a comprehensive ab initio spectroscopic model for the nine lowest electronic states of phosphorous mononitride, X 1Σ+, A 1Π, C 1Σ−, D 1Δ, E 1Σ+, a 3Σ+, b 3Π, d 3Δ, e 3Σ−, consisting of potential energy curves (PECs), transition dipole moments curves (TDMCs), spin–orbit coupling curves (SOCs) and angular momentum coupling curves (AMCs) using the icMRCI + Q method and calculate the rovibronic energies and transition probabilities as an ab initio line list for PN. Producing such line lists for molecules of astrophysical significance is one of the main objectives of the ExoMol project.35 These curves, with some simple adjustment of the minimum energies of the PECs, are used to solve the coupled nuclear-motion Schrödinger equation with the program Duo.36 The spectroscopic model and ab initio curves are provided as part of the supplementary material. Our open source code Duo can be accessed viahttp://exomol.com/software/. The results of Duo calculation are then used to generate rovibronic spectra of PN and compare to systems previously reported in the literature.
2 Computational details
2.1 Ab initio calculations
Using MOLPRO 2020,37ab initio calculations were performed for nine low-lying electronic states of PN. Apart from PECs, we also computed (T)DMCs, SOCs and EAMCs. For the ab initio calculations we used the icMRCI method38 in conjunction with the effective-core-potential (ECP) method ECP10MWB (Stuttgart/Cologne) for phosphorus39 and aug-cc-pCV5Z40 basis set for nitrogen. The initial complete active space self-consistent field (CASSCF) calculation over which the configuration interaction calculations were built was for the X 1Σ+ state only. In conjunction with ECP for phosphorus, the active space was selected to be (6,2,2,0) with (1,0,0,0) closed orbitals. The state averaging set contained 96 states: 24, 24, 24 and 24 states of the singlets, triplets, pentets and septets. This level of theory will be referenced to as icMRCI + Q/ECP10MWB.The calculations of the spin–orbit couplings were too difficult to perform for the icMRCI + Q/ECP10MWB level of theory, taking too long to complete and producing wrong data. We therefore decided to use a non-ECP level of theory for our spin–orbit calculations. To this end, we selected the ab initio level of theory similar to that used by Qin et al.29 with an active space of (9,3,3,0). In this case the state averaging set consisted of 11 singlet configurations (4A1, 2B1, 2B2 and 3A2). The Douglass–Kroll correction was taken into account with or without core-valence correlation. These levels of theory will be referenced to as icMRCI/aug-cc-pV5Z(-DK) and icMRCI/aug-cc-pWCV5Z(-DK), respectively, with or without DK.
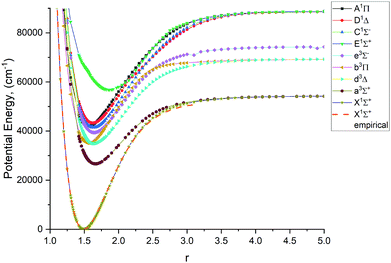
Fig. 1–4 show all PECs, SOCs, EAMSc and (T)DMCs generated in this study. If the MOLPRO calculations at some geometries did not converge, they were interpolated or extrapolated from the surrounding points as part of the Duo calculations (see below). We used an adaptive ab initio grid consisting of 150 bond lengths ranging from 0.7 to 8 Å with more points around the equilibrium region. The grid points with the corresponding ab initio values (if converged) are included in the supplementary material and also shown in Fig. 1–4. The icMRCI/aug-cc-pV5Z(-DK) calculations have only converged up to about 3.5 Å due to a smaller number of configurations in the internally contacted reference set used.
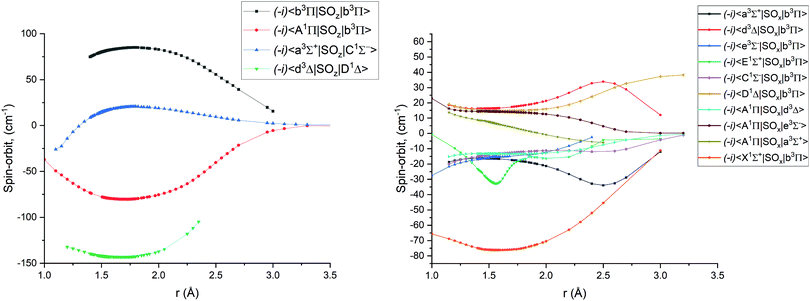 | ||
| Fig. 2 Ab initio spin–orbit matrix elements 〈i|SOx|j〉 for PN at the icMRCI/aug-cc-pV5Z-DK level of theory. The MOLPRO values of the magnetic quantum numbers mS for the curves can be found in Table 2. | ||
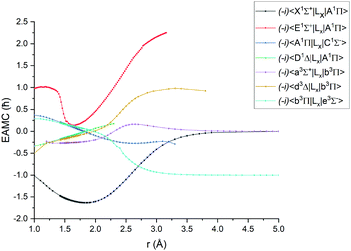 | ||
| Fig. 3 Ab initio (icMRCI + Q/ECP10MWB) electronic angular momentum couplings for PN in the units of ħ. | ||
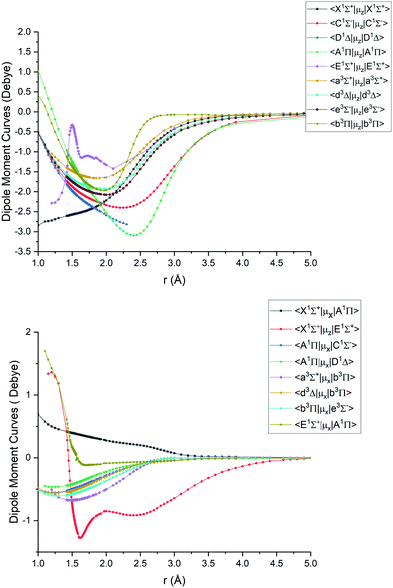 | ||
| Fig. 4 Ab initio (icMRCI + Q/ECP10MWB) dipole moment curves for PN: diagonal (upper), off-diagonal (lower). | ||
2.2 Duo calculations
We use the program Duo36,43 to solve the coupled Schrödinger equation for 9 lowest electronic states of PN. Duo is a variational program capable of solving rovibronic problems for a general (open-shell) diatomic molecule with an arbitrary number of couplings, see, for example, ref. 44–47. All ab initio couplings between these 9 states are taken into account as described below. The goal of this paper is to build a comprehensive ab initio spectroscopic model for this electronic system of PN based on the icMRCI + Q/ECP10MWB and icMRCI/aug-cc-pV5Z-DK ab initio curves. We therefore do not attempt a systematic refinement of the ab initio curves by fitting to the experiment, which will be the subject of future work. In order to facilitate the comparison with the experimental data, we, however, perform some shifts of the equilibrium energy Te and bond length re values, as described in further detail below.In Duo calculations, the coupled Schrödinger equations are solved on an equidistant grid of points, in our case 501, with bond lengths ri ranging from r = 0.85 to 5 Å using the sinc DVR method.48 Our ab initio curves are represented by sparser and less extended grids (see above). For the bond length values ri overlapping with the ab initio ranges, the ab initio curves were projected onto the denser Duo grid using the cubic spline interpolation.
The following functional forms were used for extrapolation outside the original ab initio range:36
| fshortPEC(r) = A + B/r, |
| fshortTDMC(r) = Ar + Br2, |
| fshortother(r) = A + Br, | (1) |
| flongPEC(r) = A + B/r6 |
| flongEAMC(r) = A + Br, |
| flongother(r) = A/r2 + B/r3 | (2) |
The vibrational basis set was taken as eigensolutions of the nine uncoupled 1D problems for each PEC. The corresponding basis set constructed from 9 × 501 eigenfunctions was then contracted to include about 60–80 vibrational functions from each state, enough to fill the PEC up to the corresponding dissociation energies. This gives a total of 640 states. These vibrational basis functions were then combined with the spherical harmonics for the rotational and electronic spin basis set functions. All calculations were performed for 31P14N using atomic masses.
3 Results and discussion
3.1 Results of ab initio calculations
The lowest 9 singlet and triplet PECs (X 1Σ+, A 1Π, C 1Σ−, D 1Δ, E 1Σ+, a 3Σ+, b 3Π, d 3Δ, e 3Σ−) calculated at the icMRCI + Q/ECP10MWB level and are shown in Fig. 1. Table 1 presents spectroscopic constants for these states estimated using the corresponding (spin–orbit-free) PECs and compares to previous studies.17,19,29,33,34,41,42 These values agree well for the states X 1Σ+, C 1Σ− D 1Δ, E 1Σ+, a 3Σ+, e 3Σ−, b 3Π, d 3Δ as estimated using the corresponding (spin–orbit-free) PECs. For the E 1Σ+ state, however we note that there are very few studies of that state, so further computational investigation is potentially required. For the A 1Π state, the Te value (the equilibrium electronic energy relative to the minimum value of X1Σ+) is by about 2300 cm−1 larger than previous experimental and ab initio values, which in turn affects the De value. We consider this to be an effect of the ECP method used in the ab initio calculations and we note that there is a similar magnitude shift in Te of all other states.| State | D e | T e | r e | ω e | B e | |
|---|---|---|---|---|---|---|
| X1Σ+ | This work | 53100.00 | 0.00 | 1.49 | 1303.23 | 0.78 |
| Expt.33 | 50812.91 | 0.00 | 1.4869 | 1337.24 | 0.78549 | |
| Expt.17 | 51938.86 | 0.00 | 1336.992 | 0.78648 | ||
| Calc29 | 51454.07 | 0.00 | 1.4918 | 1339.61 | 0.78549 | |
| Calc.41 | 50645.15 | 0.00 | 1.4948 | 1333.84 | 0.7823 | |
| Calc.34 | 49683.73 | 0.00 | 1.4977 | 1328.21 | 0.77872 | |
| A1Π | This work | 44900.00 | 42143.66 | 1.56 | 1041.07 | 0.71 |
| Expt.33 | 41134.26 | 39688.52 | 1.5424 | 1103.09 | 0.73071 | |
| Expt.19 | 39805.90 | 1103 | 0.731 | |||
| Calc29 | 40995.53 | 40032.55 | 1.5476 | 1104.81 | 0.7306 | |
| Calc.41 | 41331.86 | 1.5501 | 1100.24 | 0.727505 | ||
| Calc.34 | 40624.26 | 40610.00 | 1.556 | 1078.42 | 0.7213 | |
| D1Δ | This work | 43100.07 | 43287.03 | 1.63 | 1016.44 | 0.66 |
| Calc.29 | 39993.49 | 42106.86 | 1.6073 | 1018.98 | 0.67724 | |
| Calc.42 | 33713.96 | 41618.19 | 1.622 | 967.9 | 0.664 | |
| Calc.34 | 39448.89 | 41835.96 | 1.614 | 1010.647 | 0.671 | |
| Calc.41 | 41555.28 | 1.6196 | 1002.269 | 0.665056 | ||
| C1Σ− | This work | 45300.00 | 41417.18 | 1.63 | 998.65 | 0.66 |
| Calc.29 | 42766.02 | 39298.72 | 1.6211 | 977.5 | 0.6639 | |
| Calc.42 | 37827.38 | 37504.77 | 1.617 | 1108.8 | 0.669 | |
| Calc.34 | 41852.09 | 39505.02 | 1.627 | 973.927 | 0.6597 | |
| E1Σ+ | This work | 30200.00 | 56793.82 | 1.86 | 702.48 | 0.50 |
| Calc.34 | 26188.80 | 55103.80 | 1.889 | 743.74 | 0.4893 | |
| a3Σ+ | This work | 26600.62 | 26632.70 | 1.66 | 917.51 | 0.63 |
| Calc.29 | 25249.32 | 26065.66 | 1.6481 | 941.61 | 0.64253 | |
| Calc.42 | 19599.26 | 24761.21 | 1.669 | 787.4 | 0.628 | |
| Calc.34 | 23785.28 | 25817.80 | 1.655 | 913.765 | 0.6375 | |
| e3Σ− | This work | 32670.00 | 39370.41 | 1.64 | 974.15 | 0.65 |
| Calc.29 | 32081.01 | 37951.02 | 1.624 | 981.37 | 0.66149 | |
| Calc.42 | 37827.39 | 37504.77 | 1.617 | 1108.8 | 0.669 | |
| Calc.34 | 30665.19 | 37956.44 | 1.632 | 982.255 | 0.6556 | |
| d3Δ | This work | 33300.00 | 34860.41 | 1.65 | 960.01 | 0.65 |
| Calc.29 | 29679.37 | 32975.56 | 1.6324 | 949.99 | 0.65376 | |
| Calc.42 | 23551.38 | 32504.13 | 1.666 | 770.3 | 0.629 | |
| Calc.34 | 28471.36 | 33125.18 | 1.64 | 959.263 | 0.6495 | |
| b3Π | This work | 33400.00 | 35146.16 | 1.56 | 1070.81 | 0.71 |
| Calc.29 | 29197.77 | 33671.79 | 1.5449 | 1113.24 | 0.73301 | |
| Calc.42 | 21696.31 | 34359.20 | 1.558 | 1124.3 | 0.72 | |
| Calc.34 | 27672.87 | 33843.01 | 1.555 | 1102.494 | 0.7224 |
| SOC | Bra mS | Ket mS |
|---|---|---|
| 〈A1Πy|SOx|d3Δxy〉 | 0 | 1 |
| 〈A1Πy|SOx|e3Σ−〉 | 0 | 1 |
| 〈a3Σ+|SOx|b3Πy〉 | 0 | 1 |
| 〈a3Σ+|SOx|A1Πy〉 | 1 | 0 |
| 〈d3Δxy|SOx|b3Πy〉 | 0 | 1 |
| 〈e3Σ−|SOx|b3Πx〉 | 0 | 1 |
| 〈X1Σ+|SOx|b3Πy〉 | 0 | 1 |
| 〈E1Σ+|SOx|b3Πy〉 | 0 | 1 |
| 〈C1Σ−|SOx|b3Πy〉 | 0 | 1 |
| 〈D1Δz|SOx|b3Πx〉 | 0 | 1 |
| 〈b3Πx|SOz|b3Πx〉 | 1 | 1 |
| 〈A1Πx|SOz|b3Πx〉 | 0 | 0 |
| 〈a3Σ+|SOz|C1Σ−〉 | 0 | 0 |
| 〈d3Δz|SOz|D1Δz〉 | 0 | 0 |
The ab initio SOCs, EAMCs and (T)DMCs are shown in Fig. 2–4 respectively, with their phases indicated and the reference distance for phases taken as 1.5 Å. For all these curves the post-processing of ab initio calculations included (i) inter- and extrapolations for the missing points using neighboring geometries and (ii) phase mapping using a procedure similar to the one described by Patrascu et al.44 Some of the curves also cover only part of the range, which can be seen with the TDMCs 〈X 1Σ+|μz|E 1Σ+〉 in Fig. 4. The rest of the points portrayed incoherent behaviour and hence were dropped in the post-processing. When calculating spectra for curves with dropped points, the lines were extrapolated using cubic splines as part of the Duo calculations.
3.2 The A 1Π–X 1Σ+ band using different levels of ab initio theory
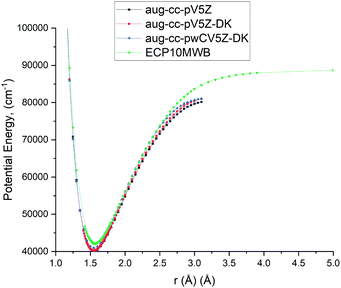
As the A 1Π–X 1Σ+ band is one of the most important spectroscopic systems of PN, here we compare the X 1Σ+ and A 1Π PECs and the A 1Π–X 1Σ+ TDMC computed using different levels of theory: icMRCI + Q/ECP10MWB, icMRCI/aug-cc-pV5Z-DK and icMRCI/aug-cc-pwCV5Z-DK, see Fig. 5 and 6. As part of the spectroscopic model for PN, even a slight change of these curves can have a profound effect on the simulated spectra or lifetimes.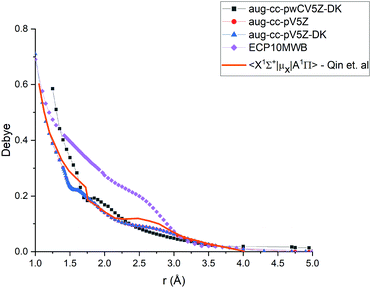 | ||
| Fig. 6 Comparison of transition dipole moment between A 1Π and X 1Σ+ states of PN at the different levels of theory (ECP10MWB, icMRCI/aug-cc-pV5Z-DK, icMRCI/aug-cc-pWCV5Z-DK) and previously reported results.29 | ||
In Fig. 6, we present a comparison of TDMCs of the A1Π and X1Σ+ states calculated at different levels of theory and results previously calculated by Qin et al.29 The TDMC calculated with the ECP10MWB stands out the most with larger values of the dipole moment around the equilibrium (i.e. in the spectroscopically relevant region) and the rest of the ECP-free methods giving curves which lie close to each other. We show below that the ECP10MWB DMC has improved the A–X lifetime of PN, the only known experimental evidence of the transition probability of this system.
The aug-cc-pWCV5Z-DK and previous results by Qin et al.29 show smaller values of TDMC which will lead to weaker intensities and longer lifetimes.
3.3 Results of Duo calculations
In this study we work directly with the ab initio data in the grid representation without representing the curves analytically, with exception of the X 1Σ+ state for which we use an empirical potential energy function from Yorke et al.49 Using their PEC, we essentially reproduce the X 1Σ+ states ro-vibrational energies of the YYLT line list.For Duo calculations, we selected the following set of curves: the icMRCI + Q/ECP10MWB PECs shown in Fig. 1 for all but the X 1Σ+ state. The comparison between the X 1Σ+ab initio PEC from this work and the empirical PEC from49 can be seen in Fig. 7. Similarly for (T)DMCs all curves are ab initio, see Fig. 4, apart from the ground state dipole moment 〈X 1Σ+|μz|X 1Σ+〉, which was also taken from Yorke et al.49 The comparison between two DMCs is shown in Fig. 8. For SOCs, TDMCs and EAMCs we use ab initio obtained curves shown in Fig. 2–4.
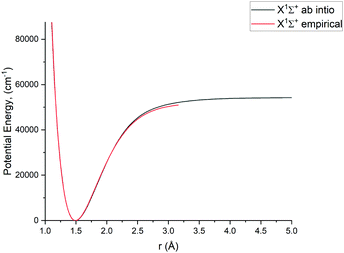 | ||
| Fig. 7 Comparison between a pseudopotential ab initio X 1Σ+ PEC and previously calculated empirical PEC49 of PN. | ||
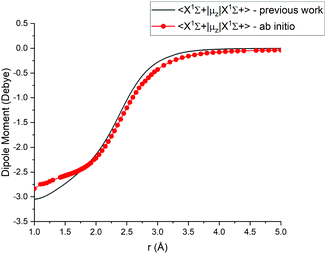 | ||
| Fig. 8 Comparison between absolute values of the ab initio X1Σ+ DMCs from this work (icMRCI + Q/ECP10MWB) and by49 (MRCI + Q/aug-cc-pCV6Z). | ||
The rovibronic wave functions of PN were computed with Duo and then used in conjunction with the ab initio (T)DMCs to produce Einstein A coefficients for all rovibronic transitions between states considered in this work, for the wavenumber range from 0 to 88![[thin space (1/6-em)]](https://www.rsc.org/images/entities/char_2009.gif) 000 cm−1 and J ≤ 270. In these calculations, the lower states were capped by the energy threshold 60
000 cm−1 and J ≤ 270. In these calculations, the lower states were capped by the energy threshold 60![[thin space (1/6-em)]](https://www.rsc.org/images/entities/char_2009.gif) 000 cm−1, which is close to the lowest dissociation threshold, while the upper state threshold was set to 88
000 cm−1, which is close to the lowest dissociation threshold, while the upper state threshold was set to 88![[thin space (1/6-em)]](https://www.rsc.org/images/entities/char_2009.gif) 000 cm−1 (highest asymptotic channel of our nine electronic state system). The line list contains 233
000 cm−1 (highest asymptotic channel of our nine electronic state system). The line list contains 233![[thin space (1/6-em)]](https://www.rsc.org/images/entities/char_2009.gif) 418
418![[thin space (1/6-em)]](https://www.rsc.org/images/entities/char_2009.gif) 251 transitions between 390
251 transitions between 390![[thin space (1/6-em)]](https://www.rsc.org/images/entities/char_2009.gif) 368 rovibronic states.
368 rovibronic states.
These Einstein A coefficients, organised as per the ExoMol format50 in a line list, were then used to calculate lifetimes and spectra. The aforementioned format uses a two file system to represent relevant spectroscopic information, with the energies and specific state quantum numbers included into the States file (.states) and Einstein coefficients appearing in the Transitions file linking different states (.trans). The.states and.trans files produced by Duo are used in conjunction with Exocross51 to produce spectra and lifetimes (see below).
3.4 Partition function
The partition function of 31P14N computed using our ab initio line list is shown in Fig. 9, which is compared to that recently reported by Barklem and Collet.52 Since 14N has a nuclear spin degeneracy of 3 and 31P has nuclear spin degeneracy of 2, we have multiplied Barklem and Collet's partition function by a factor of six to compensate for the different conventions used; we follow ExoMol and HITRAN53 and include the full nuclear spin in our partition functions. The differences in higher temperatures can be attributed to incompleteness in the model used by Barklem and Collet.52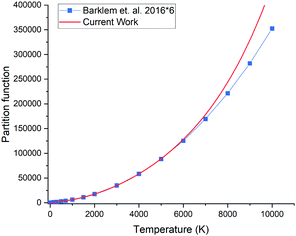 | ||
| Fig. 9 Comparison of partition functions for 31P14N: ab initio this work and the values of Barklem and Collet.52 | ||
3.5 Spectral comparisons
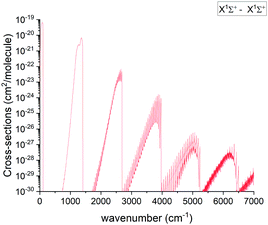
Using the ab initio31P14N line list, spectral simulations were performed with our code ExoCross.51 ExoCross is an open source Fortran 2003 code, see http://exomol.com/software/ or https://github.com/exomol, whose primary use is to produce spectra of molecules at different temperatures and pressures in the form of cross sections using molecular line lists as input. Amongst other features, ExoCross can generate spectra for non-local thermal equilibrium conditions characterized with different vibrational and rotational temperatures, lifetimes, Landé g-factors, partition and cooling functions.An overview of the PN absorption spectra in the form of cross sections at the temperature T = 2000 K is illustrated in Fig. 10. Here, a Gaussian line profile with a half-width-at-half-maximum (HWHM) of 1 cm−1 was used. This figure shows contributions from each electronic band originating from the ground electronic state. The only band systems that have so far been characterized experimentally are X 1Σ+–X 1Σ+ A 1Π–X 1Σ+, E 1Σ+–X 1Σ+. Here we mainly concentrate on discussing these band systems, due to the lack of experimental detection for other bands calculated in this work.
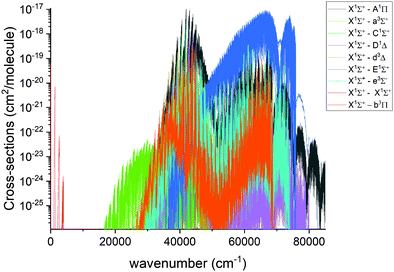 | ||
| Fig. 10 Overview of the calculated absorption spectra of PN from our model at T = 2000 K. A Gaussian line profile of HWHM = 1 cm−1 is used. | ||
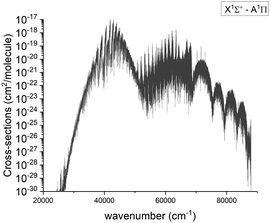 | ||
| Fig. 12 Calculated absorption spectra of the A 1Π–X 1Σ+ system at 2000 K with a Gaussian profile of HWHM = 1 cm−1. | ||
Fig. 13 compares a Duo generated spectrum of the A 1Π–X 1Σ+ (2,0) band to a part of the spectrum from recent experimental observations by Le Floch et al.21 Even at such a high resolution the main trends of the spectrum are reproduced. However, we have to note a shift of −2217 cm−1 and some differences in intensities. This will be corrected with a further improvement of our model by fitting the A 1Π PEC to the experimental data.
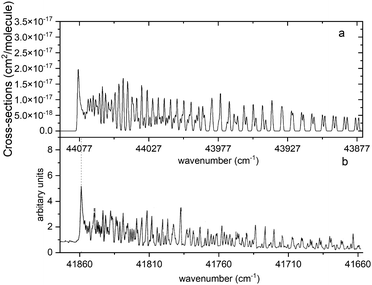 | ||
| Fig. 13 Comparison of the A 1Π–X 1Σ+ (2,0) simulated absorption band (panel a) with that recorded by Le Floch et al.21 (panel b). The spectrum was simulated at T = 1173.15 K with a Gaussian profile of HWHM = 0.5 cm−1 and is offset by 2217 cm−1 so that the features align. | ||
Fig. 14 illustrates a simulated emission A 1Π–X 1Σ+ band system at 250 nm, which is compared to the chemiluminescent experimental spectrum of Saraswathy and Krishnamurty,54 where we used the rotational temperature setting as 2000 K. However, when trying to adjust this spectrum, it proved to be very sensitive to the Te and re values for the A 1Π state. Therefore, for the purpose of this illustration we shifted the A 1Π PEC to match experimental values of Te and re. There is also a difference in relative magnitudes, which is attributed to the difference in vibrational population distribution of the experiment and our LTE calculations, as there are non-LTE effects which contribute to the spectrum. Even though the PEC was adjusted to the experimental values previously reported by Ghosh et al.19 to reproduce this spectrum, there is still a difference of 0.6 nm between ab initio spectrum and experiment, which we aim to resolve with further improvements of our spectroscopic model via empirical refinements.
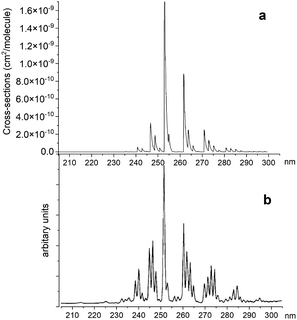 | ||
| Fig. 14 Comparison of A 1Π–X 1Σ+ simulated emission spectra (panel a) with that recorded by Saraswathy and Krishnamurty.54 (panel b). The spectra was simulated at 2000 K rotational temperature with a Gaussian profile and HWHM = 100 cm−1. | ||
Fig. 15 shows a simulated non-LTE absorption A 1Π–X 1Σ+ spectrum of PN to compare to the experiment of Moeller and Silvers.13 Most of the major features are again shifted by ∼13.5 nm. We attribute the relative difference in strength of peaks between theory and experiment to difficulty in reproducing the non-LTE behaviour of the experiment, due to the lack of necessary information in the original paper.
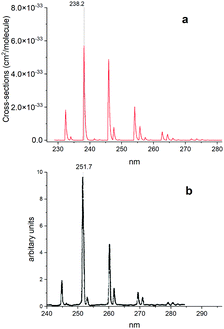 | ||
| Fig. 15 Comparison of an A 1Π–X 1Σ+ simulated emission spectrum (panel a) with that recorded by Moeller and Silvers.13 (panel b). The number at the top indicates the centre of the peak. The spectrum was simulated at Trot = 500 K (rotational) and Tvib = 1200 K (vibrational) temperatures with a Gaussian profile of HWHM = 100 cm−1. | ||
3.6 Lifetimes
In this work, lifetimes of PN are calculated using ExoCross,51 based on the states and transitions files generated by Duo. ExoCross calculates lifetimes as follows: | (3) |
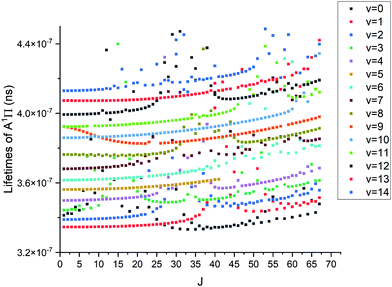
The lifetimes of 31P14N in the A1Π state for (v = 0) were measured by Moeller et al.,27 and also were calculated by Qin et al.29 and de Brouckere et al.28 While Moeller et al.27 report a lifetime of 227 ± 70 ns for ν′ = 0 of A 1Π our value is only slightly higher at 341 ns, which is closer than previous theoretical calculations of 695.4 ns29 and 742.4 ns28 by a factor of 2. Table 3 provides a more detailed comparison between our calculated lifetimes and those of Qin et al.29 We assume that the major differences in the A 1Π lifetimes and previous calculation to the difference in the transition dipole moment between X 1Σ+ and A 1Π comparison of which can be seen in Fig. 6. In order to check that, we have extracted the A 1Π TDMC data from the original source29 and rerun the lifetime calculation, then getting a comparable result of 677 ns for ν′ = 0. For the b 3Π state, lifetimes seem to be in agreement with Qin et al.29 for all but v = 0, but same cannot be said for the D 1Δ and e 3Σ− states. We attribute the bulk of differences in lifetimes for these states to the differences in TDMCs.
| ν′ | A 1Π/ns | D 1Δ/μs | b 3Π/μs | e 3Σ−/μs | ||||
|---|---|---|---|---|---|---|---|---|
| A | B | A | B | A | B | A | B | |
| 0 | 341.3 | 659.4 | 936.03 | 3872 | 18.76 | 49.2 | 128.51 | 206.9 |
| 1 | 334.6 | 674.3 | 301.51 | 1186 | 15.38 | 27.81 | 52.43 | 98.46 |
| 2 | 338.9 | 660.8 | 120.96 | 615.2 | 13.07 | 19.5 | 73.08 | 59.45 |
| 3 | 344.3 | 646.5 | 110.39 | 378.3 | 11.43 | 15.05 | 61.85 | 40.75 |
| 4 | 349.8 | 642.2 | 88.39 | 246.8 | 10.22 | 12.4 | 53.48 | 30.41 |
| 5 | 356.2 | 643 | 69.23 | 181.8 | 10.06 | 10.62 | 47.30 | 23.68 |
| 6 | 361.6 | 632.1 | 56.85 | 144.3 | 8.55 | 9.364 | 42.60 | 19.26 |
| 7 | 368.1 | 610.6 | 47.37 | 113 | 7.94 | 8.356 | 38.88 | 16.16 |
| 8 | 376.3 | 607.4 | 40.67 | 9.37 | 7.45 | 7.458 | 35.84 | 13.93 |
| 9 | 392.4 | 598.6 | 35.52 | 9.85 | 7.04 | 6.881 | 33.40 | 12.2 |
| 10 | 399.3 | 583.8 | 31.58 | 10.31 | 6.70 | 6.232 | 31.33 | 10.77 |
| 11 | 407.3 | 581.8 | 28.33 | 11.32 | 6.42 | 5.592 | 29.60 | 9.517 |
| 12 | 413.0 | 566.8 | 25.69 | 13.06 | 6.19 | 5.283 | 28.07 | 8.146 |
| 13 | 420.7 | 565.3 | 23.34 | 17.18 | 5.99 | 4.819 | 26.78 | 7.142 |
| 14 | 431.3 | 553.1 | 21.66 | 22.57 | 5.82 | 4.303 | 25.67 | 6.192 |
Lifetimes for other singlet and triplet states are reported in Table 4. From there we can see that the radiative lifetimes are in milliseconds for C 1Σ−, d 3Δ and a 3Σ+, and nanoseconds for E 1Σ+. Long lifetimes for the C 1Σ−, d 3Δ and a 3Σ+ states are an indication of low probability of transition from these states, leading us to believe that these states would be very difficult to observe in an experiment. This is confirmed with current experimental evidence for PN, as C 1Σ−, D 1Δ, a 3Σ+, d 3Δ, e 3Σ−, which have only been observed indirectly through perturbation with the state A 1Π by Le Floch et al.21 The b 3Π, d 3Δ, e 3Σ− states have been also previously identified only through perturbation with A1Π state by Saraswathy and Krishnamurty.20
| ν′ | C 1Σ−/ms | a 3Σ+/s | d 3Δ/ms | E 1Σ+/ns |
|---|---|---|---|---|
| 0 | 65.02 | 2.07 × 10⁶ | 4.19 | 58.70 |
| 1 | 53.72 | 9.58 | 9.81 | 52.43 |
| 2 | 19.31 | 4.54 | 5.86 | 48.71 |
| 3 | 8.21 | 2.85 | 2.77 | 44.25 |
| 4 | 4.35 | 2.02 | 1.44 | 39.88 |
| 5 | 2.68 | 1.50 | 0.64 | 37.44 |
| 6 | 1.83 | 1.18 | 0.03 | 34.03 |
| 7 | 1.33 | 0.97 | 0.39 | 30.09 |
| 8 | 1.02 | 0.81 | 0.19 | 28.67 |
| 9 | 0.81 | 0.69 | 0.35 | 27.89 |
| 10 | 0.66 | 0.06 | 0.31 | 27.76 |
| 11 | 0.56 | 0.41 | 0.27 | 27.97 |
| 12 | 0.48 | 0.33 | 0.23 | 28.23 |
| 13 | 0.42 | 0.09 | 0.17 | 28.71 |
| 14 | 0.37 | 0.04 | 0.05 | 29.77 |
4 Conclusion
In this work, a comprehensive ab initio spectroscopic model for the nine lowest electronic states of PN is presented. A full set of potential energy, (transition) dipole moment, spin–orbit coupling, and electronic angular momenta coupling curves for these 9 electronic states was produced ab initio using the icMRCI + Q/ECP10MWB and icMRCI/aug-cc-pV5Z(-DK) methods. These curves were then processed via the Duo program to solve the fully-coupled nuclear-motion Schrödinger equation. Many of the results show satisfactory agreement with previous computational works, but there are certain differences in lifetimes and predicted spectra which indicate that further investigation backed by experimental data is needed to obtain a reliable spectroscopic model. In the next work we aim to tackle such differences, by producing an accurate, empirical line list for 31P14N for use in astrophysical spectroscopy of distant stars and exoplanets. In order to achieve this, the ab initio curves will be refined by fitting to the experimental data collected and processed via MARVEL methodology.56 Additionally non-adiabatic coupling effects, which are most important for the heavily perturbed A1Π state, will be included for finer accuracy. With PN being detected in multiple different interstellar media and phosphorous being a key element to life as we know it, PN is becoming a more important spectroscopic molecule. This work should provide an improved data quality for spectroscopic searches of PN in different astronomical environments, potentially leading to the detection of PN at ultraviolet wavelengths.The supplementary materials in this paper contain our final spectroscopic model for PN in a form of a Duo input file, an ExoMol States file including lifetimes and a partition function file. This Duo file is ready to be directly used with the Duo program, see http://exomol.com/software/ allowing our results to be reproduced directly.
Conflicts of interest
There are no conflicts to declare.Acknowledgements
The authors thank Alec Owens for helpful discussions during this project. This work was supported by UK STFC under grant ST/R000476/1. This work made use of the STFC DiRAC HPC facility supported by BIS National E-infrastructure capital grant ST/J005673/1 and STFC grants ST/H008586/1 and ST/K00333X/1. We thank the European Research Council (ERC) under the European Unions Horizon 2020 research and innovation programme through Advance Grant number 883830. We also want to thank Moscow Witte University for sponsoring the fellowship enabling this research. This work is additionally supported by Khalifa University of Science and Technology under Award No. CIRA-2019-054. Khalifa University High power computer was used for the completion of this work.Notes and references
- M. A. Pasek and D. S. Lauretta, Astrobiology, 2005, 5, 515–535 CrossRef CAS PubMed.
- J. S. Greaves, A. M. S. Richards, W. Bains, P. B. Rimmer, H. Sagawa, D. L. Clements, S. Seager, J. J. Petkowski, C. Sousa-Silva, S. Ranjan, E. Drabek-Maunder, H. J. Fraser, A. Cartwright, I. Mueller-Wodarg, Z. Zhan, P. Friberg, I. Coulson, E. Lee and J. Hoge, Nat. Astron., 2020, 5, 655–664 CrossRef.
- B. E. Turner and J. Bally, Astrophys. J., 1987, 321, L75–L79 CrossRef CAS.
- L. M. Ziurys, Astrophys. J., Lett., 1987, 321, L81–L85 CrossRef CAS PubMed.
- B. E. Turner, T. Tsuji, J. Bally, M. Guelin and J. Cernicharo, Astrophys. J., 1990, 365, 569–585 CrossRef CAS.
- T. Yamaguchi, S. Takano, N. Sakai, T. Sakai, S.-Y. Liu, Y.-N. Su, N. Hirano, S. Takakuwa, Y. Aikawa, H. Nomura and S. Yamamoto, Publ. Astron. Soc. Jpn., 2011, 63, L37–L41 CrossRef CAS.
- F. Fontani, V. M. Rivilla, P. Caselli, A. Vasyunin and A. Palau, Astrophys. J., Lett., 2016, 822, L30 CrossRef.
- S. N. Milam, D. T. Halfen, E. D. Tenenbaum, A. J. Apponi, N. J. Woolf and L. M. Ziurys, Astrophys. J., 2008, 684, 618–625 CrossRef CAS.
- E. De Beck, T. Kaminski, N. A. Patel, K. H. Young, C. A. Gottlieb, K. M. Menten and L. Decin, Astron. Astrophys., 2013, 558, A132 CrossRef.
- L. M. Ziurys, D. R. Schmidt and J. J. Bernal, Astrophys. J., 2018, 856, 169 CrossRef.
- J. Curry, L. Herzberg and G. Herzberg, Z. Phys., 1933, 86, 348–366 CrossRef CAS.
- M. Wu and T. P. Fehlner, Chem. Phys. Lett., 1975, 36, 114–116 CrossRef CAS.
- M. B. Moeller and S. J. Silvers, Chem. Phys. Lett., 1973, 19, 78–81 CrossRef CAS.
- R. M. Atkins and P. L. Timms, Spectrochim. Acta, Part A, 1977, 33, 853–857 CrossRef.
- J. Hoeft, E. Tiemann and T. Törring, Z. Naturforsch., A: Phys., Phys. Chem., Kosmophys., 1972, 27, 703–704 CAS.
- F. C. Wyse, W. Gordy and E. L. Manson, J. Chem. Phys., 1972, 57, 1106 CrossRef CAS.
- G. Cazzoli, L. Cludi and C. Puzzarini, THEOCHEM, 2006, 780-81, 260–267 CrossRef.
- I. K. Ahmad and P. A. Hamilton, J. Mol. Spectrosc., 1995, 169, 286–291 CrossRef CAS.
- S. N. Ghosh, R. D. Verma and J. VanderLinde, Can. J. Phys., 1981, 59, 1640–1652 CrossRef CAS.
- P. Saraswathy and G. Krishnamurty, Pramana, 1987, 29, 53–77 CrossRef CAS.
- A. C. Le Floch, F. Melen, I. Dubois and H. Bredohl, J. Mol. Spectrosc., 1996, 176, 75–84 CrossRef CAS.
- B. Coquart and J. C. Prudhomme, J. Phys. B: At., Mol. Opt. Phys., 1980, 13, 2251–2254 CrossRef CAS.
- B. Coquart and J. C. Prudhomme, J. Mol. Spectrosc., 1981, 87, 75–84 CrossRef CAS.
- R. D. Verma and S. N. Ghosh, J. Phys. B: At., Mol. Opt. Phys., 1984, 17, 3529–3533 CrossRef CAS.
- R. D. Verma, S. N. Ghosh and Z. Iqbal, J. Phys. B: At., Mol. Opt. Phys., 1987, 20, 3961–3974 CrossRef CAS.
- H. Bredohl, I. Dubois, D. Macau-Hercot, F. Remy, J. Breton and J. M. Esteva, J. Mol. Spectrosc., 1992, 156, 292–295 CrossRef CAS.
- M. B. Moeller, M. R. McKeever and S. J. Silvers, Chem. Phys. Lett., 1975, 31, 398–400 CrossRef CAS.
- G. de Brouckere, D. Feller and J. J. A. Koot, J. Phys. B: At., Mol. Opt. Phys., 1993, 26, 1915–1934 CrossRef CAS.
- Z. Qin, J. M. Zhao and L. H. Liu, J. Quant. Spectrosc. Radiat. Transfer, 2019, 227, 47–56 CrossRef CAS.
- K. A. Gingeric, J. Phys. Chem., 1969, 73, 2734–2741 CrossRef.
- E. O. Huffman, G. Tarbutton, K. L. Elmore, W. O. Cate, H. K. Walters and G. V. Elmore, J. Am. Chem. Soc., 1954, 76, 6239–6243 CrossRef CAS.
- O. M. Uy, F. J. Kohl and K. D. Carlson, J. Phys. Chem., 1968, 72, 1611–1616 CrossRef CAS.
- J. Curry, L. Herzberg and G. Herzberg, J. Chem. Phys., 1933, 1, 749 CrossRef CAS.
- K. Abbiche, M. Salah, K. Marakchi, O. K. Kabbaj and N. Komiha, Mol. Phys., 2014, 112, 117–126 CrossRef CAS.
- J. Tennyson and S. N. Yurchenko, Mon. Not. R. Astron. Soc., 2012, 425, 21–33 CrossRef CAS.
- S. N. Yurchenko, L. Lodi, J. Tennyson and A. V. Stolyarov, Comput. Phys. Commun., 2016, 202, 262–275 CrossRef CAS.
- H.-J. Werner, P. J. Knowles, F. R. Manby, J. A. Black, K. Doll, A. Heßelmann, D. Kats, A. Köhn, T. Korona, D. A. Kreplin, Q. Ma, T. F. Miller, A. Mitrushchenkov, K. A. Peterson, I. Polyak, G. Rauhut and M. Sibaev, J. Chem. Phys., 2020, 152, 144107 CrossRef CAS PubMed.
- T. H. Dunning, J. Chem. Phys., 1989, 90, 1007–1023 CrossRef CAS.
- I. S. Lim, P. Schwerdtfeger, B. Metz and H. Stoll, J. Chem. Phys., 2005, 122, 104103 CrossRef PubMed.
- D. E. Woon and T. H. Dunning, J. Chem. Phys., 1993, 98, 1358–1371 CrossRef CAS.
- J.-M. Wang, J.-F. Sun and D.-H. Shi, Chin. Phys. B, 2010, 19, 49–58 Search PubMed.
- F. Grein and A. Kapur, J. Mol. Spectrosc., 1983, 99, 25–34 CrossRef CAS.
- J. Tennyson and S. N. Yurchenko, Int. J. Quantum Chem., 2017, 117, 92–103 CrossRef CAS.
- A. T. Patrascu, C. Hill, J. Tennyson and S. N. Yurchenko, J. Chem. Phys., 2014, 141, 144312 CrossRef PubMed.
- S. N. Yurchenko, I. Szabo, E. Pyatenko and J. Tennyson, Mon. Not. R. Astron. Soc., 2018, 480, 3397–3411 CrossRef CAS.
- H.-Y. Li, J. Tennyson and S. N. Yurchenko, Mon. Not. R. Astron. Soc., 2019, 486, 2351–2365 CrossRef CAS.
- L. K. McKemmish, T. Masseron, J. Hoeijmakers, V. V. Pérez-Mesa, S. L. Grimm, S. N. Yurchenko and J. Tennyson, Mon. Not. R. Astron. Soc., 2019, 488, 2836–2854 CrossRef CAS.
- R. Guardiola and J. Ros, J. Chem. Phys., 1982, 45, 374–389 Search PubMed.
- L. Yorke, S. N. Yurchenko, L. Lodi and J. Tennyson, Mon. Not. R. Astron. Soc., 2014, 445, 1383–1391 CrossRef CAS.
- J. Tennyson, S. N. Yurchenko, A. F. Al-Refaie, E. J. Barton, K. L. Chubb, P. A. Coles, S. Diamantopoulou, M. N. Gorman, C. Hill, A. Z. Lam, L. Lodi, L. K. McKemmish, Y. Na, A. Owens, O. L. Polyansky, T. Rivlin, C. Sousa-Silva, D. S. Underwood, A. Yachmenev and E. Zak, J. Mol. Spectrosc., 2016, 327, 73–94 CrossRef CAS.
- S. N. Yurchenko, A. F. Al-Refaie and J. Tennyson, Astron. Astrophys., 2018, 614, A131 CrossRef.
- P. S. Barklem and R. Collet, Astron. Astrophys., 2016, 588, A96 CrossRef.
- R. R. Gamache, C. Roller, E. Lopes, I. E. Gordon, L. S. Rothman, O. L. Polyansky, N. F. Zobov, A. A. Kyuberis, J. Tennyson, S. N. Yurchenko, A. G. Császár, T. Furtenbacher, X. Huang, D. W. Schwenke, T. J. Lee, B. J. Drouin, S. A. Tashkun, V. I. Perevalov and R. V. Kochanov, J. Quant. Spectrosc. Radiat. Transfer, 2017, 203, 70–87 CrossRef CAS.
- P. Saraswathy and G. Krishnamurty, Pramana, 1987, 29, 53–77 CrossRef CAS.
- J. Tennyson, K. Hulme, O. K. Naim and S. N. Yurchenko, J. Phys. B: At., Mol. Opt. Phys., 2016, 49, 044002 CrossRef.
- T. Furtenbacher, A. G. Császár and J. Tennyson, J. Mol. Spectrosc., 2007, 245, 115–125 CrossRef CAS.
Footnote |
| † Electronic supplementary information (ESI) available. See DOI: 10.1039/d1cp02537f |
| This journal is © the Owner Societies 2021 |

