 Open Access Article
Infrared spectra of amorphous and crystalline urea ices†
Vicente
Timón
 ,
Belén
Maté
 *,
Victor J.
Herrero
 and
Isabel
Tanarro
Instituto de Estructura de la Materia, IEM-CSIC, Serrano 123, 28006 Madrid, Spain. E-mail: belen.mate@csic.es
First published on 27th September 2021
Abstract
Urea is a molecule of great interest in chemistry and biology. In particular, it is considered a key building block in prebiotic chemistry on Earth. The hypothesis of its possible exogenous origin has been reinforced after the recent detection of this molecule in the interstellar medium, where it is believed to form in the ice mantles of dust grains. In this work the infrared spectra of urea ices and urea:H2O ice mixtures have been studied both experimentally and theoretically. Urea ices were generated by vapour deposition at temperatures between 10 K and 270 K. It was found that an amorphous phase is formed at temperatures below 200 K. A theoretical modelling of crystalline urea and of a tentative amorphous urea solid phase, as well as of amorphous urea:H2O ice mixtures, has been performed. The corresponding infrared spectra were simulated with density functional theory. The main spectral features observed in the various solid samples are interpreted with the help of the theoretical results. Infrared band strengths are also provided for amorphous and crystalline urea. The infrared spectroscopic information given in this work is expected to be useful for the detection and quantification of urea in astrophysical ices.
1 Introduction
Urea (NH2CONH2) was the first organic compound synthesized from inorganic precursors in the laboratory.1 Due to its importance in many applied and fundamental research fields related to chemistry and biology, its infrared spectrum and structure have been thoroughly studied. Urea is a polycrystalline powder under standard conditions. A list of experimental frequencies in the infrared spectrum of crystalline urea embedded in KBr pellets was provided by Keuleers et al.,2 at room temperature and at 77 K. Another infrared spectrum of crystalline urea and of urea-water solutions at room temperature can be found in the work by Grdadolnik et al.3 In this case, the pure urea polycrystalline sample was prepared by evaporation of the solvent from a urea solution deposited on a substrate. Duvernay et al.4 reported the spectrum of urea molecules isolated in Ar or Xe matrices at 10 K. From the theoretical point of view, after the experimental determination of the position of the H atoms of urea via neutron diffraction,5 several works tried to reproduce the crystal structure of urea and give IR frequencies and band assignments.2,6 These studies were based on quantum chemistry calculations of clusters and periodic structures containing several urea molecules at the Hartree–Fock level. Both experimentally and theoretically it is now well stablished that urea molecules present a planar structure in the solid crystalline state, where they form a three-dimensional network of hydrogen bonds, each urea molecule participating in eight H-bonds and being connected to six adjacent urea molecules. Interestingly, the geometry of the urea molecule in the gas phase is nonplanar.7Urea is considered a key building block in prebiotic chemistry,8 and could have been one of the relevant species for the origin of life on Earth. The possible exogenous origin of prebiotic molecules contributing to the emergence of life on Earth has been considered for decades.9 This possibility has been reinforced during the last years due to the increase of reported detections of complex organic molecules (COMs), defined in the astrochemical community as carbon-bearing molecules with six atoms or more,10 in the interstellar medium (ISM), especially in star forming regions.11 In particular, a tentative detection of urea in the ISM by the Infrared Space Observatory (ISO) was reported by Raunier et al.12 In that work, features associated to urea were recognized in the infrared absorption spectrum of some ice mantels covering dust grains observed toward dense molecular clouds. More recently, this species has been detected in the gas phase toward the hot molecular cores embedded in the high-mass-star-forming region Sgr B2(N) and towards a giant molecular cloud in the center of the Milky Way, G10.693-0.027.13,14
In the present work we have investigated, experimentally and theoretically, the solid phases of urea and urea:H2O at low temperature. Solid amorphous and crystalline phases of urea and urea:H2O ice mixtures were generated in the laboratory by vapor deposition on a cold substrate. The structure and vibrational spectra of crystalline urea, of a tentative amorphous urea solid phase, and of amorphous urea:H2O ice mixtures, were modelled using density functional theory (DFT) calculations. Vibrational modes were assigned to the measured absorption bands with the help of the theoretical results. Modifications of the urea spectrum in the different solids are discussed in the light of the calculations. To our knowledge, no previous studies on the amorphous solid phase of urea have been reported. An effort has been made to provide an estimation, both experimentally and theoretically, of infrared absorption band strengths of the urea solid, since no previous literature values were found for these magnitudes.
The new information provided is expected to be useful to guide urea searches in ices in astrophysical environments.
2 Experimental details
The high-vacuum (HV) experimental set-up for infrared spectroscopy of ices has been described previously15 and only the details relevant to the present investigation are given here. It consists of a cylindrical vacuum chamber provided with a closed-cycle He cryostat, and coupled to a Vertex70 FTIR spectrometer through KBr windows. Inside the chamber, solid layers of urea or urea:H2O mixtures were deposited from the vapor phase on a cold IR transparent Si substrate placed in contact with the cold head of the cryostat. Urea is a white powder commercially available (99%, Merck), that has a low vapour pressure under ambient conditions (1.6 × 10⁻⁵ mbar at 25C).16 It was sublimated using the high-vacuum-sublimation oven described previously.17 The oven was placed in the HV chamber, with its 3 mm diameter exit hole at a distance of 30 mm from the cold Si surface. It was heated to 80 °C, to increase the vapour pressure of urea. To generate the thin urea films studied in this work, deposition times of less than one minute were used. Deposition temperatures ranged between 10 K and 200 K.Ice mixtures of urea:H2O were generated by introducing simultaneously both vapours into the vacuum chamber. Water was subjected to three freeze–pump–thaw cycles for degassing before allowing it into the vacuum chamber. The water vapour line, provided with a leak valve, is placed in a port that ensures backfilling of the chamber. Therefore, during the simultaneous deposit, a mixed ice layer grows on one side of the Si substrate (the one facing the oven) and a pure water ice layer accretes on its back side. In these experiments, the contribution of the side containing only water ice is removed by subtracting the corresponding spectrum of pure amorphous solid water (ASW) from the measured spectra. Infrared spectra were recorded with a liquid nitrogen cooled Mercury–Cadmium–Telluride (MCT) detector, in normal transmission configuration, with a 2 cm−1 resolution and averaging 300 scans.
Apart from the experiments detailed above, IR spectra of KBr pellets containing urea were recorded with an IFS66 spectrometer and a DTGS detector at 4 cm−1 resolution, adding 300 scans. An amount of 2.68 mg of urea was weighted and carefully mixed and milled with enough KBr, to prepare sixteen KBr pellets. Infrared transmission spectra at room temperature were recorded for all the pellets. The unsaturated IR spectra recorded for the sixteen pellets were averaged and the averaged spectrum used to estimate infrared band strengths.
3 Theoretical details
The structure of crystalline urea is a tetragonal space group P421m unit cell containing two molecules, and was first reported by Worsham et al.5 Later, Swaninathan et al.18 measured a similar geometry for urea crystals at 12 K. The reported low temperature crystal unit cell dimensions were:18a = b = 5.565 Å and c = 4.684 Å (see also ESI†). In the present work geometry optimization was carried out with the CASTEP code19 using the hybrid B3LYP20 DFT-based method with 4 × 4 × 4 equally spaced k-point grids employed for the Brillouin zone sampling which gives a total of 4 irreducible k-points. The choice of this method for the study of the molecular crystals of urea is supported by the good performance of B3LYP in molecular calculations as stressed by Ferrero et al.21 Since urea molecules are packed together by van der Waals forces and/or weak and moderate hydrogen bonds (H-bonds), Grimme's empirical dispersion correction B3LYP(-D2)22,23 was included in the calculations due to its significance in the geometry optimization. OTFG pseudopotentials24 with a cut-off 925 eV were employed. The convergence criteria were set at 1 × 10⁻⁵ eV per atom for the energy, 0.03 eV Å−1 for the interatomic forces, maximum stress 0.05 GPa and 0.001 Å for the displacements. Atomic forces and charges were evaluated at the minimum in the potential energy surface to predict the harmonic vibrational infrared spectrum by means of density functional perturbation theory.25,26The spectrum of an isolated urea molecule was also simulated with CASTEP, placing the urea molecule inside a cubic unit cell large enough (l = 10 Å) to ensure a negligible interaction between molecules in contiguous unit cells (see also ESI†).
Amorphous models for multiple molecule systems of urea and urea:H2O were constructed with a Monte Carlo procedure under a Universal Force Field scheme, as implemented in the Amorphous Cell code of the BIOVIA Materials Studio 2019 software package. Subsequently, full geometry optimization (energy minimization) of the selected urea or urea:H2O molecular systems was performed with the CASTEP code, using 2 × 2 × 2 equally spaced k-point grids for the Brillouin zone sampling, which gives a total of 4 irreducible k-points.
In our models we used a cubic unit cell containing 6 urea molecules. Hydrated amorphous phases were built introducing a number of water molecules between 4 and 8 with a total number of urea + H2O molecules of ten in all calculations. When water molecules closely interact with urea through hydrogen bonds, several configurations have been investigated (see also ESI†). These structures have been geometrically optimized and its IR spectra calculated with the same methodology described for the crystal.
4. Results and discussion
4.1. Infrared spectra and phase transition
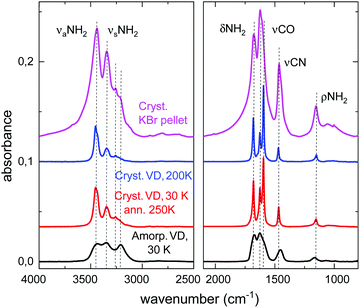
Mid-IR spectra of amorphous and crystalline samples of solid urea are shown in Fig. 1. Amorphous solid layers of urea are formed by vapor deposition on a substrate held at temperatures below 180 K. When these amorphous samples are annealed, or when the urea vapor is deposited at higher temperatures (200 K, or above), a polycrystalline layer is obtained. The spectrum of polycrystalline urea embedded in a KBr pellet at room temperature is also presented in this figure.The assignment of all normal mode vibrations observed in the 3800–800 cm−1 range, based on the calculations carried out in this work (see below), are given in Table 1 and indicated in the figures. Minor features, not listed in the table, can also be discerned in the spectra. Although there are several works that present IR spectra of crystalline solid urea and its mode assignments (see Keuleers et al.2 and references therein), as far as we know, the vibrational spectrum of the amorphous phase of solid urea is given here for the first time. The mode assignment, obtained from the comparison with the calculated IR spectra, will be discussed in the next section.
| Assignment | Peak positions (cm−1) | |
|---|---|---|
| Crystalline | Amorphous | |
| ν aNH2 | 3453, 3439 | 3439 |
| ν sNH2 | 3345 | 3348 |
| 3257, 3222 | 3210 | |
| δNH2 | 1680, 1625 | 1672, 1625 |
| νCO | 1596 | 1591 shoulder |
| νCN | 1468 | 1452 |
| ρNH2 | 1153 | 1165 |
Fig. 2 shows the evolution of the low temperature urea solid deposit upon warming, at 10 K min−1. The spectra of the solid amorphous sample hardly change with rising temperature over the 10–245 K range, but heating to ≈250 K leads to appreciable variations in the band shapes and shifts in the absorption maxima (see also Fig. 1). It has to be stressed that the annealing process was made at 10 K min−1, without stopping at the different temperatures. Above 245 K, the peaks become sharper and more resolved. These changes are indicative of sample crystallization and are due to the growing order and geometric restrictions for the molecules in a crystalline frame, which result in different environments for a given functional group. An overall intensity increase of absorption bands is also appreciated. Above 250 K, the spectra remain stable until sublimation, which takes place above 270 K under the high vacuum conditions of our experiment.
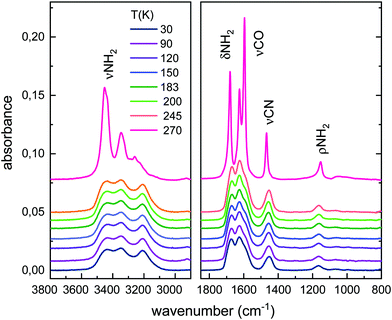 | ||
| Fig. 2 Evolution of the IR spectrum of urea with temperature for an initial 30 K solid deposit. A shift is introduced in the absorbance axis of the spectra for a better visualization. | ||
The evolution of the band areas with temperature, for the four main absorption regions in the urea spectrum, is shown in Fig. 3. A remarkable increase of some of the band strengths of vapor deposited urea in the transition from the amorphous to the crystalline phase is observed. For example, the band groups between 3710–3020 cm−1 (νNH2) and 1772–1520 cm−1 (δNH2 + νCO) nearly double their intensities in the amorphous to crystalline transformation. This behavior was not observed in other complex organic molecules (COMs) investigated in our group, like glycine or methyl-isocyanate.17,27 However, it is a well-known effect in amorphous pure water ices where, for example, the band strength of the OH stretching vibrations increases by a factor 1.4 from the ASW generated at 10 K to the crystalline phase at 150 K.28
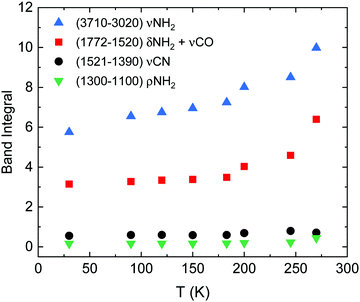 | ||
| Fig. 3 Band integral versus temperature of the four absorption regions indicated in the legend, corresponding to νNH2, δNH2 + νCO, and νCN modes. | ||
4.2 Infrared band strengths
The infrared band strengths of solid urea have been estimated experimentally from the IR spectra of polycrystalline urea embedded in KBr pellets, prepared as described in the experimental section. From the averaged spectra of sixteen pellets, the infrared band strengths of solid polycrystalline urea were obtained using the expression:where Int is the integrated band area in the absorbance spectrum, and N is the column density of urea molecules. The values are listed in Table 2. No attempt was made to separate the different mode contributions (δNH2, νCO) in the 1800–1500 cm−1 region. The uncertainty in these magnitudes is large, of the order of 40%, due mostly to the inaccuracy in the estimate of the column density of urea molecules in the urea pellets, and also to the effect of baseline selection in the integration procedure when estimating the integrated area of the bands in the spectrum. It was assumed that the polycrystalline phase obtained via vapor deposition at 200 K, or via annealing, and the amorphous forms, are similar and equal to that of the room temperature polycrystalline powder.
| Wavelength range (cm−1) | A (×10−17 cm molecule−1) | |||
|---|---|---|---|---|
| Crystalline (KBr pellet) | Amorphous 30 K | Amorphous 245 K | ||
| νNH2 | 3710–3020 | 17.0 | 9.8 | 14.5 |
| δNH2, νCO | 1772–1520 | 12.2 | 6.0 | 8.7 |
| νCN | 1521–1390 | 1.6 | 1.25 | 1.8 |
| ρNH2 | 1300–1100 | 0.6 | 0.22 | 0.3 |
In order to estimate band strengths of the amorphous urea forms, the relation between the band integrals of the crystalline (270 K) and amorphous samples shown in Fig. 3 were taken into account. In the two right columns of Table 2 the band strengths estimated for amorphous urea at 30 K and at 245 K are given.
4.3 Theoretical models for crystalline and amorphous urea
The parameters of the optimized crystal unit cell obtained in the present work (a = b = 5.45 Å and c = 4.71 Å) indicate that the inclusion of dispersion at the B3LYP level of calculation slightly reduces the unit cell size with respect to the experimental values (see ESI†). The internal bond lengths also decrease on average, with some exceptions where they increase slightly (e.g., C–O distances from 1.26 Å experimental17 to 1.27 Å calculated), and are in general in good agreement with the experimental values measured at low temperature by Swaminathan et al.,18 and at room temperature by Worsham et al.5As mentioned above, the crystalline structure of urea is known from bibliographic data. On the contrary, no information about the structure of amorphous urea is available, in particular, on its density. In order to simulate an amorphous urea solid, initial tests were performed forcing the density to lay between 0.8 and 1.4 g cm−3. However, a more stable structure was obtained allowing the system to fully relax, modifying not only the molecular arrangement but also the unit cell size, and therefore its density. In this way, the converged amorphous structure reached a density of 1.38 g cm−3, close to that of the crystal, which is 1.32 g cm−3. The optimized structures calculated in this work are shown in Fig. 4 and more details can be found in the ESI.†
 | ||
| Fig. 4 Optimized structures of the urea molecule (a), an amorphous unit cell (b), and a crystalline unit cell (c) of urea. | ||
The infrared spectra, for the isolated molecule, the amorphous solid, and the crystalline solid, calculated using a similar level of theory, are presented in Fig. 5. The calculated vibrational modes have been represented by Gaussian functions of 10 cm−1 FWHM. The theoretical main peak positions, band assignments and band strengths are given in Table 3. For the crystalline solid a column has been included indicating the observed-calculated frequency shift. The band assignments have been performed by visualization of the atomic motions with CASTEP, and correspond to the predominant vibrations in the indicated peak positions or wavenumber intervals. To our knowledge, no previous theoretical calculations have been published for the amorphous form of urea.
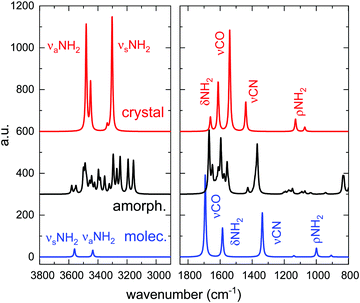 | ||
| Fig. 5 Calculated infrared spectra of the isolated urea molecule, and of the crystalline and amorphous solids. | ||
| Peak position (cm−1) | ν calc–νexp | A (10−17 cm molecule−1) | |||||
|---|---|---|---|---|---|---|---|
| Isolated molecule | Amorphous solid 1.38 g cm−3 | Crystalline solid | Crystalline | Isolated molecule | Amorphous solid 1.38 g cm−3 | Crystalline solid | |
| ν aNH2 | 3435, 3442 | 3580–3396 | 3481, 3451 | +28 | 1.2 | 27 | 44 |
| +13 | |||||||
| ν sNH2 | 3560, 3562 | 3383–3155 | 3336, 3303 | −9 | |||
| −27 | |||||||
| δNH2 | 1585, 1586 | 1673–1556 | 1660, 1612 | −20 | 2.3 | 19 | 10 |
| −13 | |||||||
| νCO | 1693 | 1547 | 1540 | −56 | 6.5 | 16 | |
| νCN | 1336 | 1427–1362 | 1440 | −28 | 3.5 | 6 | 4.6 |
| ρNH2 | 1140, 999, 907 | 1204–1148 | 1130, 1072 | −23 | 0.93 | 1.2 | 2.6 |
The spectrum of the isolated urea molecule has been calculated to illustrate the shift of the νCO mode that takes place in this species when changing from the gas to solid phase. In the molecule, this mode appears at larger wavenumbers (1693 cm−1) than the δNH2 bending (1585 cm−1), but shifts to lower frequencies (1540 cm−1), below those of the δNH2 mode, in the crystal (see Table 3). This shift, due to hydrogen bonding between urea molecules in the solid, has been reported previously2 and it is clearly observed in the calculations performed in this work, both in the crystalline and in the amorphous solid phases. The assignments for the isolated molecule and crystalline solid given in Table 3 are in good agreement with those reported by Rouseeau et al.,29 Keuleers et al.,2 and Grdadolnik et al.,3 based on theoretical calculations and on experimental spectra of protonated and deuterated urea samples.
In the amorphous form, the mode assignment is less clear, due to a larger mixing of the different atomic motions as compared with the crystal. For the crystal, a separation has been made in Table 3 between the features assigned to δNH2 (between 1673–1556 cm−1) and those assigned to νCO (1547 cm−1). However, establishing a cutting point for the amorphous solid in this absorption range is complicated, since all the modes in the 1673–1547 cm−1 interval present some contribution of CO stretching. This contribution increases with decreasing wavenumber. For that reason, it was decided to group the band strength of the modes in that region as a unique number (see right columns in Table 3).
The theoretical calculations provide also absolute infrared band strengths (see the three right columns in Table 3). The band strengths calculated for the crystal are roughly a factor two-three larger than the experimental ones given in Table 2. In particular, the ratio theoretical/experimental is 2.6 for A (νNH2), 2.1 for A (δNH2 + νCO), and 2.9 for A(νCN). This result may be considered acceptable, keeping in mind the approximations involved in the theoretical model and the uncertainty in the experimental measurements. The overall lower absorption band strengths observed experimentally for the amorphous phase, as compared with the crystalline one (see Fig. 3 and Table 2), is qualitatively reproduced in the calculations except for the νCN band (note that for this comparison the theoretical band strengths for the crystalline δNH2 and νCO vibrations must be grouped together). As mentioned above, the density of the amorphous solid is unknown and was predicted by the simulations, and this could be, at least in part, the reason of the disagreement between theory and experiment. In general, larger errors are expected in the simulations of the amorphous phase.
The theoretical spectra of amorphous and crystalline urea are compared in Fig. 6 with those from experiments obtained by vapor deposition at 10 K and 200 K, respectively. The two theoretical spectra have been displaced in the vertical axis adequately for a good visualization. It can be seen that the calculations reproduce reasonably well the pattern of the absorptions over the 3800–800 cm−1 range. For the amorphous solids the agreement between theory and experiment supports the adequacy of modelling this system with a unit cell containing only a few molecules.
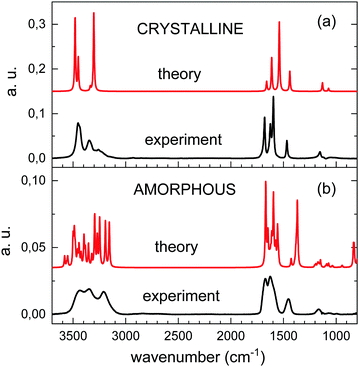 | ||
| Fig. 6 Comparison of calculated (red trace) and experimental (back trace) spectra for crystalline (a) and amorphous (b) vapor deposited urea. | ||
The theoretical spectrum of crystalline urea shows two bands at 3480 and 3451 cm−1, assigned to asymmetric NH2 stretching, and another two at 3336 and 3294 cm−1, assigned to the corresponding symmetric vibration. Comparison with the experimental spectrum (top panel of Fig. 6) shows that these two pairs of peaks correlate with the two first maxima in the high frequency range of the experimental spectrum. However, a weaker absorption contribution, also attributable to NH stretching vibrations, is observed in the experimental spectrum, at 3200 cm−1, and is not reproduced in the calculation. The discrepancy could be caused by a non-perfect crystallinity of the experimental sample, or could be due to shortcomings of the model for the treatment of long range molecular interactions.
One of the most remarkable differences between the experimental IR spectra of crystalline and amorphous urea is the increase in the latter of the absorption intensity at the lower frequency end of the NH2 stretching band and, specifically, in the 3200 cm−1 component. This low frequency component is nicely reproduced in the calculated spectrum of the amorphous form. Visualization of the two lower frequency νNH2 modes of the calculation, at 3247 and 3155 cm−1, shows that they correspond to combinations of the symmetric νNH2 stretching with CO stretching vibrations.
In the region between 1800 and 1500 cm−1, the component of the CO stretching is only appreciable as a shoulder in the amorphous experimental spectrum, and its contribution is impossible to disentangle from that of the NH2 bending modes. DFT calculations reproduce the observations, and show more mixed modes in this frequency range for the amorphous than for the crystalline solid, as mentioned above.
In general, the calculated peak positions are in quite good agreement with the experiments, with small displacements in most of the modes. There are two modes were the calculations present larger frequency deviations: the νCO mode in the crystalline form, and the νCN mode in the amorphous form. For the crystal, the calculated νCO mode is shifted almost 56 cm−1 with respect to the experiment. In the amorphous form, the calculated νCN mode appears almost 80 cm−1 shifted to lower frequency with respect to the experimental value.
4.4 Urea:H2O ice mixtures
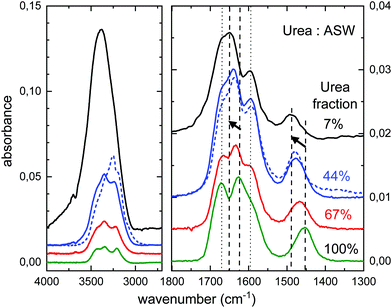
The experimental spectra of mixtures of urea and water ice, with different dilutions, are displayed in Fig. 7. The mixed ice was formed by simultaneous deposition of water and urea at 30 K. The procedure to grow urea layers, by direct vapor deposition from the oven, does not allow a precise quantification of the amount of deposited urea via pressure reading. For the pure species, the number of urea molecules deposited can be estimated from the IR spectra and the IR band strengths provided in this work. Due to the lack of information on band strengths in urea:H2O ice mixtures, the stoichiometry of the mixtures has been estimated using the IR spectra and the band strengths of the pure species, although changes in the band strengths in mixed ices could be appreciable.30Some band shifts are appreciated in the 2000–1300 cm−1 region, which depend on the concentration of urea. They are illustrated in Fig. 7. The peak positions of the main four bands observed in this region are listed in Table 4. Two of the bands (νNH2 and νCO, dotted straight lines) remain almost unaffected, while the other two (δNH2 and νCN, dashed straight lines with arrows) shift to higher frequencies. The bending mode of NH2 and the stretching mode of CN shift by about 23 cm−1 and 36 cm−1, respectively, from pure urea ice to a water ice with 7% of urea.
| Band assignment | Peak (cm−1) | ||||
|---|---|---|---|---|---|
| 30 K | 140 K | ||||
| 100% | 67% | 44% | 7% | 44% | |
| ν-NH2 | 1672 | 1666 | 1667 | 1667 | 1666 |
| δ-NH2 | 1626 | 1635 | 1639 | 1649 | 1637 |
| ν-CO | 1594 | 1595 | 1595 | 1595 | 1595 |
| ν-CN | 1454 | 1466 | 1477 | 1489 | 1477 |
We have also investigated a urea:H2O codeposited mixture grown at 140 K. Water ice is expected to form a crystalline phase, although its structure will be altered by the presence of urea in the growing process. The spectral profile in the 2000–1300 cm−1 region of a 44% urea:H2O mixture grown at 140 K is very similar to that of a similar mixture grown at 30 K, as can be seen comparing the two 44% fraction traces (solid and dotted) in Fig. 7. Peak positions are almost the same, as shown in Table 4. This observation is taken as a proof that temperature is not as relevant as concentration in the frequency shifts observed in urea:H2O ice mixtures.
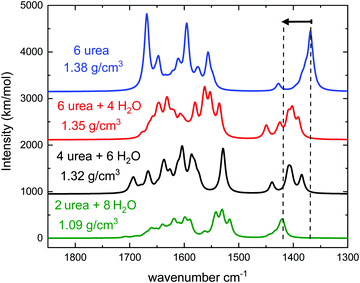
Fig. 8 shows the calculated spectra for pure urea and urea:H2O ices of different stoichiometry. The spectra correspond to simulations of one relaxed amorphous structure except for the more diluted one, where the averaged spectrum obtained from three different configurations of 2 urea: 8 H2O amorphous unit cells is presented. A figure with the individual spectra of each particular structure compared with the average one is given in the ESI,† where the smoothing of the peaks due to the averaging can be appreciated. The greater the number of sampled amorphous structures, the broader the profile of the bands in the averaged spectrum, and the more similar to the amorphous sample experimental band profile.
The calculations predict a blue shift in the frequency of the νCN mode of urea when mixed with water, which has been indicated in Fig. 8 with two dashed lines and an arrow. The shift increases with growing water proportion in the experimental spectra (see Fig. 7) and a similar tendency can be observed in the theoretical ones. For the highest dilution (upper trade in Fig. 7 and lower trace in Fig. 8) the largest shift is found. Vibrational mode visualization shows that in the urea:H2O mixtures hydrogen bonding takes place between the H atoms of the NH2 groups of urea and the oxygen atom in water molecules. This results in a weakening of the N–H bonds, which leads in turn to a strengthening of the C–N bonds and causes the νCN blue-shift observed in the measurements. In Fig. 9 the surface charge distributions and the hydrogen bond network for the most diluted urea:H2O system studied are presented to illustrate the local geometry distribution around the NH2 group.
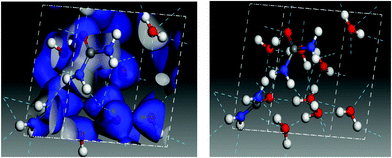 | ||
| Fig. 9 Charge surface plot (left) and hydrogen bond network (right) in an amorphous 2 urea:8 H2O model cell. | ||
5 Conclusions
An amorphous phase of urea is generated by vapour deposition on a cold substrate held at temperatures that range between 10 K and 180 K. The crystalline phase is formed when the deposition surface is at 200 K or above. A transformation from the amorphous to the crystalline phase takes place upon warming the amorphous solid above 245 K. Urea sublimates above 270 K under high vacuum conditions.Apart from the expected broadening of the bands, the most remarkable difference in the infrared spectra of the amorphous form of urea, as compared with its crystalline phase, is a large contribution of νNH2 modes at lower wavenumber, about 3200 cm−1 in the amorphous solid. The simulations performed in this work reproduce nicely that feature and show that the intense absorption at the lower frequency end of the νNH2 absorption band is due to a coupling of the νNH2 symmetric stretching with CO stretching vibrations, a combination that appears in the amorphous structure, but is not so strong in the crystal. Density Functional Theory simulations predict a density for the amorphous solid of 1.38 g cm−3, not far from the known density of the urea crystal (1.32 g cm−3).
Infrared band strengths are provided for amorphous and crystalline urea. The experimental values have an estimated error of 40%. The calculated values are affected by the approximations considered in the DFT model, and it is hard to give an estimation of its error. In spite of the uncertainty, the data given in this work are expected to be useful for an approximate quantification of the possible amount of urea in ices in different astrophysical environments.
The low temperature infrared spectra of urea and urea:H2O mixtures provided in this work may guide the search for this species in astrophysical ices, like those on dust grains in the ISM, or on icy bodies in our Solar System. Some of the infrared bands of urea appear blue shifted in urea:H2O ices, with shifts increasing with growing urea dilution. Over the 10 K to 140 K temperature range, of relevance in astronomical observations, the absorption bands of pure urea ices and of urea:H2O mixed ices hardly change.
Conflicts of interest
There are no conflicts of interest to declare.Acknowledgements
This work was funded by the Ministerio de Economia y Competitividad (MINECO) and the Ministerio de Ciencia e Innovación (MCI) of Spain under grants FIS2016-77726-C3-1-P and PID2020-113084GB-I00, respectively, and by the European Union under grant ERC-2013-Syg-210656-NANOCOSMOS. The computation time provided by the Centro Técnico de Informática, cluster Trueno from CSIC and Centro de Supercomputación de Galicia CESGA is deeply acknowledged.References
- F. Wöhler, Ann. Phys. Chem., 1828, 12, 253 CrossRef.
- R. Keuleers, H. O. Desseyn, B. Rousseau and C. Van Alsenoy, J. Phys. Chem. A, 1999, 103, 4621–4630, DOI:10.1021/jp984180z.
- J. Grdadolnik and Y. Maréchal, J. Mol. Struct., 2002, 615, 177–189, DOI:10.1016/S0022-2860(02)00214-4.
- F. Duvernay, T. Chiavassa, F. Borget and J.-P. Aycard, J. Phys. Chem. A, 2005, 109, 6008–6018, DOI:10.1021/jp051913o.
- J. E. Worsham, H. A. Levy and S. W. Peterson, Acta Crystallogr., 1957, 10, 319–323, DOI:10.1107/S0365110X57000924.
- D. Hadzi, J. Kidric and Z. V. Knezevic, Spectrochim. Acta, 1976, 33, 633–704 Search PubMed.
- R. J. Meier and B. Coussens, J. Mol. Struct., 1992, 253, 25, DOI:10.1016/0166-1280(92)87095-H.
- M. Terasaki, S. Nomoto, H. Mita and A. Shimoyama, Origins Life Evol. Biospheres, 2002, 32, 91, DOI:10.1023/A:1016067303182.
- C. Chyba and C. Sagan, Nature, 1992, 355, 125, DOI:10.1038/355125a0.
- E. Herbst and E. F. Van Dishoeck, Annu. Rev. Astron. Astrophys., 2009, 47, 427, DOI:10.1146/annurev-astro-082708-101654.
- S. A. Sandford, M. Nuevo, P. P. Bera and T. J. Lee, Chem. Rev., 2020, 120, 4616, DOI:10.1021/acs.chemrev.9b00560.
- S. Raunier, T. Chiavassa, F. Duvernay, F. Borget, J. P. Aycard, E. Dartois and L. d’Hendecourt,, A&A, 2004, 416, 165–169, DOI:10.1051/0004-6361:20034558.
- A. Belloche, R. T. Garrod, H. S. P. Müller, K. M. Menten, I. Medvedev, J. Thomas and Z. Kisiel,, A&A, 2019, 628, A10, DOI:10.1051/0004-6361/201935428.
- I. Jimenez-Serra, J. Martín-Pintado, V. M. Rivilla, L. Rodríguez-Almeida, E. R. Alonso, S. Zeng, E. Cocinero, S. Martín, M. Requena-Torres, R. Martín-Domenech and L. Testi,, Astrobiology, 2020, 20, 1048–1066, DOI:10.1089/ast.2019.2125.
- B. Maté, R. Carrasco-Herrera, V. Timón, I. Tanarro, V. J. Herrero, H. Carrascosa, G. M. Muñoz Caro, C. González-Díaz and I. Jiménez-Serra, Astrophys. J., 2021, 909, 123 CrossRef (16pp).
- A. H. Jones, J. Chem. Eng. Data, 1960, 5, 196–200 CrossRef CAS.
- B. Maté, Y. Rodriguez-Lazcano, O. Gálvez, I. Tanarro and R. Escribano, Phys. Chem. Chem. Phys., 2011, 13, 12268–12276, 10.1039/c1cp20899c.
- S. Swaminathan, B. M. Craven and R. K. McMullan, Acta Crystallogr., Sect. B: Struct. Sci., 1984, 40, 300–306, DOI:10.1107/S0108768184002135.
- S. J. Clark, M. D. Segall, C. J. Pickard, P. Hasnip, M. I. J. Probert, K. Refson and M. C. Payne, Zeitschrift für Kristallographie, 2005, 220, 567–570, DOI:10.1524/zkri.220.5.567.65075.
- A. D. Becke, J. Chem. Phys., 1993, 98, 5648–5652, DOI:10.1063/1.464913.
- M. Ferrero, B. Civalleri, M. Rérat, R. Orlando and R. Dovesi, J. Chem. Phys., 2009, 131, 214704, DOI:10.1063/1.3267861.
- S. Grimme, J. Antony, S. Ehrlich and H. Krieg, J. Chem. Phys., 2010, 132, 154104, DOI:10.1063/1.3382344.
- S. Grimme, S. Ehrlich and L. Goerigk, J. Comput. Chem., 2011, 32, 1456–1465, DOI:10.1002/jcc.21759.
- C. J. Pickard, B. Winkler, R. K. Chen, M. C. Payne, M. H. Lee, J. S. Lin, J. A. White, V. Milman and D. Vanderbilt, Phys. Rev. Lett., 2000, 85, 5122–5125, DOI:10.1103/PhysRevLett.85.5122.
- S. Baroni, S. de Gironcoli, A. Dal Corso and P. Giannozzi, Rev. Mod. Phys., 2001, 73, 515–562, DOI:10.1103/RevModPhys.73.515.
- K. Refson, P. R. Tulip and S. J. Clark, Phys. Rev. B: Condens. Matter Mater. Phys., 2006, 73, 155114, DOI:10.1103/PhysRevB.73.155114.
- B. Maté, G. Molpeceres, V. Timón, I. Tanarro, R. Escribano, J. C. Guillemin, J. Cernicharo and V. J. Herrero, Mon. Not. R. Astron. Soc., 2017, 470, 4222–4230, DOI:10.1093/mnras/stx1461.
- R. M. Mastrapa, S. A. Sandford, T. L. Roush, D. P. Cruikshank and C. M. D’Alle Ore, ApJ, 2009, 701, 1347, DOI:10.3847/1538-4357/abdc1f.
- B. Rousseau, C. Van Alsenoy, R. Keuleers and H. O. Desseyn, J. Phys. Chem. A, 1998, 102, 6540–6548, DOI:10.1021/jp981008m.
- G. Molpeceres, M. A. Satorre, J. Ortigoso, A. Zanchet, R. Luna, C. Millan, R. Escribano, I. Tanarro, V. J. Herrero and B. Maté, Mon. Not. R. Astron. Soc., 2017, 466, 1894–1902, DOI:10.1093/mnras/stw3166.
Footnote |
| † Electronic supplementary information (ESI) available. See DOI: 10.1039/d1cp03503g |
| This journal is © the Owner Societies 2021 |

