Organic fluorescent probes for monitoring autophagy in living cells†
Xuechen
Li
b,
Xing
Liang
a,
Junling
Yin
c and
Weiying
Lin
 *ac
*ac
aInstitute of Optical Materials and Chemical Biology, School of Chemistry and Chemical Engineering, Guangxi University, Nanning, Guangxi 530004, P. R. China. E-mail: weiyinglin2013@163.com
bSchool of Chemistry and Chemical Engineering, Qilu University of Technology (Shandong Academy of Sciences), Daxue Road 3501, Changqing District, Jinan 250353, P. R. China
cInstitute of Fluorescent Probes for Biological Imaging, School of Chemistry and Chemical Engineering, School of Materials Science and Engineering, University of Jinan, Jinan, Shandong 250022, P. R. China
First published on 6th November 2020
Abstract
As a ubiquitous degradation process in cells, autophagy plays important roles in various biological activities. However, the abnormality of autophagy is closely related to many diseases, such as aging, neurological disorder, and cancer. Thus, monitoring the process of autophagy in living cells has high significance in biological studies and diagnosis of related diseases. In order to real-time and in situ monitor the process of autophagy, various organic fluorescent probes have been explored in recent years owing to the advantages such as handy staining processes, flexible molecular design strategies, and near-nondestructive detection. However, this interesting and frontier topic has not been reviewed so far. In this tutorial review, we will focus on the latest breakthrough results of organic fluorescent probes in monitoring autophagy of living cells, especially the probe design strategies based on the several microenvironment changes of the autophagy process, and the responding mechanisms and bio-imaging applications in the autophagy process. In addition, we will discuss the shortcomings and limitations of the probes developed, such as susceptible to interference, unable to monitor the whole process, and lack of clinical applications. Finally, we will highlight some challenges and further opportunities in this field. This tutorial review may promote the development of more robust fluorescent probes to further reveal the mechanisms of autophagy, which is the basis of degradation and recycling of cell components.
Key learning points(1) The significance of developing organic fluorescent probes for monitoring autophagy.(2) The design strategies based on the microenvironment changes of the autophagy process. (3) The subcellular targeting tactics for monitoring autophagy. (4) The bio-imaging applications of organic fluorescent probes in visualizing the autophagy process. (5) The challenges and perspectives of organic fluorescent probes for monitoring autophagy in living cells. |
1. Introduction
Autophagy is an important and ubiquitous degradation process in eukaryotic evolution, which enables cells to update their organelles in time and recycle misfolded proteins.1 During this process, the damaged components in cells including organelles and various proteins are first wrapped in a vesicle called sequestration membrane (Fig. 1a).2,3 The sequestration membrane mainly comes from the endoplasmic reticulum and Golgi apparatus, which further forms a double-layer membrane structure, namely the autophagosome (also called initial autophagic vacuoles, Fig. 1b). Then, the outer membrane of autophagosomes can fuse with lysosomes (Fig. 1c), and enzymes in the lysosomes will degrade the contents they cover and intima of autophagosomes to form autolysosomes finally (Fig. 1d). Thus, the metabolic needs of the cells and the renewal of some organelles can be realized through the above autophagy process.4 In the above-mentioned process, the formation of autophagosomes is the key step, which is a vesicle with a diameter of 300–900 nm. Compared with other organelles, the half-life of autophagosomes is very short, indicating that autophagy is an effective response of cells to environmental changes.5 Therefore, as an essential degradation process, autophagy is involved in various biological activities in cells. The normal autophagy regulates many important cellular physiological activities, including pro-death,6 pro-survival,7 antigen presentation,8 the degradation9 and recycling of cell components.10 In addition, autophagy plays an essential role in facing starvation and other kinds of stress. However, the abnormal autophagy of cells will lead to many diseases, such as aging,11 neurological disorder,12 and cancer.13 Thus, monitoring the process of autophagy has high significance in cell biology and medicine.To date, many technologies have been developed to detect the process of autophagy. The traditional methods including transmission electron microscopy (TEM),14 and Western blot based on LC315 and GFP-ATG8/LC316,17 are commonly used. However, they are time-consuming, expensive, complicated, and most importantly they are not suitable for imaging living biological samples. To overcome this bottleneck, many researchers are working to develop new detection methods.18–20 Due to the advantages of simple staining process, good membrane permeability, flexible molecular design strategies, and near-nondestructive detection, organic fluorescent probes have been widely used for monitoring autophagy. Moreover, some fluorescent trackers, such as LysoTracker Red (LTR) and MitoTracker Green (MTG), have been commercialized.21 These probes can target lysosomes or mitochondria to visualize the process of autophagy in living cells. In addition, some probes can specifically accumulate in mitochondria-containing autolysosomes, which is beneficial for revealing the complete process of mitophagy. Furthermore, some current probes can image autophagy through two different fluorescence colors, which is very intuitive and helpful to observe the changes of cell components at various stages in the autophagy process.22 Therefore, organic fluorescent probes have become powerful tools to monitor autophagy in living cells. However, this interesting and frontier topic has not been reviewed so far.
In this review, we will discuss the recent advancements in the development of organic fluorescent probes for detection of autophagy. During autophagy, the cellular microenvironments, including pH, viscosity, polarity, etc., will change because of the differences between the autophagosomes and lysosomes.23 Accordingly, it is a common strategy to design fluorescent probes based on the microenvironmental fluctuations. Particularly the pH variations, as the key factor for the acid hydrolase activity, are used widely.24 According to the design mechanisms, we will divide the probes into four categories, and clarify their design strategies and the response mechanism first. Subsequently, we will introduce their applications in detecting and imaging the process of autophagy in living cells. Meanwhile, their shortcomings and limitations are also summarized, and all the characteristics are shown in Tables S1–S4 (ESI†). Finally, we will highlight the challenges and further opportunities in this field.
2. Fluorescent probes designed based on pH differences
As mentioned above, during autophagy, lysosomes with pH usually less than 5.0 can participate in the process of autophagy through fusion with autophagosomes (pH 5.8–6.2).24 In the process of fusion, the lysosomal pH often changes due to the differences with autophagosomes. Meanwhile, mitophagy is an important and special form of autophagy. During mitophagy, the damaged mitochondria can be removed by autolysosomes to maintain cellular efficient metabolism and reduce the cellular stress caused by aberrant oxidative bursts.25 Under normal conditions, the pH of mitochondria maintains a weak base range (pH ∼ 8.0), and may decrease after mitophagy due to the fusion with autophagosomes and lysosomes. Accordingly, it has become a common strategy to design fluorescent probes for monitoring autophagy by detecting intracellular pH variations, and a number of such fluorescent probes have been reported so far.2.1. Fluorescent probes for monitoring mitophagy
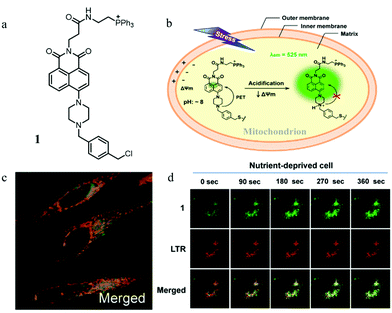
The abnormal change of mitochondrial pH often causes disorder of some physiological activities of cells. In particular, mitochondrial acidification often occurs during mitophagy, which is related to many diseases. Thus, detecting the mitochondrial pH in detail and certain changes during mitophagy can provide insights into the main mitochondrial function both under pathological and physiological conditions. For this, in 2014, Kim et al. developed a fluorescent probe (1) to detect the mitochondrial pH based on the PET (photoinduced electron transfer) mechanism.26 As shown in Fig. 2a, probe 1 contained four moieties: triphenylphosphonium (TPP), naphthalimide, piperazine, and benzyl chloride. As the TPP could target mitochondria via the electrostatic force with the mitochondrial membrane potential (ΔΨm), it was introduced to the probe. Naphthalimide and piperazine were expected to provide the turn on fluorescence signal for acidic pH via the protonation-induced inhibition of the PET process (Fig. 2b). Benzyl chloride could keep the probe 1 fixed to the mitochondria by reacting with thiol proteins even after acidification or ΔΨm vanishes, which could be beneficial for tracking mitophagy. The pH titration experiment confirmed that the fluorescence intensity of probe 1 gradually increased with the decrease of pH, which was consistent with the initial design strategy. Meanwhile, the colocalization experimental results showed that probe 1 could immobilize in mitochondria (Fig. 2c). In order to track the mitophagy, HeLa cells were first starved to damage the mitochondria. As mentioned above, the damaged mitochondria could be swallowed by the autolysosomes during mitophagy, after which the nutrient-deprived cells were stained with both probe 1 and LTR. As shown in Fig. 2d, with the increase of starving time, the green fluorescence from probe 1 enhanced gradually, indicating that the mitochondria had been acidified. Meanwhile, the overlap degree between probe 1 and LTR also increased, and their Pearson's correlation coefficient reached 0.91 from 0.85. However, the Pearson's correlation coefficient of the untreated cells in the control group changed just from 0.87 to 0.84 with the same staining time. These experimental results demonstrated that probe 1 could be used as an excellent probe to monitor mitophagy. The success of this probe is ascribed to its clever design: PET-driven fluorophore to sense pH, mitochondria targeting, and fixation group. Based on this design strategy, it is believed that more desirable probes can be constructed in the future to promote the study of the mitochondrial microenvironment and the diagnosis of related diseases.At present, it is also a feasible strategy to investigate mitophagy by simultaneously imaging mitochondria and lysosomes with two probes. However, the simultaneous use of two different probes makes it difficult to operate and may even fail to detect them synchronously. In addition, current lysosomal probes are not able to specifically identify the autolysosomes that only contain mitochondria. To solve these problems, in 2016, Tan et al. developed a fluorescent probe (HQO) based on cyanine for tracking mitophagy by simultaneous observation of mitochondria and autolysosomes.27 At physiological pH, HQO accumulated in mitochondria, and emitted green fluorescence (Fig. 3a). Once the mitochondria were damaged and fusioned with lysosomes to form autolysosomes, the HQO was protonated to HQOH+ due to the decreased pH in autolysosomes, and emitted red fluorescence (Fig. 3a). In order to investigate the ability of HQO and HQOH+ for tracking mitophagy, the serum-free medium was used to cultivate MCF-7 cells to damage the mitochondria via starving cells. These cells were costained with HQO and LysoTracker Blue (LTB). As shown in Fig. 3b (top), with the increase of starving time, the green fluorescence from HQO decreased and the red fluorescence from HQOH+ enhanced gradually, indicating that the mitochondria had been damaged. Moreover, the distribution of red emission from HQOH+ was consistent with the blue fluorescence from LTB (Fig. 3b (bottom)), which demonstrated that the damaged mitochondria fused with the lysosomes. More importantly, the HQOH+ only accumulated in mitochondria-containing autolysosomes and has not stained other lysosomes. Thus, the probe pair HQO/HQOH+ could be uniquely used to study mitophagy by simultaneously staining mitochondria and autolysosomes. Based on this interesting method, many favorable probes can be designed in the future to accurately measure the pH change at each stage of mitophagy.
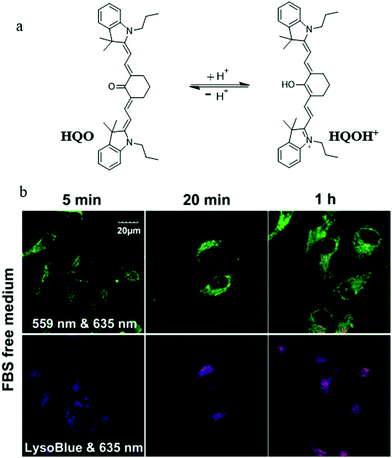 | ||
| Fig. 3 (a) The chemical structure and working mode of probe HQO, (b) the fluorescence images of MCF-7 cells costained with probe HQO (10 μM) and LTB (10 μM) in serum-free medium for different time periods, HQO: Ex = 559 & 635 nm, LTB: Ex = 635 nm. Reproduced from ref. 27 with permission from American Chemical Society, Copyright 2016. | ||
During the imaging of mitophagy, excessive staining concentration of probes may cause mitochondrial polarization and thus mitochondrial injury. Iwashita's group suggested that it is important to investigate mitophagy using probes with lower staining concentrations which may reduce damage to mitochondrial functions. To achieve this aim, in 2017, they reported a novel fluorescent probe (Mtphagy Dye) based on the PET mechanism for visualizing mitophagy with lower concentrations (0.1 μM).28 As shown in Fig. 4a, Mtphagy Dye consisted of a TPP as a mitochondria targeting group and a chloromethyl to keep the probe immobilized within mitochondria even when ΔΨm vanished. In addition, two moieties perylene-3,4-dicarboximide and piperazine were introduced into the probe to respond to pH through the PET mechanism. The colocalization experiment with MitoTracker showed that Mtphagy Dye could exclusively stain mitochondria even after incubating the cell with CCCP for 18 h. To monitor mitophagy, etoposide and rapamycin were used to induce mitophagy of HeLa cells via different mechanisms. Furthermore, GFP-LC3, which could exclusively target autolysosomes, was used to compare with probe Mtphagy Dye. As shown in Fig. 4b, after adding bafilomycin A1 to inhibit mitophagy, the probe Mtphagy Dye almost emitted no fluorescence even after adding CCCP for 18 h, while GFP-LC3 emitted bright green color due to the aggregation of autophagosomes. Also, after incubating the HeLa cells with etoposide and rapamycin to induce mitophagy, parts of the red fluorescence from the probe Mtphagy Dye could overlap with the green fluorescence from GFP-LC3. Taken together, the probe Mtphagy dye could be applied to monitor the process of mitophagy, and the detection accuracy was improved compared with the commercial probe GFP-LC3. However, since the probe only relies on fluorescence intensity in imaging, it may be subjected to external interference such as staining concentrations and laser intensity, so it is still necessary to develop new methods for constructing ratiometric fluorescent probes.
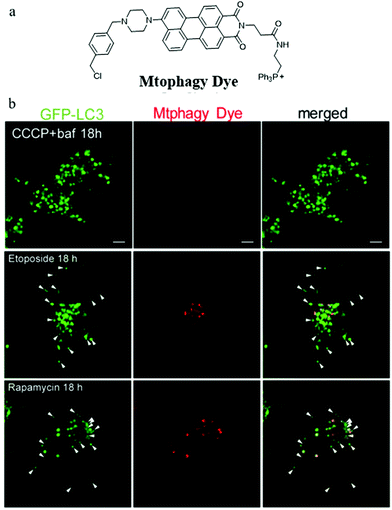 | ||
| Fig. 4 (a) The chemical structure of probe Mtphagy Dye, (b) the fluorescence images of GFP-LC3 expressed HeLa cells incubated with CCCP + bafilomycin A1 (baf), etoposide or rapamycin for 18 h and then stained with probe Mtphagy Dye (0.1 μM). Reproduced from ref. 28 with permission from American Chemical Society, Copyright 2017. | ||
In addition, mitophagy plays a key role in maintaining the mitochondrial quality and quantity in hypoxic microenvironments. Thus, visualizing the whole mitophagy process induced by hypoxia may promote further understanding of the mitochondrial metabolism and reveal the relationship between hypoxic microenvironments and hypoxic-induced mitophagy. To achieve this task, in 2018, according to the pH variations of mitochondria in hypoxic microenvironments, Zhang and co-workers smartly constructed a NIR fluorescent probe (NIR-HMA) for simultaneously visualizing intracellular hypoxia and the consequent mitophagy.29 In the hypoxic microenvironment of cells, the nitrobenzyl group of NIR-HMA was reduced to the amino group by nitroreductase, and then followed by a 1,6-rearrangement elimination reaction to form NIR-MAO with fluorescence at 710 nm (Fig. 5a). In the acid microenvironment, NIR-MAO could transform to NIR-MAOH with an emission at 675 nm, which could be beneficial for tracking autolysosomes. In hypoxic cellular microenvironments, damaged mitochondria are often sequestered into autophagosomes, and then fuse with lysosomes to form acidic autolysosomes. Thus, NIR-HMA was used to monitor the mitophagy, and the Ad-GFP-LC3 (mitophagosomal marker), MTR, and LysoTracker Green (LTG) were employed to co-stain with NIR-HMA, separately. As shown in Fig. 5b, the fluorescence from the red channel of NIR-HMA overlapped well with that of Ad-GFP-LC3, which indicated that the NIR-HMA could monitor mitophagosomes. As shown in Fig. 5c and d, the fluorescence from the green channel of NIR-HMA overlapped well with those of MTG, and LTG, which suggested that NIR-HMA could also track mitochondria-containing autolysosomes originated from mitophagy. Moreover, NIR-HMA could specifically monitor the mitophagy process induced only by hypoxia. In the future, this probe may function as a potential tool for further exploring relevant physiological processes related to hypoxic microenvironments.
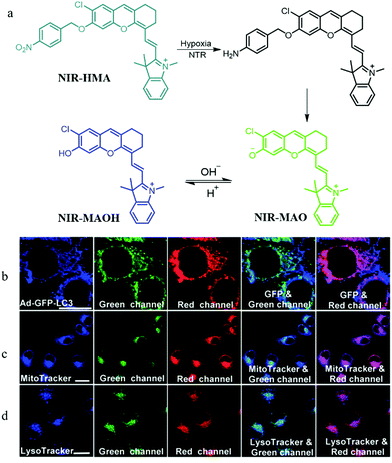 | ||
| Fig. 5 (a) The chemical structure and responding mechanism of probe NIR-HMA, (b–d) the fluorescence images of HeLa cells stained with NIR-HMA (5 μM) and another commercial probes under hypoxia for 6 h. (b) HeLa cells prestained with Ad-GFPLC3 (40, 48 h); (c) HeLa cells then stained with MTG (100 nM, 30 min); (d) HeLa cells then stained with LTG (100 nM, 30 min); NIR-HMA: Ex = 543 nm, Em (green) = 625–680 nm, Ex (red) = 705–760 nm; Ad-GFP-LC3: Ex = 488 nm, Em = 500–550 nm; MTG: Ex = 405 nm, Em = 450–530 nm; LTG: Ex = 405 nm, Em = 425–525 nm; bar = 20 μm. Reproduced from ref. 29 with permission of the Royal Society of Chemistry, copyright 2018. | ||
Lysosomes not only are involved in mitophagy but also play an important role in tumor cell invasion and metastasis because of several vital proteolytic enzymes which are isolated from lysosomal vesicles. Therefore, it is important to develop pH probes for tumor imaging during mitophagy by visualizing the morphology of mitochondria and lysosomes.Toward this, in 2018, Chen's group designed and synthesized a NIR pH responsive fluorescent probe (CyT) for monitoring mitophagy.30 As shown in Fig. 6a, CyT could be protonated to CyTH in the acid environment and its emission would change to the red fluorescence from the green one. In the experiment of tracking mitophagy, the MCF-7 cells were first cultured in serum-free medium and normal medium, respectively, and then co-stained with CyT and LTB. As demonstrated in Fig. 6b, the red fluorescence intensity from CyT in the starving cells was higher than that in the control cells, which indicated that the mitochondria had been acidified. Moreover, with the increase of starving time, the fluorescence intensity ratio of red/green from the probe CyT increased and their distribution gradually overlapped with that of LTB, which indicated again that CyT could be used to visualize the process of mitophagy. More importantly, due to the NIR properties, the probe can be employed as a promising tool for the diagnosis of tumor and mitophagy related diseases in the future. Unfortunately, the probe CyT does not contain positive cation salts, so its targeting force on mitochondria may be susceptible.
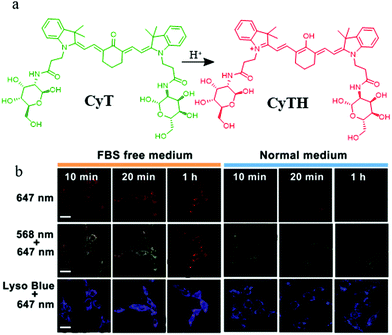 | ||
| Fig. 6 (a) The chemical structure and working mode of the probe CyT, (b) the fluorescence images of MCF-7 cells costained with CyT (100 μM) and LTB in serum-free or normal medium for different time periods, bar: 20 μm. Reproduced from ref. 30 with permission of the Royal Society of Chemistry, copyright 2018. | ||
In fact, there are some disadvantages of the existing pH probes, such as organelle localization, sensitivity, and biocompatibility, which may limit their applications. Thus, it is still required to develop novel probes to monitor pH fluctuations. For instance, in 2019, Wang et al. developed a fluorescent probe (HcP-H) based on hemicyanine for responding to the mitochondrial pH variations during mitophagy.31Hcp-H contained a phenolic hydroxyl as the pH-responsive group and indole quaternary ammonium as the mitochondria-targeting moiety (Fig. 7a). Meanwhile, with the increase in pH, the fluorescence wavelength of HcP-H red-shifted. In the experiment of detecting mitochondrial pH during mitophagy, the HeLa cells were first cultured in serum-free medium to starve the cells, and then stained with both HcP-H and MDC (monodansylcadaverine, a commercial autophagy tracker) (Fig. 7b and c). As shown in Fig. 7c, part of orange fluorescence from HcP-Q overlapped with the green emission from MDC, which confirmed further that the probe could be used to investigate the mitochondrial pH variations during mitophagy. However, due to the lack of mitochondrial targeting groups, the probe may be forced to interrupt the tracking of mitophagy after the ΔΨm vanishes.
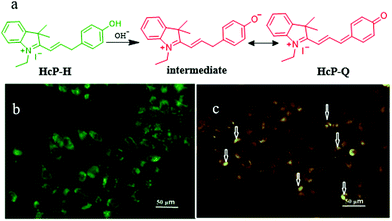 | ||
| Fig. 7 (a) The chemical structure and working mode of the probe HcP-H, and the fluorescence images of HeLa cells costained with 1 μM MDC (b) and probe 5 μM HcP-H (c) in serum-free medium for 40 h, MDC: Ex = 405 nm, Em = 475–550 nm, HcP-H: Ex = 514 nm, Em = 560–600 nm, bar: 50 μm. Reproduced from ref. 31 with permission from Elsevier, copyright 2018. | ||
As previously mentioned, mitochondrial pH is a key parameter for indicating cellular physiological functions, especially mitochondrial acidification from which the occurrence of mitophagy is predicted. Therefore, detecting and tracking the dynamic changes of mitochondrial pH is very important for cell biology research. Compared with the monochromatic fluorescent probes, the ratiometric probes can provide the possibility of self-calibration, which is more effective for excluding interference. For these reasons, in 2019, Ma's team reported a ratiometric mitochondria-immobilized NIR fluorescent pH probe (HXPI-Cl).22 As shown in Fig. 8a, HXPI-Cl was designed based on a hemicyanine skeleton, a pH responsive group hydroxyl, and a mitochondria-immobilized group benzyl chloride. The pH titration experiment results showed that with the increase in pH the fluorescence wavelength of HXPI-Cl red-shifted. The colocalization experiment with Mito Green in HeLa cells confirmed that HXPI-Cl could firmly target mitochondria even after adding CCCP or formaldehyde for 30 min. Next, the HeLa cells were treated with rapamycin to induce mitophagy, and then stained with HXPI-Cl. As shown in Fig. 8b, the average pH value in the normal cells was 8.04 ± 0.13 according to the pH calibration curve, while changed to 7.44 ± 0.33, 6.48 ± 0.26, and 5.58 ± 0.49 with the rapamycin incubated cells for 3, 15, and 24 h. Thus, the pH of mitochondria does decrease during mitophagy. In addition, the same experimental results were obtained in the cells of hypoxia-induced mitophagy. In summary, the probe HXPI-Cl could be applied to quantitatively monitor the mitochondrial pH independent of ΔΨm, and track the mitochondrial acidification during mitophagy. Moreover, due to the advantages of convenient synthesis and ratiometric character, HXPI-Cl may serve as a potential tool for exploring the roles of mitochondria in various intracellular physiological and pathological processes in the future.
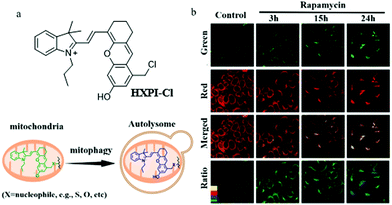 | ||
| Fig. 8 (a) The chemical structure and working mode of probe HXPI-Cl, (b) the fluorescence images of normal and rapamycin-induced HeLa cells stained with probe HXPI-Cl (100 μM), Ex = 635 nm, Em (green) = 655–685 nm, Em (red) = 695–725 nm, bar: 20 μm. Reproduced from ref. 22 with permission from American Chemical Society, Copyright 2019. | ||
Considering the necessity for allowing the facile design of probes, new design mechanisms remain to be developed. Thus, in 2020, based on the intramolecular charge transfer (ICT) mechanism, Zeng et al. designed and synthesized a NIR fluorescent probe (Cy-NH2) for monitoring mitophagy by detecting mitochondrial pH.32Cy-NH2 contained a cyanine dye, and a primary amine as the pH-responsive group. As shown in Fig. 9a, the primary amine could be protonated in the acid environment and inhibited the ICT process, which could lead to the change of the green emission to NIR fluorescence. To confirm that Cy-HN2 could monitor the mitophagy process, the MCF-7 cells were costained with Cy-NH2 and LTB in the serum-free medium for 2 h, and other cells were treated with the normal medium as the control group. From Fig. 9b, the colocalization coefficients between Cy-NH2 and LTB in the control and experimental group were 0.52 and 0.78, respectively, indicating that Cy-NH2 could be used to monitor mitophagy. Furthermore, the ratiometric method used to monitor mitophagy may avoid many external disturbances to improve the accuracy.
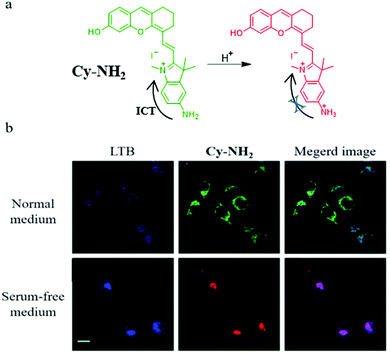 | ||
| Fig. 9 (a) The chemical structure and working mode of probe Cy-NH2, (b) the fluorescence images of MCF-7 cells costained with Cy-NH2 and LTB in normal or serum-free medium for 2 h, LTB: Ex = 405 nm, Em = 470–510 nm, Cy-NH2: Ex = 488 nm, Em = 650–750 nm, bar: 20 μm. Reproduced from ref. 32 with permission of the Royal Society of Chemistry, copyright 2020. | ||
Compared with short wavelength probes, NIR fluorescent probes have many advantages, such as high tissue penetration depth, low background noise, and minimal light damage. Therefore, in 2020, Liu's team constructed two mitochondria-targeting NIR fluorescent probes (Probe A and Probe B) for detecting pH by the ratiometric method.33 The probes were designed based on the TBET (efficient through-bond energy transfer) mechanism, a positively charged cyanine dye was chosen as a donor and the hemicyanine was used as an acceptor. As shown in Fig. 10a, the donor and acceptor were connected by a rhodamine group with a spirolactam, which could mediate the p-conjugation according to the pH value. Meanwhile, the pH titration experiment also demonstrated that the fluorescence wavelength of the probes could red-shift in the acid environment. The colocalization experiment indicated that the two probes could accumulate in mitochondria. Compared with Probe B, Probe A possessed higher TBET efficiency and an appropriate pKa value for autolysosomes, Therefore, Probe A was chosen to study the mitophagy. The HeLa cells were costained with Probe A and Lysosensor blue (LB) in the serum-free medium for 20 min or 2 h. From Fig. 10b, the colocalization coefficient between Probe A and LB was only 0.09 after incubating the cells with serum-free medium for 20 min, and reached 0.88 after 2 h, which indicated that Probe A could be used to track mitophagy. Considering the design mechanism, these two probes could serve as platforms to promote the development of a variety of NIR fluorescent ratiometric probes for visualizing many bio-activities occurring in mitochondria, such as mitophagy, and ΔΨm variations.
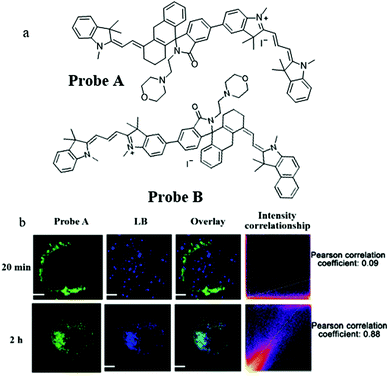 | ||
| Fig. 10 (a) The chemical structures of Probe A and Probe B, (b) the fluorescence images of HeLa cells costained with probe A and LB in serum-free medium for 20 min or 2 h, bar: 10 μm. Reproduced from ref. 33 with permission of the Royal Society of Chemistry, copyright 2020. | ||
2.2. Fluorescent probes for monitoring autophagy
In order to understand the autophagy process of cells, designing small-molecule fluorescence molecules to visualize autophagosomes is a feasible strategy. For examples, the MDC and CYTO-ID dyes have been commercialized. However, the low specificity as well as the unknown staining mechanism may limit their applications. To develop more practical probes, in 2018, Iwashita's team developed two fluorescent probes (DALGreen and DAPGreen) based on the PET mechanism to visualize autophagy in cells (Fig. 11a).34 Among these two probes, DALGreen could respond to acidic pH by enhancing its fluorescence, which was beneficial for monitoring the autophagy of the late-phase. As shown in Fig. 11b, after treating the cells with rapamycin for 4 h to induce autophagy, the colocalization experiment indicated that DALGreen could stain autolysosomes, while the DAPGreen stained not only the autolysosomes but also the autophagosomes. Such probes could be useful for exploring the molecular mechanisms during autophagy in the future. However, the monochrome probes may be interfered by some external factors, such as dye concentration and laser intensity.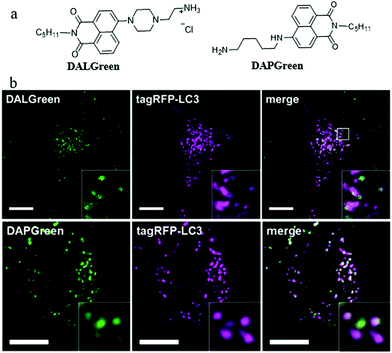 | ||
| Fig. 11 (a) The chemical structures of probes DALGreen and DAPGreen, (b) the fluorescence images of rapamycin treated (4 h) HeLa cells costained with reported probes and the commercial autophagosome probe (tagRFP-LC3), bar: 10 μm. Reproduced from ref. 34 with permission of the John Wiley & Sons Ltd, copyright 2018. | ||
To overcome the external interference in the monochromatic probes, the development of ratiometric probes is a very effective strategy. In addition, two-photon (TP) fluorescent probes can enhance spatial resolution during autophagy detection. For these reasons, in 2019, Meng et al. designed a TP fluorescent ratiometric probe (Lyso-MPCB) based on p-methoxyphenylacetylene substituted carbazole for visualizing autophagy via monitoring the lysosomal pH (Fig. 12a).35 Benzimidazole and morpholine were introduced to the probe as the pH-responsive moiety and lysosome-targeting group, respectively. The colocalization experiment showed that Lyso-MPCB could exclusively target lysosomes. Meanwhile, the cellular pH variation was detected by Lyso-MPCB with a ratiometric method: the ratio of Igreen/Iblue decreased when the pH was changed from 3.0 to 8.0. In consideration of the fact that the cellular pH would fluctuate during autophagy, the probe Lyso-MPCB was used to monitor autophagy in cells. The MCF-7 cells stained with Lyso-MPCB were cultured in a medium without nutrients for 4 h to induce autophagy. As shown in Fig. 12b, the fluorescence signals both in the green and blue channel did not show any obvious changes in the first 1 hour. With the increase of the inducing time, the distribution range and average level of pseudocolor became larger. These experimental results confirmed that the lysosomes were migrated and its pH decreased in the later 3 hours. In summary, the probe Lyso-MPCB displayed a linear relationship with pH variations both in solution and living cells, and could be used as an effective tool for real-time visualizing autophagy via detecting the lysosomal pH changes. More importantly, this ratiometric method can avoid the interference of many external factors.
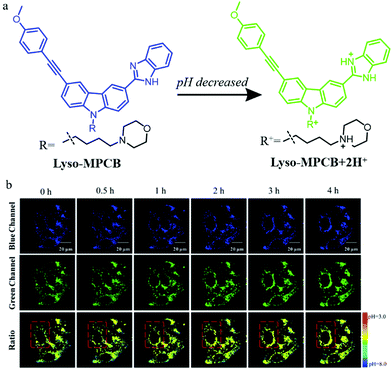 | ||
| Fig. 12 (a) The chemical structure and working mode of probe Lyso-MPCB, (b) the TP fluorescence images of MCF-7 cells stained with probe Lyso-MPCB (10 μM, 30 min) in bovine serum-free medium for different time periods, Ex (TP) = 760 nm, Em (blue) = 400–420 nm, Em (green) = 465–485 nm. Reproduced from ref. 35 with permission of the Royal Society of Chemistry, copyright 2019. | ||
As mentioned above, both lysosomal and intracytoplasmic pH play important roles in the autophagy process, so simultaneously detecting pH in the lysosomes and cytoplasm is of great significance for the study of autophagy. To achieve this task, the probes should stain both the lysosomes and cytoplasm, and sense the acid and neutral ranges of pH, respectively. To address this issue, in 2019, Lin et al. constructed a ratiometric fluorescent probe (Cyto-Lyso) to monitor autophagy by visualizing the pH variations both in the lysosomes and cytoplasm.36 As shown in Fig. 13a, a 7-hydroxylcoumarin group and an amino-rhodamine moiety were introduced into Cyto-Lyso to respond to neutral and acid pH, respectively, and showed different fluorescence colors. In addition, as a weak basic group, the amide was decorated onto the probe to make sure that Cyto-Lyso could stain both lysosomes and cytoplasm. The colocalization experiments demonstrated that the Cyto-Lyso could target lysosomes with the red signal, and distributed in the cytoplasm with the blue fluorescence. This favorable dual-site controlled property endowed Cyto-Lyso with the potential ability to visualize autophagy by detecting pH changes. To further advance this work, the live HepG2 cells were stained with Cyto-Lyso and then incubated with PBS buffer to induce autophagy by starving these cells. As shown in Fig. 13b and c, with the increasing of starving time, the red fluorescence enhanced gradually, while, the control cells showed strong blue fluorescence, which indicated that the staining location of Cyto-Lyso migrated to the lysosomes from the cytoplasm during autophagy. Thus, the process of autophagy was monitored by this way. Notably, Cyto-Lyso was the first dual-site controlled probe to monitor autophagy, which may provide guidance for designing other dual-site controlled fluorescent probes to track the whole process of autophagy in the future.
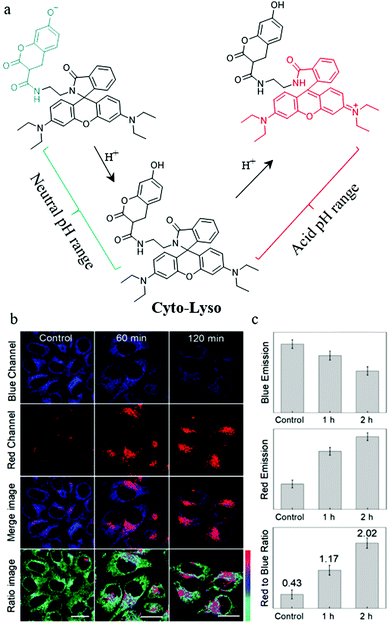 | ||
| Fig. 13 (a) The chemical structure and working mode of probe Cyto-Lyso, (b) the fluorescence images of HepG2 cells stained with probe Cyto-Lyso (5 μM, 30 min) and then treated with culture medium for different time periods, (c) the fluorescence intensity ratio of the red to blue channel of the corresponding groups of the cells. Reproduced from ref. 36 with permission of the Royal Society of Chemistry, copyright 2019. | ||
To date, most of the lysosome-targetable pH probes are used to monitor autophagy, while they contain weakly basic nitrogen-involving side chains, which may display an “alkalizing effect” for lysosomes. To avoid this effect, in 2020, Dong's team constructed a pH-responsive fluorescent probe (RML) based on rhodamine B fluorophores and introduced a methylcarbitol unit for targeting lysosomes.37 The probe RML could respond to pH by switching the spirocyclic ring of rhodamine B to adjust its conjugated structure (Fig. 14a). The pH titration experiment showed that the fluorescence intensity of RML increased more than 148-fold with the pH changed from 7.40 to 4.40. Also, the colocalization experiment demonstrated that RML could exclusively target lysosomes and detect the pH variation, which provided favorable conditions for further tracing autophagy. The HeLa cells were stained with RML in serum-free medium for 4 h, and the fluorescence intensity of RML increased gradually with the increase of the starving time, which indicated that lysosomal pH decreased during cellular autophagy (Fig. 14b). Moreover, the fluorescence intensity of RML in HeLa cells cultured with normal medium or treated with 3-methyladenine (3-MA) to inhibit autophagy did not enhance (Fig. 14b). These results verified that the probe RML could be used for monitoring the autophagy in the living cells. Moreover, RML may be a potential tool to investigate the lysosome-associated physiological activities. However, the monochrome nature of RML may cause some external interference, which needs to be overcome for further improvement.
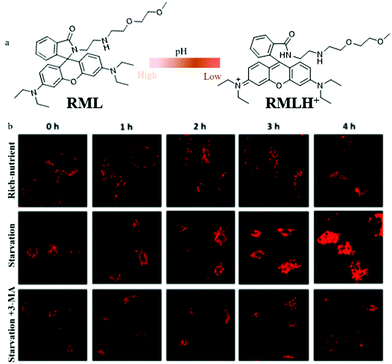 | ||
| Fig. 14 (a) The chemical structure and working mode of probe RML, (b) the fluorescence images of HeLa cells stained with probe RML (10 μM, 10 min) in different cultured media: rich-nutrient (normal medium), starvation (serum-free medium), autophagy inhibited condition (3-MA, 100 μM), Ex = 561 nm, Em = 568–650 nm. Reproduced from ref. 37 with permission of the Royal Society of Chemistry, copyright 2020. | ||
3. Fluorescent probes designed based on the viscosity differences
In general, viscosity variations can regulate essentially all intracellular diffusion-mediated processes, including the autophagy. As two vital organelles during the autophagy process, especially mitophagy, lysosomes and mitochondria are characterized with specific viscosity, which plays in turn key roles in their functions, such as biospecies degradation and ATP generation. Thus, besides pH, their viscosity also changes during the membrane-fusion process in cellular autophagy. Therefore, it is a feasible strategy to design fluorescent probes to visualize autophagy based on viscosity differences.3.1. Fluorescent probes for monitoring mitophagy
In recent years, fluorescent probes based on the aggregation-induced emission (AIE) mechanism have been applied widely in bio-imaging due to their excellent photostability. The fluorescence of AIE probes will enhance due to the restriction of intramolecular motion in the aggregation or viscosity medium. Thus, it is desirable to design AIE-type probes to detect viscosity differences and thus explore mitophagy. For instance, in 2018, Jiang et al. reported two AIE fluorescent probes (MitoAIE1, LysoAIE2) with good water-solubility for detecting the mitochondrial and lysosomal viscosity, respectively.38 As shown in Fig. 15a, pyridium and indolium were introduced to MitoAIE1 and LysoAIE2 as the targeting moieties for mitochondria and lysosomes, respectively. In addition, two hydroxyls were added to the probes to improve the water-solubility. MitoAIE1 and LysoAIE2 displayed sensitive responses to mitochondrial and lysosomal viscosity, respectively, which led them to the possibility of being used for monitoring mitophagy. The HeLa cells were cultured in the serum-free medium to induce mitophagy by starving cells, and then stained with MitoAIE1 and LysoAIE2, respectively. As shown in Fig. 15b, with the increase of starving time, the fluorescence intensity of the two probes enhanced slightly. The above experimental results confirmed that both MitoAIE1 and LysoAIE2, could be applied to monitor mitophagy. More importantly, the high water solubility of the probes reduced background noise and improved the accuracy of viscosity detection. However, the development of the corresponding ratiometric fluorescent probes is still necessary to further improve the detection accuracy.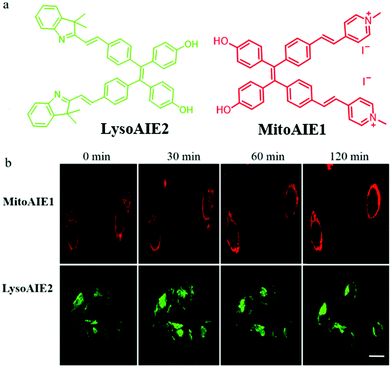 | ||
| Fig. 15 (a) The chemical structure of probes MitoAIE1 and LysoAIE2, (b) the fluorescence images of HeLa cells stained with probes MitoAIE1 or LysoAIE2 in serum-free medium for different times, bar = 20 μm. Reproduced from ref. 38 with permission from American Chemical Society, Copyright 2018. | ||
NIR fluorescent probes have become powerful tools to monitor the levels of bio-targets, especially in imaging organisms, due to their advantages including high penetration depth and low background noise. Thus, developing NIR probes can avoid many distractions in imaging, such as spontaneous fluorescence and light toxicity. For these reasons, in 2019, Liu's group reported a NIR mitochondria-targeting fluorescent probe (NI-VIS) for detecting viscosity.39NI-VIS displayed a maximum emission peak at 670 nm and responded to the viscosity environment with a 167-fold enhanced fluorescence (Fig. 16a). In addition, the cell and tissue imaging experiments indicated that NI-VIS could exclusively accumulate in the mitochondria, and detected mitochondrial viscosity via reflecting mitochondrial swelling induced by the interruption of the ionic balance. Moreover, NI-VIS was used to monitor the mitochondrial viscosity during mitophagy. The HeLa cells were cultured in serum-free medium to induce mitophagy by starving cells and stained with NI-VIS. As shown in Fig. 16b and c, compared with the cells cultured with the normal medium, the fluorescence intensity of NI-VIS from the starved cells decreased obviously. These data demonstrated that the mitochondrial viscosity decreased during mitophagy, and the probe NI-VIS could be applied to monitor mitophagy. However, according to the reports in the literature,40,41 the mitochondrial viscosity could increase during mitophagy. Therefore, the monochromatic fluorescent probes may be interfered by many external factors during the detection process. This suggests again the necessity of developing ratiometric fluorescent probes.
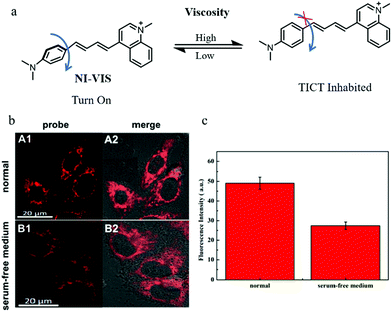 | ||
| Fig. 16 (a) The chemical structure and working mode of probe NI-VIS, (b) the fluorescence images of HeLa cells stained with probe NI-VIS (10 μM, 10 min) in different cultured media: normal medium (A), serum-free medium (B), Ex = 560 nm, Em = 600–800 nm, (c) average fluorescence intensity of NI-VIS changes under different cultured media in region b. Reproduced from ref. 39 with permission from American Chemical Society, Copyright 2019. | ||
Mitochondrial viscosity is an important indicator of mitochondrial function. The abnormal change of mitochondrial viscosity can induce disorder of the mitochondrial network by mechanical or osmotic means. Thus, visualizing mitochondrial viscosity during mitophagy may provide insight into the mechanism of mitochondrial bio-activities. Yang's team hypothesized that the damaged mitochondria could evolve into autophagosomes during mitophagy due to the aggravation of the burden of degradation, resulting in the change of viscosity. To confirm this, in 2019, they exploited a mitochondria-targeting molecular rotor (BMVC) to image mitochondrial viscosity during autophagy (Fig. 17a).40 The cell imaging experiments demonstrated that BMVC could accumulate in the mitochondria, and displayed enhanced fluorescent intensity with the increase of mitochondrial viscosity. To study the ability of BMVC to monitor mitophagy, HeLa cells were co-incubated with BMVC and LTR (a commercial lysosome probe) in serum-free medium for different time periods. As shown in Fig. 17b, the overlap degree of the two probes enlarged gradually with the increase of starving time, indicating that autophagosomes containing mitochondria were fused by lysosomes during the process of mitophagy. Moreover, compared with the cells starved for 0.5 h, the fluorescence intensity of BMVC in the cells starved for 2 h enhanced, which demonstrated that the mitochondrial viscosity increased during mitophagy. In addition, the same phenomena were observed in other two kinds of cells (HEK 293 and L02 cell lines), which demonstrated that the universality of the increased viscosity level during autophagy in a wide range of cell kinds. These results supported the original hypothesis, and the probe is expected to be employed to explore the physiological and pathological activities related to the mitochondrial microenvironments. However, there are some limitations in the practical applications of sensing mitochondrial viscosity only depending on changes in fluorescence intensity, especially the interference of external factors.
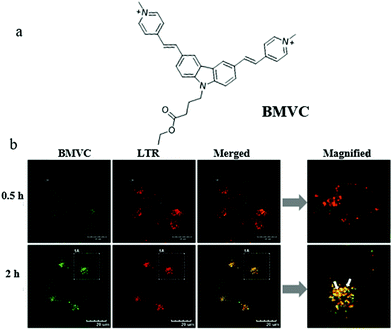 | ||
| Fig. 17 (a) The chemical structure of probe BMVC, (b) fluorescence images of HeLa cells costained with BMVC and LTR (10 μM) in serum-free medium for different times, bar = 20 μm. Reproduced from ref. 40 with permission from American Chemical Society, Copyright 2019. | ||
3.2. Fluorescent probes for monitoring autophagy
As mentioned above, monochromatic probes that detect autophagy based on changes in fluorescence intensity are subjected to multiple external factors. Fluorescence lifetime imaging microscopy (FLIM) can provide the fluorescence lifetime of probes to avoid the above defects. However, there have been no reports of such fluorescent probes until 2018. In this year, Meng’ group reported a TP fluorescent probe (Lyso-NP) for imaging lysosomal viscosity via fluorescence lifetime (Fig. 18a).41 Dimethylaminobenzene and morpholine were introduced to the probe as the viscosity-responsive and lysosome-targeting group, respectively. The water/glycerol system was used to study the response of Lyso-NP to viscosity. As shown in Fig. 18b, the fluorescence lifetime of Lyso-NP displayed a nice linear relationship with viscosity. In addition, the colocalization experiments confirmed that the probe could specifically target lysosomes in living cells. The cells were treated with Hank's Balanced Salt Solution (HBSS) or 3-MA to induce or inhibit autophagy, respectively. As displayed in Fig. 18c, the fluorescence lifetime of Lyso-NP increased from 1513 to 1710 ps, reflecting the change in the viscosity value from 46.37 to 63.47 cP during the autophagy. However, the fluorescence lifetime of Lyso-NP in the cells treated with 3-MA did not increase. Notably, the Lyso-NP was the first probe to analyze lysosomal viscosity during autophagy based on the fluorescence lifetime, which provided new guidance for the development of more desirable fluorescent probes to monitor the whole process of autophagy.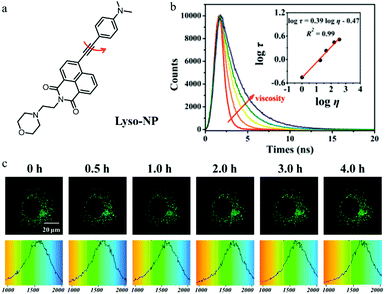 | ||
Fig. 18 (a) The chemical structure of probe Lyso-NP, (b) fluorescence lifetime spectrum of Lyso-NP (10 μM) in the water/glycerol system, Em = 535 nm. Inset: The linear relationship between log![[thin space (1/6-em)]](https://www.rsc.org/images/entities/char_2009.gif) τ and log τ and log![[thin space (1/6-em)]](https://www.rsc.org/images/entities/char_2009.gif) η, R2 = 0.98, χ = 0.39, (c) TP fluorescent lifetime images of MCF-7 cells stained with Lyso-NP (10 μM) in HBSS, Ex = 860 nm, Em = 520–550 nm, bar = 20 μm. Reproduced from ref. 41 with permission from American Chemical Society, Copyright 2018. η, R2 = 0.98, χ = 0.39, (c) TP fluorescent lifetime images of MCF-7 cells stained with Lyso-NP (10 μM) in HBSS, Ex = 860 nm, Em = 520–550 nm, bar = 20 μm. Reproduced from ref. 41 with permission from American Chemical Society, Copyright 2018. | ||
4. Fluorescent probes designed based on the polarity differences
In addition to the pH and viscosity, the lysosomal and mitochondrial polarity may greatly change because of the differences between the lysosomes, mitochondria, and autophagosomes during the fusion process in autophagy. Therefore, monitoring the lysosomal and mitochondrial polarity variations can be exploited to design fluorescent probes for monitoring mitophagy and autophagy.4.1. Fluorescent probes for monitoring mitophagy
As mentioned above, a number of small-molecule fluorescent probes have been reported to indicate the decreased pH and increased viscosity in the process of mitophagy. However, the polarity variations in this process are still unclear. To address this problem, in 2020, Ma and co-workers designed and synthesized a NIR fluorescent probe (HXPI-P) for monitoring the mitochondrial polarity during mitophagy (Fig. 19a).42 The fluorescence of the probe blue-shifted with the increase of the solvent polarity. The Pearson's coefficient between HXPI-P and Mito Green was up to 0.97, which indicated that probe HXPI-P could exclusively accumulate in mitochondria. Meanwhile, HXPI-P emitted redder fluorescence in the cancer cells (HeLa and HepG2) than that in the normal cells (HFL-1 and L-O2), which showed that the polarity in normal cells was higher. To study the change of mitochondrial polarity during mitophagy, HFL-1 cells were co-incubated with HXPI-P and MDC (a commercial autophagy probe) in the serum-free medium for different time periods. As shown in Fig. 19b, the fluorescence intensity of MDC enhanced gradually with the increase of starving time, suggesting that mitophagy was induced by the nutrient deprivation. Moreover, the fluorescence intensity ratio of HXPI-P between the red and green channel increased gradually. This result demonstrated that mitochondrial polarity decreased during mitophagy, and the same phenomenon was observed in the rapamycin-induced cells. Taken together, the above results confirmed the utility of HXPI-P for tracking mitophagy via visualizing mitochondrial polarity by the ratiometric method. Moreover, the probe may become a promising detection tool for mitophagy-related research in the future.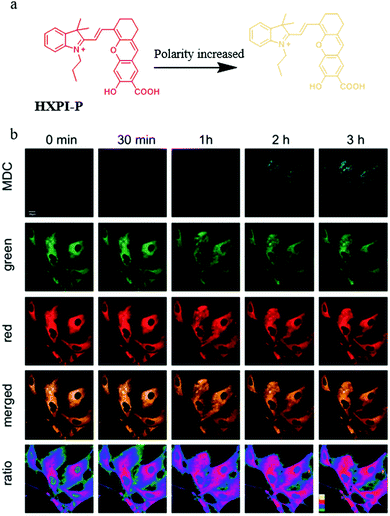 | ||
| Fig. 19 (a) The chemical structure and working mode of probe HXPI-P, (b) the fluorescence images of HFL-1 cells costained with probe HXPI-P (10 μM, 10 min) and MDC in serum-free medium for different time periods, MDC: Ex = 405 nm, Em = 450–550 nm, HXPI-P: Ex = 635 nm, Em (green)= 655–685 nm, Em (red) = 700–730 nm, bar = 20 μm. Reproduced from ref. 42 with permission of the Royal Society of Chemistry, copyright 2020. | ||
4.2. Fluorescent probes for monitoring autophagy
In recent years, TP fluorescent probes have been widely used in bio-imaging due to their advantages of low phototoxicity, high signal-to-noise ratio, and high penetration depth. Considering the change of polarity during autophagy, the TP fluorescent probe that can detect lysosomal polarity could become an effective tool to investigate autophagy. In 2017, Meng et al engineered the first TP probe (Lyso-OC) for monitoring cell autophagy by detecting the variation of lysosomal polarity during the membrane fusion process of autophagy (Fig. 20a).43 Coumarin and morpholine were introduced to the probe as the polarity-responsive and lysosome-targeting groups, respectively. The H2O/THF system was used to test in vitro the polarity-responsiveness of Lyso-OC, and the fluorescence intensity of Lyso-OC enhanced gradually with the decrease of polarity, along with a ∼30 nm blue-shift. In addition, the results of the cell imaging showed that Lyso-OC could exclusively target the lysosomes and displayed enhanced fluorescence after incubating the cells with DMSO within 1 h. To investigate the ability of Lyso-OC to monitor autophagy, MCF-7 cells were stained with Lyso-OC under different culture media (nutrient rich, starvation, and starvation + 3-MA) for different times (0–4 h). As shown in Fig. 20b, the fluorescence intensity of Lyso-OC decreased gradually with the increase of the starving time, which indicated that the lysosomal polarity increased during cellular autophagy. Moreover, the fluorescence intensity of Lyso-OC almost did not change in the MCF-7 cells cultured with the normal medium or treated 3-MA to inhibit autophagy (Fig. 20b). Notably, Lyso-OC was the first TP fluorescent probe used for monitoring autophagy in the living cells via detecting lysosomal polarity. By further improving the design strategy to construct the ratiometric probes of this type, the external interference in the detection process can be prominently avoided.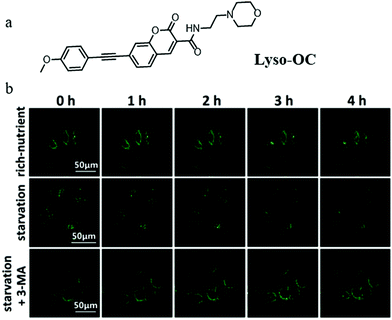 | ||
| Fig. 20 (a) The chemical structure of probe Lyso-OC, (b) the fluorescence images of MCF-7 cells stained with probe Lyso-OC (10 μM, 45 min) in different cultured media: rich-nutrient (normal medium), starvation (serum-free medium), autophagy inhibited condition (3-MA), Ex = 760 nm, Em = 490–550 nm. Reproduced from ref. 43 with permission of the Royal Society of Chemistry, copyright 2017. | ||
Although several probes have been used to detect autophagy in real-time, their applications are limited by low imaging resolution and low fluorescence intensity. To solve these problems, developing probes with strong fluorescence that can clearly monitor autophagy in complex environments is a favorable strategy. To achieve this aim, in 2019, Meng and co-workers reported another TP probe (Lyso-OSC) for monitoring cell autophagy (Fig. 21a).44 Compared with Lyso-OC, the 1-vinyl-4-methoxybenzene group was introduced to the probe Lyso-OSC as a donor to form the D–A structure with morpholine, and to improve the TP cross-section by enlarging the conjugated system of quinolone. The colocalization experiment with LTR confirmed that Lyso-OSC could accumulate in the lysosomes, and displayed enhanced fluorescence intensity with the decrease of lysosomal polarity. To monitor the lysosomal polarity during autophagy, the MCF-7 cells were stained with Lyso-OSC in the serum-free medium for 4 h, and the fluorescence intensity of Lyso-OSC decreased gradually with the increase of the starving time, which indicated that lysosomal polarity increased during cellular autophagy (Fig. 21b). By contrast, the fluorescence intensity of Lyso-OSC in MCF-7 cells cultured with the normal medium or treated with 3-MA to inhibit autophagy did not show any change (Fig. 21b). These results showed that Lyso-OSC could be used to monitor the lysosomal polarity during autophagy. Moreover, Lyso-OSC displayed large TP absorption cross-section (254 GM) and deep tissue penetration depth (150 μm), which would be helpful for applications in imaging at complex biological circumstances. These excellent properties make the probe Lyso-OSC a potential platform for further developing more comprehensive probes, such as the TP ratiometric probes. According to the results reported in the above literature studies, the polarity of mitochondria would decrease while that of lysosomes would increase during the process of autophagy. In general, the increase of cholesterol, sphingomyelin, and other liposomes in the membrane composition would lead to the decrease of the bio-membrane's polarity. Thus, these components may be changed in the fusion process of mitochondria and lysosomes during autophagy, which could result in the variation of their polarity. However, robust fluorescent probes need to be developed to investigate and explore the specific composition changes.
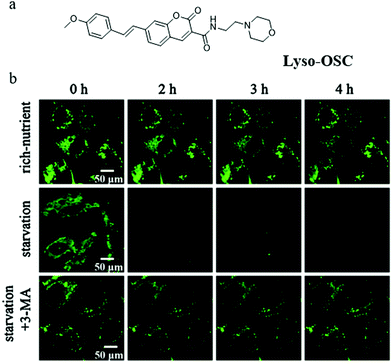 | ||
| Fig. 21 (a) The chemical structure of probe Lyso-OSC, (b) the fluorescence images of MCF-7 cells stained with probe Lyso-OSC (5.0 mmol L−1) in different cultured media: rich-nutrient (normal medium), starvation (serum-free medium), autophagy inhibited condition (starvation + 3-MA), Ex = 820 nm, Em = 490–550 nm. Reproduced from ref. 44 with permission of the Elsevier, copyright 2019. | ||
5. Fluorescent probes designed based on other mechanisms
5.1. Fluorescent probes for tracking mitophagy
In the recent reports, based on the electrostatic interaction between probes and ΔΨm, many probes can accumulate in a mitochondrion with high specificity. However, the specificity may lose when the ΔΨm is disrupted.45 Thus, besides the above methods of designing fluorescent probes according to the differences in the microenvironment, many researchers have also designed mitochondria-tracers to monitor mitophagy via tracking the mitochondrial changes. In 2015, Tang and Zheng et al. designed a mitochondrial fluorescent tracker (TPE-Py-NCS) with AIE character for monitoring mitophagy.46 As shown in Fig. 22a, TPE-Py-NCS was made up of three moieties: tetraphenylvinyl (a classic AIE unit), pyridine cationic salt, and an isothiocyanate group. The pyridine cationic salt was introduced as a targeting group for mitochondria via the electrostatic force with the ΔΨm. The isothiocyanate could keep the probe TPE-Py-NCS fixed to the mitochondria by reacting with amino or thiol proteins even when ΔΨm decreased or vanished. The cell imaging experiments confirmed that TPE-Py-NCS could specifically target the mitochondria even after ΔΨm vanished, which was helpful for tracking mitophagy. In order to investigate the ability of TPE-Py-NCS to monitor mitophagy, rapamycin was used to induce mitophagy in the HeLa cells. And then these cells were costained with TPE-Py-NCS and LTR, and the results are shown in Fig. 22b. A new red fluorescent spot from LTR appeared at 73.5 min and overlapped with a mitochondrial yellow fluorescence from TPE-Py-NCS. This phenomenon implied that the acidic autophagosome was formed, which moved to the mitochondria for initiating the mitophagy. At 79.5 min, this red spot disappeared, which suggested the completion of the mitophagy process. Above all, the probe TPE-Py-NCS could be used as a powerful tool for tracking the whole mitophagy process independent of ΔΨm. Meanwhile, considering the ultra-strong photostability brought by the AIE character, this probe is very suitable for tracking the mitophagy process for a long time.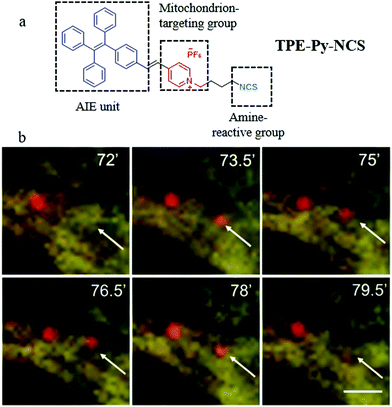 | ||
| Fig. 22 (a) The chemical structure and working mode of probe TPE-Py-NCS, (b) the fluorescence images of HeLa cells incubated with rapamycin (50 mg mL−1) for different timed and then costained with probe TPE-Py-NCS (5 μM, yellow) and LTR (150 nM, red), bar = 2 μm. Reproduced from ref. 46 with permission of the Royal Society of Chemistry, copyright 2015. | ||
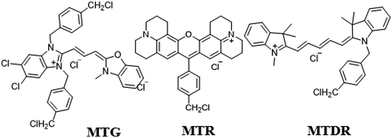
In addition, some commercial mitochondrial trackers, such as MTG, MTR (MitoTracker Red), and MitoTracker Deep Red FM (MTDR, Fig. 23), are often used to monitor mitophagy. They contain the benzyl chloride moiety which could keep the probe immobilized to the mitochondria by reacting with thiol proteins even when ΔΨm vanishes. In 2016, Lemasters and co-workers used MTG to monitor mitophagy.21 The rat hepatocytes were cultured in KRH plus glucagon to induce mitophagy, and then costained with MTG and LTR. The experimental results showed that a red fluorescent spot from LTR appeared at 77 min and overlapped with the green fluorescence from MTG, which indicated the transformation of the mitochondria into autophagosomes or autolysosomes. At 86 min, this red spot disappeared, which indicated that the mitophagy process was finished. Thus, combined with the lysosomal probe LTR, the MTG was used to successfully monitor the autophagosomal proliferation during mitophagy. However, some defects including monochromatic nature, complicated operation, and low photostability still limit its application.
As mentioned above, these MitoTracker probes could realize tracking of mitochondrial changes independent of ΔΨm based on chemical reactions. However, such reactions would damage mitochondrial proteins. Therefore, it is still challenging to develop reaction-free probes for tracking and visualizing mitophagy independent of ΔΨm. To solve this problem, in 2019, Yu and Tang et al. designed and synthesized two “reaction-free” mitochondrial probes (ECPI-12 and IVPI-12) for the first time,47 which could trace mitochondria over a long time without damaging mitochondrial proteins. Both ECPI-12 and IVPI-12 were modified with a pyridine cationic salt and a long alkyl chain (C12-alkyl, Fig. 24a). As a mitochondria-targeting group, the pyridine cationic salt was introduced to the probe for accumulating in the mitochondria, and the C12-alkyl chains were used for firmly locating to the mitochondria via the strong hydrophobic interaction with the mitochondrial lipid bilayer membrane. As designed, the two probes could specifically target mitochondria even after ΔΨm disappeared. In addition, the MTT experiment showed that ECPI-12 and IVPI-12 had lower toxicity than MTDR, indicating that the hydrophobic interaction was more moderate for the mitochondria than the chemical reaction. To track the process of mitophagy, the HeLa cells were stained with ECPI-12/IVPI-12 and LTDR, and then treated with CCCP (10 μM) and pepstatin A (10 μM) to induce mitophagy. As shown in Fig. 24b and c, the fluorescence signal of ECPI-12 gradually overlapped with that of LTDR with the increase of mitophagy time, and their colocalization coefficients increased from 0.15 to 0.81. Meanwhile, similar experimental results were obtained in the HeLa cells stained with IVPI-12. Such results confirmed that ECPI-12 and IVPI-12 could realize in situ and real-time tracking mitophagy in the living cells. Moreover, to verify the feasibility of the above design strategy, two control molecules (ECPI-2 and IVPI-2) with shorter alkyl chains were synthesized (Fig. 24a). However, both ECPI-2 and IVPI-2 could not target mitochondria after the ΔΨm disappeared. This result further confirmed the feasibility of the long alkyl chain strategy in the design of reaction-free mitochondrial tracers. Notably, this work designed the probes to trace mitochondria in a non-chemical manner for the first time, which may provide new guidance for the further development of fluorescent probes of this type.
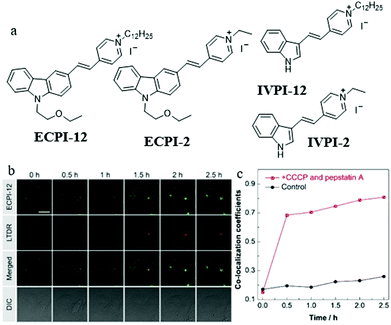 | ||
| Fig. 24 (a) Chemical structures of ECPI-12, IVPI-12, ECPI-2, and IVPI-2, (b) the fluorescence images of HeLa cells costained with ECPI-12 (0.2 μM) and LTDR (0.2 μM), and then treated with CCCP (10 μM) and pepstatin A (7.5 μM) for different times, bar = 20 μm, (c) co-localization coefficients of ECPI-12 with LTDR in control and mitophagy HeLa cells. Reproduced from ref. 47 with permission of the Royal Society of Chemistry, copyright 2019. | ||
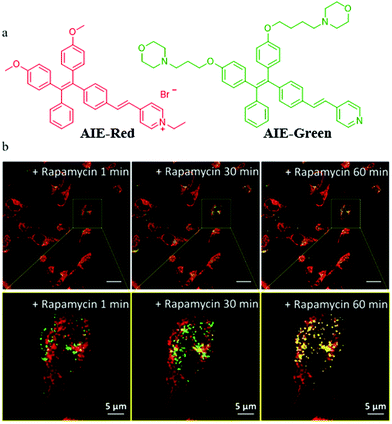
In addition to the design of mitochondrial trackers, multicolor imaging is also a desirable method for mitophagy detection. In order to reduce the complexity of fluorescence imaging and simplify instrument operation, the probes that could emit at different fluorescence colors with a single excitation wavelength are very valuable. However, current reports on such fluorescent probes are very limited. In 2018, Liu's team developed two AIE fluorescent probes (AIE-Red and AIE-Green) to monitor cellular organelles in a multicolour manner with a single wavelength excitation and visualize the process of mitophagy (Fig. 25a).48AIE-Red and AIE-Green could target mitochondria with the red fluorescence, and the lysosomes with the green fluorescence, respectively. Then, the two probes were used to multicolor monitor the mitochondria and lysosomes during mitophagy. The HeLa cells were costained with AIE-Red and AIE-Green, and subsequently incubated with rapamycin to induce mitophagy. As shown in Fig. 25b, the overlapped degree of AIE-Red and AIE-Green increased gradually with the increase of the rapamycin incubation time. Meanwhile, the Pearson's correlation coefficient between AIE-Red and AIE-Green increased from 0.23 to 0.46 with the incubation time being changed from 1 to 60 min. These results confirmed that the two probes AIE-Red and AIE-Green visualized the process of mitophagy by multicolor fluorescence. Moreover, the two probes could be excited by the excitation light at a single wavelength (405 nm), which was more convenient compared to the traditional methods. It is believed that based on this research, more desirable single fluorescent probes that can emit different colors of fluorescence under a single excitation light may be designed in the future.
5.2. Fluorescent probes for monitoring autophagy
Autophagy is a self-degradation process to protect cells from damage such as oxidative stress and starvation. The oxidative stress is mainly regulated through reactive oxygen species (ROS) including H2O2. Given this phenomenon, in 2016, Peng and co-workers developed a NIR fluorescent probe (Cy-B) to monitor the process of autophagy in the living cells via detecting H2O2.49 As a turn-on probe, Cy-B emitted bright fluorescence when encountered H2O2 because the borate moiety could be oxidized to the phenol group (Fig. 26A). Then the probe Cy-B was used to investigate the autophagy process in living cells. The MCF-7 cells were stained with Cy-B first and then treated with rapamycin to induce autophagy. As shown in Fig. 26B, bright fluorescence was observed in the rapamycin treated cells, while no fluorescence emitted in the control cells from the blank group. This experimental result demonstrated that probe Cy-B could help in visualizing the autophagy process by lighting up the generated H2O2. Moreover, the NIR nature of the probe also allows it to clearly image mouse tissue, which enables it to be a powerful tool for studying H2O2-related diseases.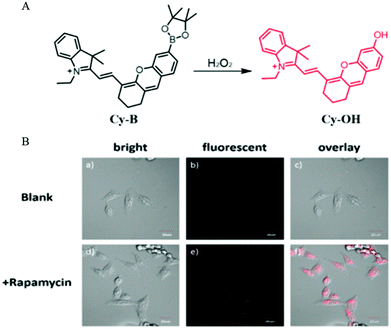 | ||
| Fig. 26 (A) The chemical structure and responding mechanism to H2O2 of Cy-B; (B) the fluorescence images and the corresponding enlarged images of HeLa cells stained with Cy-B (2.5 μM, 15 min) and then treated without (a–c) or with rapamycin (250 nM) for 90 min (d–f), Ex = 635 nm, Em = 700–750 nm, bar = 20 μm. Reproduced from ref. 49 with permission of the Royal Society of Chemistry, copyright 2016. | ||
In addition, with a nucleic acid secondary structure, G-quadruplexes are widely dispersed in many essential nuclear genomes. During the process of autophagy, the G-quadruplexes in damaged mitochondria could be packaged by autophagosomes and then fused with lysosomes for degradation. Accordingly, in 2019, Sun and Tang et al. chose the G-quadruplex as the target for monitoring autophagy, and developed three fluorescent probes (DMOTY, FMOTY1, and FMOTY2, Fig. 27a).50 Among the three probes, DMOTY displayed better optical performance in recognizing G-quadruplexes, and could locate in lysosomes. Thus, DMOTY was used to further study the process of autophagy in the living cells. The HeLa cells were incubated with the serum-free medium or rapamycin to induce autophagy, and bafilomycin A1 was added to inhibit autophagy. Then, these HeLa cells were stained with DMOTY, and the lysosomes were labelled by LTR. As shown in Fig. 27b, the yellow fluorescence (merged by DMOTY and LTR) increased gradually in the autophagy cells, indicating that the fluorescence intensity of DMOTY enhanced in the autophagy process. However, an opposite phenomenon was observed in the autophagy-inhibited cells. The above experiments demonstrated that the probe DMOTY could visualize the autophagy by recognizing G-quadruplexes, which endowed DMOTY with the potential ability to be a powerful probe for autophagy research.
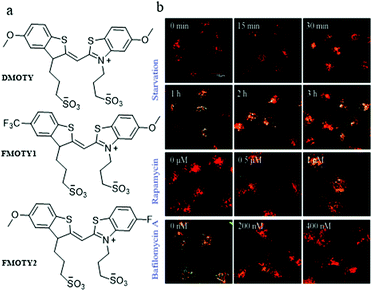 | ||
| Fig. 27 (a) The chemical structures of DMOTY, FMOTY1 and FMOTY2; (b) the fluorescence images of HeLa cells costained with DMOTY (10 μM, Ex = 405 nm) and LTR (50 nM, Ex = 559 nm), and then treated with serum-free medium, rapamycin or serum-free medium + bafilomycin A1; bar = 10 μm. Reproduced from ref. 50 with permission of the Royal Society of Chemistry, copyright 2019. | ||
6. Conclusions and perspectives
As mentioned above, normal autophagy in cells contributes to the completion of the cell-self metabolic needs and the renewal of certain organelles, while abnormal autophagy shows a close relationship to various diseases. Thus, monitoring the dynamic changes of the autophagy process is of great value for biological research and clinical diagnosis of related diseases. To date, considerable progress has been made in the development of organic fluorescent probes for real-time monitoring the autophagy process in living cells. In this tutorial review, we summarized the design concept, detection mechanism, and advantages and limitations of these probes. At present, most fluorescent probes are designed based on microenvironmental differences, such as pH, viscosity, and polarity, in the process of autophagy. Among them, some probes target only the mitochondria-containing autophagosomes and do not stain other lysosomes, which greatly improves the accuracy of mitophagy monitoring. Especially, some ratiometric probes can display different fluorescence colors with the changes of microenvironments, and thus the autophagy process at different stages could be monitored intuitively just with a single probe. Meanwhile, a variety of mitochondrial trackers have been designed to long term track the mitophagy process. Moreover, some NIR and TP probes have been developed for further use in tissue imaging, which will help to advance the application of the probes in clinical diagnosis. In summary, the researchers have developed various organic fluorescent probes to monitor autophagy in living cells and have achieved great success.Despite such exciting progress in developing organic fluorescent probes for investigating the changes of autophagy, there are still few unmet challenges that need to be overcome. First of all, for monitoring mitophagy, the current probes that can be fixed on the mitochondria are basically monochrome, which are easy to be interfered by the external factors. However, most ratiometric probes lack mitochondrial anchoring moieties, because of which they cannot ensure that they still target mitochondria after the ΔΨm disappears. Thus, ratiometric fluorescent probes that can track mitophagy independent of -ΔΨm are urgently needed. At the same time, when selecting the anchoring groups of mitochondria, the non-reactive binding mode should be considered to reduce the cytotoxicity. Second, for monitoring the autophagy in living cells, most of the organic fluorescent probes are designed to target lysosomes. As mentioned above, the process of autophagy involves four steps, while the lysosomes participate in this process at the third step. Thus, these probes can only monitor half of the process of autophagy. Therefore, it is very valuable to design fluorescent probes that helps to monitor the whole autophagy process in living cells. Finally, the abnormality of autophagy is closely related to a variety of diseases. However, there is still a challenge for the clinical application of the fluorescent probes. There is still a long way to go before the fluorescent probes can be used as a powerful tool in the diagnosis of clinical diseases. Thus, it is still an urgent task to explore new design and response mechanisms to develop more functional fluorescent probes.
Conflicts of interest
There are no conflicts to declare.Acknowledgements
This work was financially supported by NSFC (21877048, 22077048, and 21672083), the startup fund of Guangxi University (A3040051003), and the Taishan Scholar Foundation (TS201511041).Notes and references
- J. J. Lum, R. J. DeBerardinis and C. B. Thompson, Nat. Rev. Mol. Cell Biol., 2005, 6, 439–448 CrossRef CAS.
- C.-W. Wang and D. J. Klionsky, Mol. Med., 2003, 9, 65–76 CAS.
- M. B. Azad, Y. Chen, E. S. Henson, J. Cizeau, E. McMillan-Ward, S. J. Israels and S. B. Gibson, Autophagy, 2008, 4, 195–204 CrossRef CAS.
- D. Gozuacik and A. Kimchi, Oncogene, 2004, 23, 2891–2906 CrossRef CAS.
- A. J. Meijer and P. Codogno, Int. J. Biochem. Cell Biol., 2004, 36, 2445–2462 CrossRef CAS.
- Y. Ni, S. Wu, X. Wang, G. Zhu, X. Chen, Y. Ding and W. Jiang, J. Cell. Biochem., 2018, 119, 6104–6112 CrossRef CAS.
- N. Santana-Codina, L. Muixi, R. Foj, R. Sanz-Pamplona, M. Badia-Villanueva, A. Abramowicz, A. Marce-Grau, A. M. Cosialls, J. Gil, I. Archilla, L. Pedrosa, J. Gonzalez, I. Aldecoa and A. Sierra, Neuro-Oncology, 2020, 22, 652–664 CrossRef.
- R. M. B. Teles, A. T. Dang, P. T. Liu, A. Choi, A. Legaspi, E. N. Sarno, M. T. Ochoa, K. Parvatiyar, G. Cheng, M. Gilliet, B. R. Bloom and R. L. Modlin, JCI Insight, 2019, 8, e126955 Search PubMed.
- L. N. Meliton, X. Zhu, M. Brown, Y. Epshtein, T. Kawasaki, E. Letsiou and S. M. Dudek, Microvasc. Res., 2020, 129, 103954 CrossRef CAS.
- R. D. V. Richard and S. Marshall, Annu. Rev. Plant Biol., 2018, 69, 173–208 CrossRef.
- Z. Wang, Y. Shi, W. Chen, H. Wei and J. Shang, Cell Biochem. Funct., 2020, 38, 792–800 CrossRef CAS.
- R. A. Nixon and D. S. Yang, CSH Perspect. Biol., 2012, 4, a008839 Search PubMed.
- W. Qi, X. Zhou, J. Wang, K. Zhang, Y. Zhou, S. Chen, S. Nie and M. Xie, Carbohydr. Polym., 2020, 237, 116113 CrossRef CAS.
- J. D. Smith and E. D. Harven, J. Virol., 1978, 26, 102–109 CrossRef CAS.
- A. Kuma, M. Matsui and N. Mizushima, Autophagy, 2007, 3, 323–328 CrossRef CAS.
- N. Sun, D. Malide, J. Liu, I. I. Rovira, C. A. Combs and T. Finkel, Nat. Protoc., 2017, 12, 1576–1587 CrossRef CAS.
- I. Kim, S. Rodriguez-Enriquez and J. J. Lemasters, Arch. Biochem. Biophys., 2007, 462, 245–253 CrossRef CAS.
- S. S. Li, M. Zhang, J. H. Wang, F. Yang, B. Kang, J. J. Xu and H. Y. Chen, Anal. Chem., 2019, 91, 8398–8405 CrossRef CAS.
- Y. X. Lin, Y. Wang and H. Wang, Small, 2017, 13, 1700996 CrossRef.
- G. Niu, R. Zhang, X. Shi, H. Park, S. Xie, R. T. K. Kwok, J. W. Y. Lam and B. Z. Tang, TrAC, Trend Anal. Chem., 2020, 123, 115769 CrossRef CAS.
- S. Rodriguez-Enriquez, I. Kim, R. T. Currin and J. J. Lemasters, Autophagy, 2006, 2, 39–46 CrossRef CAS.
- X. Li, Y. Hu, X. Li and H. Ma, Anal. Chem., 2019, 91, 11409–11416 CrossRef CAS.
- H. Koga, M. Martinez-Vicente, F. Macian, V. V. Verkhusha and A. M. Cuervo, Nat. Commun., 2011, 2, 386 CrossRef.
- D. H. Kwon, L. Kim and H. K. Song, Autophagy, 2019, 15, 180–181 CrossRef CAS.
- N. J. Dolman, K. M. Chambers, B. Mandavilli, R. H. Batchelor and M. S. Janes, Autophagy, 2013, 9, 1653–1662 CrossRef CAS.
- M. H. Lee, N. Park, C. Yi, J. H. Han, J. H. Hong, K. P. Kim, D. H. Kang, J. L. Sessler, C. Kang and J. S. Kim, J. Am. Chem. Soc., 2014, 136, 14136–14142 CrossRef CAS.
- Y. Liu, J. Zhou, L. Wang, X. Hu, X. Liu, M. Liu, Z. Cao, D. Shangguan and W. Tan, J. Am. Chem. Soc., 2016, 138, 12368–12374 CrossRef CAS.
- H. Iwashita, S. Torii, N. Nagahora, M. Ishiyama, K. Shioji, K. Sasamoto, S. Shimizu and K. Okuma, ACS Chem. Biol., 2017, 12, 2546–2551 CrossRef CAS.
- Y. Liu, L. Teng, L. Chen, H. Ma, H. W. Liu and X. B. Zhang, Chem. Sci., 2018, 9, 5347–5353 RSC.
- L. Gui, Z. Yuan, H. Kassaye, J. Zheng, Y. Yao, F. Wang, Q. He, Y. Shen, L. Liang and H. Chen, Chem. Commun., 2018, 54, 9675–9678 RSC.
- L. Q. Niu, J. Huang, Z. J. Yan, Y. H. Men, Y. Luo, X. M. Zhou, J. M. Wang and J. H. Wang, Spectrochim. Acta, Part A, 2019, 207, 123–131 CrossRef CAS.
- W. Tang, Y. Dai, B. Gu, M. Liu, Z. Yi, Z. Li, Z. Zhang, H. He and R. Zeng, Analyst, 2020, 145, 1427–1432 RSC.
- S. Xia, J. Wang, Y. Zhang, N. Whisman, J. Bi, T. E. Steenwinkel, S. Wan, J. Medford, M. Tajiri, R. L. Luck, T. Werner and H. Liu, J. Mater. Chem. B, 2020, 8, 1603–1615 RSC.
- H. Iwashita, H. T. Sakurai, N. Nagahora, M. Ishiyama, K. Shioji, K. Sasamoto, K. Okuma, S. Shimizu and Y. Ueno, FEBS Lett., 2018, 592, 559–567 CrossRef CAS.
- P. Ning, L. Hou, Y. Feng, G. Xu, Y. Bai, H. Yu and X. Meng, Chem. Commun., 2019, 55, 1782–1785 RSC.
- M. Tian, C. Liu, B. Dong, Y. Zuo and W. Lin, Chem. Commun., 2019, 55, 10440–10443 RSC.
- X. Wang, L. Fan, Y. Wang, C. Zhang, W. Liang, S. Shuang and C. Dong, J. Mater. Chem. B, 2020, 8, 1466–1471 RSC.
- W. Chen, C. Gao, X. Liu, F. Liu, F. Wang, L. J. Tang and J. H. Jiang, Anal. Chem., 2018, 90, 8736–8741 CrossRef CAS.
- Y. Zhang, Z. Li, W. Hu and Z. Liu, Anal. Chem., 2019, 91, 10302–10309 CrossRef CAS.
- Z. Zou, Q. Yan, S. Ai, P. Qi, H. Yang, Y. Zhang, Z. Qing, L. Zhang, F. Feng and R. Yang, Anal. Chem., 2019, 91, 8574–8581 CrossRef CAS.
- L. Hou, P. Ning, Y. Feng, Y. Ding, L. Bai, L. Li, H. Yu and X. Meng, Anal. Chem., 2018, 90, 7122–7126 CrossRef CAS.
- X. Li, X. Li and H. Ma, Chem. Sci., 2020, 11, 1617–1622 RSC.
- J. Jiang, X. Tian, C. Xu, S. Wang, Y. Feng, M. Chen, H. Yu, M. Zhu and X. Meng, Chem. Commun., 2017, 53, 3645–3648 RSC.
- C. Jiang, L. Li, J. Jiang, L. Hou, G. Fang, Y. Haizhu and X. Meng, Chin. Chem. Lett., 2020, 31, 447–450 CrossRef CAS.
- X. Li, M. Tian, G. Zhang, R. Zhang, R. Feng, L. Guo, X. Yu, N. Zhao and X. He, Anal. Chem., 2017, 89, 3335–3344 CrossRef CAS.
- W. Zhang, R. T. Kwok, Y. Chen, S. Chen, E. Zhao, C. Y. Yu, J. W. Lam, Q. Zheng and B. Z. Tang, Chem. Commun., 2015, 51, 9022–9025 RSC.
- R. Zhang, G. Niu, X. Li, L. Guo, H. Zhang, R. Yang, Y. Chen, X. Yu and B. Z. Tang, Chem. Sci., 2019, 10, 1994–2000 RSC.
- F. Hu, X. Cai, P. N. Manghnani, Kenry, W. Wu and B. Liu, Chem. Sci., 2018, 9, 2756–2761 RSC.
- H. Li, F. Xu, Q. Yao, J. Fan, J. Wang and X. Peng, J. Mater. Chem. B, 2016, 4, 7363 RSC.
- H. Chen, H. Sun, S. Zhang, W. Yan, Q. Li, A. Guan, J. Xiang, M. Liu and Y. Tang, Chem. Commun., 2019, 55, 5060–5063 RSC.
Footnote |
| † Electronic supplementary information (ESI) available. See DOI: 10.1039/d0cs00896f |
| This journal is © The Royal Society of Chemistry 2021 |


