 Open Access Article
The challenges, achievements and applications of submersible superhydrophobic materials†
Yasmin A.
Mehanna
 ab,
Emma
Sadler
 b,
Rebekah L.
Upton
 ab,
Andrew G.
Kempchinsky
 b,
Yao
Lu
 c and
Colin R.
Crick
 *c
*c
aMaterials Innovation Factory, Department of Chemistry, University of Liverpool, Liverpool L69 7ZD, UK
bSchool of Engineering and Materials Science, Queen Mary University of London, Mile End Road, London E1 4NS, UK
cDepartment of Chemistry, School of Biological and Chemical Sciences, Queen Mary University of London, Mile End Road, London E1 4NS, UK. E-mail: c.crick@qmul.ac.uk
First published on 23rd April 2021
Abstract
Superhydrophobic materials have been widely reported throughout the scientific literature. Their properties originate from a highly rough morphology and inherently water repellent surface chemistry. Despite promising an array of functionalities, these materials have seen limited commercial development. This could be attributed to many factors, like material compatibility, low physical resilience, scaling-up complications, etc. In applications where persistent water contact is required, another limitation arises as a major concern, which is the stability of the air layer trapped at the surface when submerged or impacted by water. This review is aimed at examining the diverse array of research focused on monitoring/improving air layer stability, and highlighting the most successful approaches. The reported complexity of monitoring and enhancing air layer stability, in conjunction with the variety of approaches adopted, results in an assortment of suggested routes to achieving success. The review is addressing the challenge of finding a balance between maximising water repulsion and incorporating structures that protect air pockets from removal, along with challenges related to the variant approaches to testing air-layer stability across the research field, and the gap between the achieved progress and the required performance in real-life applications.
1 Introduction
Highly water repellent (superhydrophobic) materials have received significant interest in recent years, due to their emerging potential and future implementation as innovative solutions to overcome real-word challenges.1,2 Many artificial superhydrophobic surfaces are inspired by those found in nature, as numerous plants and insects have evolved natural superhydrophobic coatings over time (outlined in Section 2), for example; the lotus leaf, rice leaves, Salvinia molesta leaves, mosquito eyes, butterfly wings, in addition to many more.3–8 The most widely-recognised natural superhydrophobic surface, firstly reported by Barthlott and Neinhuis, is the lotus leaf (Nelumbo nucifera).4,9 This natural template has given rise to the self-cleaning phenomenon, ‘the Lotus Effect’. The Lotus leaf architecture consists of micro-sized setae, affixed with nano-grooves, both of which are coated in a water-repelling wax. Subsequently, this facilitates an intrinsic mechanism, in which falling rainwater beads into near-spherical droplets and can efficiently clean the leaf surface, removing surface-bound dirt and/or bacteria. The low frictional adhesion of water to the leaf surface enables a beneficial rolling motion, and has received a tremendous amount of interest in the scientific literature, due to the wide range of properties it can give rise to if successfully integrated into synthetic coatings, including; self-cleaning, anti-fouling, drag reduction, anti-corrosion, etc.10–131.1 Superhydrophobic materials fabrication
Throughout the literature, diverse routes of engineering artificial superhydrophobic surfaces have been established, frequently involving the fabrication of biomimetic surfaces via the replication of natural architectures (e.g. using techniques such as soft lithography, moulding and/or templating).6 In general, superhydrophobic materials utilise a combination of multi-scale surface roughness and an intrinsically hydrophobic material/surface coating. Fabrication techniques, therefore, require a method of inducing both surface texturing and surface hydrophobicity, or alternatively, generating both simultaneously. Generally, these techniques fall into two categories; (i) ‘top-down’ techniques which involve the removal/deposition of a bulk material to generate surface roughness and includes techniques, such as; lithography, chemical etching, plasma etching and micro-machining, or (ii) ‘bottom-up’ techniques where surfaces are structured and built-up via the collection of small building blocks (e.g. molecular precursors/nanomaterials), including; chemical vapour deposition, electrospinning and more facile techniques (spray coating, dip coating, spin coating, etc.).14–22 Both classes of techniques have found equal success in fabricating synthetic superhydrophobic surfaces. However, limiting factors relating to complexity, equipment costs and compatible precursor materials can determine the suitability of each technique, specific to the coating/surface requirements.1.2 Wetting models
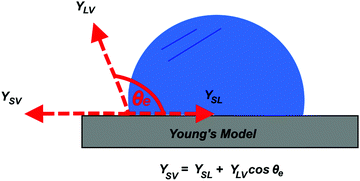
Understanding the inherent wetting behaviour of any given surface is of high importance as it allows for fine-tuning of the surface microstructure to enhance the resultant surface wettability/properties and therefore, govern compatible applications.23 For example, surface coatings which induce water pinning and surface coatings which have very little contact with water, may be more suitable to different applications. To better understand surface wetting, alternate wetting models have been established and are discussed briefly in the following section. | (1) |
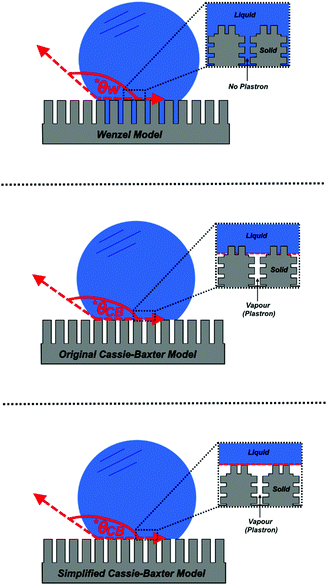
Arguably, no common solid is chemically homogenous and flat. Surfaces generally vary in composition and properties, and therefore, usually contain surface defects/impurities and some extent of surface roughness.26 Surface roughness is fundamental in developing materials which display high water repellence, owed to the fact that flat surfaces engineered from the lowest surface-energy materials (small energy difference between the bulk material and the surface, hence, forming a new solid–liquid interface with water is energetically unfavourable), e.g. –CF3 (6.7 mJ m−2), can only display a maximum WCA of ∼120°.27,28 An exception to this, being, surfaces which experience the Leidenfrost effect (a physical phenomenon that occurs when liquid is deposited onto a high-temperature surface, not solely dependent on surface chemistry/microstructure, see Section 5.2.3) which have been reported to exhibit WCAs nearing 180°, where the droplet effectively ‘levitates’ above the surface.29,30 Young's equation can no longer be used to accurately predict the wetting behaviour of a ‘non-ideal’ surface, as heterogeneous contact beneath the droplet is not accounted for. As a result, alternative wetting models have been proposed to elucidate the wetting behaviours of real-life solid surfaces.31,32
 | (2) |
 | (3) |
| ED= f1γSV − f1γSL + f2γLV | (4) |
 | (5) |
The Cassie–Baxter model can be used to produce exceptionally accurate predictive results, as it aims to describe a wetted interface in detail. However, a comprehensive understanding of how water interacts with any given surface is hard to achieve, as the exact position of the different interfaces cannot be accurately characterised or predicted – particularly for surfaces that do not have repeating structures. As a result, a simplified version of this model has been proposed by Quéré et al., which considers the solid–liquid and liquid–vapour interfaces to be planar, disregarding the roughness factor, and enabling both interfaces to be considered as fractional areas (Fig. 2).36 Both fractional areas can be assigned – ϕS as the solid–liquid interfacial area and 1 − ϕS as the liquid–vapour interfacial area – as the interface is considered planar, the sum of both areas is then equal to 1. This gives rise to the following simplified equation (computing cos![[thin space (1/6-em)]](https://www.rsc.org/images/entities/char_2009.gif) θAIR = −1):
θAIR = −1):
cos![[thin space (1/6-em)]](https://www.rsc.org/images/entities/char_2009.gif) θCB = ϕS θCB = ϕS![[thin space (1/6-em)]](https://www.rsc.org/images/entities/char_2009.gif) cos cos![[thin space (1/6-em)]](https://www.rsc.org/images/entities/char_2009.gif) θe + ϕS − 1 θe + ϕS − 1 | (6) |
1.3 Importance of retained air
Engineering surfaces that adopt a Cassie–Baxter wetting behaviour is necessary for many applications (see Section 7). Various surface functionalities rely on the presence of air retained within the surface microstructure, primarily to provide ‘slippery’ surface conditions. This functionality provides a wide range of promising application areas (e.g. textiles, building and windows, paints and coatings industries, etc.), where a number of synthetic superhydrophobic coatings have already been commercially marketed, e.g. NeverWet self-cleaning coatings.37–39 However, due to their typically low durability, coatings which are designed in the absence of any intrinsic self-healing mechanisms generally exhibit short-term usage before re-application is required to regenerate surface properties.40–43 Retained air plays a crucial role as it contributes heavily to the generic durability and applicational feasibility of superhydrophobic materials. Although the physical resilience of many materials has been investigated throughout the literature, factors other than mechanical durability can contribute to air-layer degradation, as outlined throughout this review. Therefore, the investigation into maintaining a stable Cassie–Baxter state is of high importance if superhydrophobic materials are to be implemented as real-world innovative technologies.It must be noted that, while superhydrophobic surfaces are usually being defined by their high WCAs and low tilt angles and WCA hysteresis, surfaces with high air retention ability don’t always possess these characteristics (i.e. some surfaces with good air layer stability exhibit a ‘pinning effect’ (Section 2.2) where a water droplet sticks to the surface and shows a very high tilt angle).44 For this reason, the use of the ‘superhydrophobic’ term throughout this review mainly refers to the surface being generally water repellent, rather than stating it fits with the conventional definition of superhydrophobic surfaces.
cos![[thin space (1/6-em)]](https://www.rsc.org/images/entities/char_2009.gif) θC = (ϕS − 1)/(r − ϕS) θC = (ϕS − 1)/(r − ϕS) | (7) |
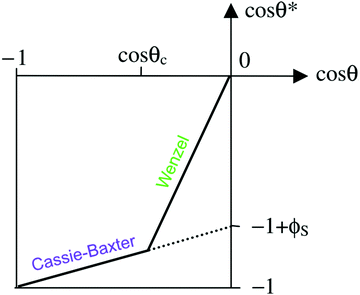 | ||
Fig. 3 A diagram showing the different wetting states that are taken by superhydrophobic surfaces; relating the apparent contact angle (cos![[thin space (1/6-em)]](https://www.rsc.org/images/entities/char_2009.gif) θ*) to the equilibrium contact angle (cos θ*) to the equilibrium contact angle (cos![[thin space (1/6-em)]](https://www.rsc.org/images/entities/char_2009.gif) θ) and the extent of surface roughness/solid surface fraction. The critical contact angle (cos θ) and the extent of surface roughness/solid surface fraction. The critical contact angle (cos![[thin space (1/6-em)]](https://www.rsc.org/images/entities/char_2009.gif) θC) marks the threshold between both wetting states and the dotted line represents a metastable state, in the case that air pockets partially form for surfaces with θ < θC.34 θC) marks the threshold between both wetting states and the dotted line represents a metastable state, in the case that air pockets partially form for surfaces with θ < θC.34 | ||
As the majority of synthetic superhydrophobic coatings are both; (i) extremely textured and (ii) have an equilibrium contact angle that exceeds 90°, the Cassie–Baxter wetting state is primarily assumed. However, the apparent contact angle is heavily dependent upon the solid–liquid fraction and can be seen to readily decrease as the solid–liquid fraction is enhanced (reducing the volume of retained air).44 Using the simplified Cassie–Baxter equation (eqn (6)), a surface with a solid fraction of 10% and θe = ∼120° is predicted to yield an apparent contact angle of ∼160°. Conversely, when the solid fraction is increased to 20% for the same solid material, the expected apparent contact angle is now reduced to ∼150°, highlighting the importance of the liquid–vapour interfacial area. As the apparent contact angle starts to decrease, the surface functionalities will become inhibited, eventually rending the coating unusable.
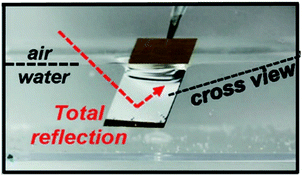 | ||
| Fig. 4 Digital image of superhydrophobic ZnO nanorods submerged in water, highlighting the TIR of light (silvery surface) which occurs at the liquid–vapour interface due to the presence of the plastron. Reproduced with permission from ref. 50. Copyright (2015) NPG Asia Materials. | ||
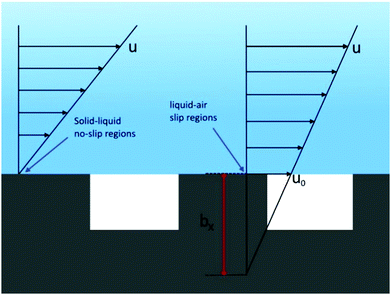
The term ‘plastron’ is commonly used within the biological community and originally evolved to aid the underwater respiration systems of many aquatic insects (Aphelocheirus, Elmidae, etc.), where the entrapment of air within a series of surface textures facilitates oxygen exchange with the surrounding aqueous environment, as discussed in Section 2. The Riffle beetle (Elmidae) is an aquatic insect that is commonly found in streams and is well-documented to have a ‘permanent’ plastron, whereby, plastron regeneration is not necessary.51,52 Translating this to synthetic materials, the entrapped air layer can give rise to many desirable properties/applications, for example, act as a protective barrier to inhibit the wetting of the substrate, which is desirable for the prevention of surface corrosion and/or bacterial adhesion and colonization (see Section 7.2).49,53–55 In addition, the plastron can provide an environment with low friction drag and macroscopic slip, subsequently minimising the contact of an object moving through an aqueous medium (see Section 7.1).40,56–58 Furthermore, the presence of a stable air-layer could be highly relevant to applications were underwater gas-consuming reactions and gas transportation take place (see Section 7.3).59–64
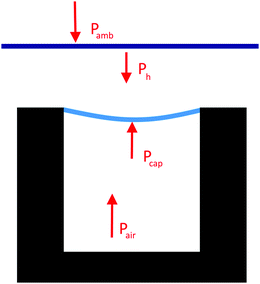
| Ph = ρgh |
| Pcap + Pair = Pamb + Ph |
1.4 A potential target market: the marine sector
A target market where superhydrophobic coatings could be hugely effective is the marine sector.38,66–68 If developed successfully, underwater superhydrophobic coatings could be the solution and driving force behind establishing ‘greener’ technologies within this sector, with many potential applicational areas, which are explored in detail in Section 7. Nonetheless, the market for underwater superhydrophobicity is yet to be effectively infiltrated due to long term underwater superhydrophobicity still being under premature investigation. The longevity of underwater synthetic superhydrophobic coatings is less well explored than that of generic superhydrophobic coatings, which primarily only face susceptibility to chemical and physical degradation. The additional instability of the plastron under dynamic conditions (hydrostatic pressure, contamination, oscillations, pressure fluctuations, etc., see Section 4) can facilitate the displacement of the liquid–vapour interface, via the diffusion of gas into the surrounding aqueous environment (marked by a wetting state transition from the non-wetted Cassie–Baxter state to the wetted Wenzel state).50,69–72 Furthermore, structural and chemical design features can also contribute to rapid plastron decay (see Section 2).71,73 Hence, the exploration of natural designs is fundamental in understanding underwater superhydrophobicity and long term plastron stability.1.5 Review summary
Within this review, the important considerations which must be taken into account when designing underwater superhydrophobic coatings/materials with long-term plastron stability will be discussed. This includes; advanced methods of characterizing the presence of interfacial air to visualize and monitor the stability of the plastron, environmental factors which can limit the plastron lifetime and accelerate the degradation process, a summary of the alternative design/fabrication processes used to produce high performance superhydrophobic surface coatings, and the current targeted underwater applications which the use of superhydrophobic materials are being investigated for within the literature. In doing so, we will draw comparisons between synthetic materials and those found in nature, highlighting the importance of specific design features, in order to achieve long-term underwater stability. Furthermore, the best performing, state-of-the-art superhydrophobic surface coatings which have been fabricated using innovative approaches will be reviewed.2 Underwater stable systems from nature
The natural world is full of examples of plants and insects which have obvious uses of superhydrophobic functionalities (e.g. self-cleaning of Lotus leaves), as well as the ability to maintain an air layer while underwater for different periods, depending on their needs.71,74–78 As many insects have life cycles connected to water, their bodies have evolved accordingly to repel water, which is necessary for their breathing and additional functionality.77 A thorough examination of surfaces found in nature reveals key design features required for air-layer stability underwater. Although environmental conditions (e.g. pressure) play a principal role in determining the air-layer stability (see Section 4), the surface structure/surface chemistry also largely contributes to plastron stability. This is demonstrated by the fact that some insects can retain air for only two days, while others can remain dry underwater for weeks or months.77 Factors associated with surface localised features, such as; size, density, orientation and elasticity, were found to have major effects on protecting the air-layer.71,77,79,80 Examples of well-established natural superhydrophobic surfaces, seen in plants and insects, are discussed below.2.1 Water-bound insects
Many insects are known for their ability to ‘walk on water’, for example, the water spider (Gerris remigis). The ability to stand on the surface of the water is primarily attributed to the high surface tension, owed to the waxy coating often found on the legs of insects (Fig. 6a).74,78 The spider's light bodyweight, accompanied by their long legs relative to their small bodies, make the spider's body carriable by buoyancy and curvature forces associated with water surface tension. In addition, the hydrophobic leg coating further hinders the possibility of breaking the surface tension and dipping inside the water, which supports the spider movement on the surface of water.81–83 However, a closer examination of the legs of the water spider (e.g. via electron microscopy) reveals a surface structure consisting of micron-sized filaments that have a nano-grooved nature (Fig. 6b and c), resulting in a dual-scale roughness.74,84 Studies have revealed that each leg provides a maximal supporting force of 152 dynes, equivalent to 15 times the weight of the entire body.74 Another species of the water spider, Argyroneta aquatica, lives mostly underwater and only returns to the surface to regenerate its stores of oxygen.75,85 The water spider's air supply is carried around its abdomen (Fig. 6d), where it takes air from the surface and brings it beneath where it makes a ‘diving bell’ that stores oxygen for the spider's respiration requirements.85 The surface of its abdomen is covered with similar hydrophobic filaments, which repel water and allow for the retention of air (Fig. 6e–g).75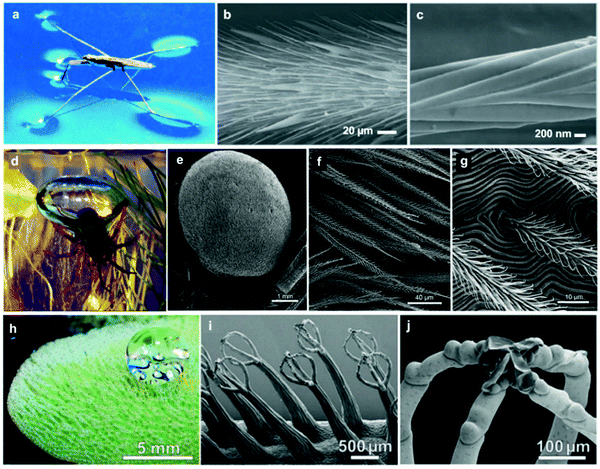 | ||
| Fig. 6 Water-retention examples from nature. Gerris remigis (a) can stand on the water surface due to its highly structured superhydrophobic leg. SEM of the leg shows the micron-sized setae (b) covering the leg structure, and the nano-grooves (c) that each of these features contains. Argyroneta aquatica (d) forms a diving bell underwater for oxygen storage, and the abdomen structure (e–g) provides the necessary hydrophobicity to hold and transform air bubbles. The Salvinia molesta leaf surface (h) is covered with a dense layer of hairy features, which give the surface the superhydrophobic properties. These features, as visualized using SEM (i and j), consist of an egg-beater structure (i), with few dead cells landing on the top part (j). (a) Reproduced with permission from ref. 78. Copyright (2006) Wiley-VCH Verlag GmbH & Co. KGaA. (b and c) Reproduced with permission from ref. 74. Copyright (2004) Nature Publishing Group. (d) Reproduced with permission from ref. 85. Copyright (2011) The Company of Biologists Ltd. (e–g) Reproduced with permission from ref. 75. Copyright (2013) Neumann and Woermann; licensee Springer. (h–j) Reproduced with permission from ref. 71. Copyright (2010) Wiley-VCH Verlag GmbH & Co. KGaA. | ||
The relationship between the morphological structure of the bodies of different air-retaining insects (Galerucella nymphaea, Corixa punctata, Ilyocoris cimicoides, Gerris lacustris, and Notonecta glauca) and the time they can remain submerged underwater, has been reported. Each selected insect was found to have specific air retention mechanisms dictated by the time they needed to stay submerged in water.77 Structural-related differences were noticed, with some insects being covered with tall hairy features, referred to as ‘setae’, which allowed for high air-volume storage (Fig. 7a). On the other hand, smaller features called ‘microtrichia’ were found in other insects, which appeared to be more densely-packed (Fig. 7b).77 When comparing the lifestyles of some of the insect species, it was found that G. nymphaea live on water lily leaves and rarely make contact with water, whereas C. punctata and I. cimicoides remain underwater but travel to the surface regularly to breathe.77,86 All of these insects can retain an air layer for a maximum of two days. After examination of their surfaces, a similar morphology was detected, with a low density of setae (∼1000–4000 structure per mm2 and mean distance ∼10–30 μm) that are 20–35 μm in height.77 In comparison, G. lacustris live mostly on the water surface and only dive for mating and egg-laying.77,87,88 Subsequently, these were found to have a much higher air retention time, reaching that of two weeks. The higher stability of the plastron was linked to; (i) a higher density of setae (∼10![[thin space (1/6-em)]](https://www.rsc.org/images/entities/char_2009.gif) 000 mm−2) and (ii) covering of shorter (∼3–4 μm) and denser (∼1 × 106 mm−2, mean distance ∼0.6 μm) microtrichia.77 Finally, N. glauca, which spend most of their life underwater and can preserve a stable air layer for over 120 days, was found to have a very dense layer (∼2–7 × 106 mm−2) of small microtrichia only.77,89 Although larger setae features can hold a greater air volume, the smaller, yet densely-packed microtrichia, have been demonstrated to store air for a longer period of time (Fig. 7a and b). Hence, it can be concluded that large air volumes are generally of less importance for long-term air retention and that density is more impactful.77 Typically, a feature density of 1–2 × 106 mm−2 with a mean distance below 1 μm is considered to be the minimum requirement for long-time air retention.77 However, having features of dual-size (large setae and smaller microtrichia), could provide double protection against wetting (Fig. 7c and d). In this arrangement, setae can hold a large volume of air under low water pressures, and as pressure starts to increase and the air-layer starts to deplete, microtrichia would still be able to preserve the dry surface beneath.77
000 mm−2) and (ii) covering of shorter (∼3–4 μm) and denser (∼1 × 106 mm−2, mean distance ∼0.6 μm) microtrichia.77 Finally, N. glauca, which spend most of their life underwater and can preserve a stable air layer for over 120 days, was found to have a very dense layer (∼2–7 × 106 mm−2) of small microtrichia only.77,89 Although larger setae features can hold a greater air volume, the smaller, yet densely-packed microtrichia, have been demonstrated to store air for a longer period of time (Fig. 7a and b). Hence, it can be concluded that large air volumes are generally of less importance for long-term air retention and that density is more impactful.77 Typically, a feature density of 1–2 × 106 mm−2 with a mean distance below 1 μm is considered to be the minimum requirement for long-time air retention.77 However, having features of dual-size (large setae and smaller microtrichia), could provide double protection against wetting (Fig. 7c and d). In this arrangement, setae can hold a large volume of air under low water pressures, and as pressure starts to increase and the air-layer starts to deplete, microtrichia would still be able to preserve the dry surface beneath.77
 | ||
| Fig. 7 Air layer stored underwater between setae (a) and microtrichia (b). While larger setae help to store a larger volume of air for a short time, densely-packed microtrichia store a smaller volume of air, but for longer periods. Some insects have a surface design that combines both setae and microtrichia (c and d). In this case, setae can store large air volumes at low water pressures (c). When the pressure goes higher, microtrichia form a second barrier against wetting (d). (a–d) Reproduced with permission from ref. 77. Copyright (2011) Wiley-VCH Verlag GmbH & Co. KGaA. | ||
Although both feature size and packing density are highly important, this is not the only surface property key to aiding long-term air-retention. It has been observed that the surface hair-like features are not completely verticle/perpendicular, but rather are angled towards the surface.77 As setae have an inherent hydrophobic nature, this bending would increase the solid–water contact and decrease the air–water interface. Hence, providing greater support for the water, resulting in higher energy required for wetting the solid surface and displacing air, therefore stabilising the air layer.77,79
2.2 The Salvinia effect
Another example of natural long-term air-retention is found in a fern (Salvinia molesta), in which the leaf can sustain a stable air layer for several weeks during underwater submersion.71,90 As this plant lives on the surface of the water, its air-retention ability becomes important when accidentally immersed in water to maintain its respiration and photosynthesis processes.76 This has been attributed to the external layer of densely packed hair-like features on the leaf surface (Fig. 6h).71,76,91,92 Each microscale feature has an egg-beater-like structure that is formed by four connected multicellular hairs (Fig. 6i and j), where the tip of each feature has four dead cells that are hydrophilic, on the otherwise intrinsically hydrophobic hair.71 While the hydrophobic parts repel water to the surface and protect the air layer beneath, the hydrophilic tips get attracted towards the water. This attraction results in what is known as ‘Salvinia effect’ or ‘pinning effect’, in which the hydrophilic tips remain attached to a water droplet when it is being pulled away, effectively pinning the air–water interface (Fig. 8).71 This effect was found to be the reason for the high air-retention ability, as it minimizes local pressure fluctuations, and hence, increases the energy needed for the trapped air to be released.71 | ||
| Fig. 8 Air-retention of a Salvinia leaf, (a) shows the repellence of water by the hydrophobic hairs, while (b) shows the ‘pinning effect’ of the hydrophilic tips when a water droplet is being pulled away from the surface. (a and b) Reproduced with permission from ref. 71. Copyright (2010) Wiley-VCH Verlag GmbH & Co. KGaA. | ||
In addition to the distinguished feature structure and their hydrophilic-tip/hydrophobic body nature, the elasticity/flexibility of the hairs were found to play a role in stabilizing the air layer in Salvinia leaves. In regular surfaces, changes in local pressure lead to the displacement of the air layer and wetting of the surface. However, in surfaces with elastic features, the air–water interface can move in response to pressure fluctuations, making the air layer stable under higher pressures.71,80
There are numerous examples where natural surfaces exhibit remarkable long-term superhydrophobic properties underwater, where an in-depth study of these surfaces has provided an insight into understanding the factors that contribute to plastron stability and longevity (including; feature size, density elasticity and chemical heterogeneity). These principles have been widely applied also in manufactured surfaces, as detailed in Section 5.
3 Air-layer characterization
Understanding the resilience of air plastrons is key to determine the surface effectiveness and longevity in many applications.93,94 As plastron decay involves a Cassie-to-Wenzel transition, this concept has been utilized as an indication of air-layer stability. Straightforward visualisation of droplet-behaviour has been utilised for both of these major wetting models via WCA measurements.93,95–97 Sole monitoring of WCAs can indicate a Cassie-to-Wenzel transition, as the surfaces in the Wenzel state generally have overall lower values.95 In addition, WCA hysteresis, roll-off angles and bouncing behaviour have all been reported as key differentiators between the two wetting states.36,95,98 In Cassie–Baxter wetting, water droplets show a relatively low adhesion to the surface due to the lower solid–liquid contact caused by the filled air pockets. As a result, droplet shape doesn’t dramatically change during advancing/receding angles measurements, and the hysteresis values for such surfaces tend to be small.98 Contrastingly, Wenzel wetting involves higher contact with the surface and less ‘slipping’ behaviour, resulting in a much higher hysteresis (reaching as high as 100°).98 Following the same theory, roll-off angles are expected to be lower for ‘slippery’ Cassie surfaces, and bouncing behaviour could be demonstrated, in comparison with ‘sticky’ Wenzel wetting where droplet travel on surfaces is reduced.95,98 The principles governing the droplet behaviour apply similarly to water jets impacted on the superhydrophobic surface with a defined angle. In this case, higher water repellency is linked with higher deflection angles of the water jet.99,100Although these conventional characterisation methods have been widely reported, they suffer from many limitations when attempting to track wetting transitions. This is compounded by the uncertainty in defining the three-phase contact line when utilising WCA measurements.101 In addition, some reports showed that measuring WCAs does not always reflect surface micro-wetting changes and that different wetting configurations can show the same WCA/hysteresis reading, which makes accurate tracking of plastron decay challenging.93,102–104 As a way to directly visualize the small-scale wetting, methods such as cryogenic focused ion beam/scanning electron microscopy (cryo-FIB-SEM) have been reported.105 Although such techniques can give an accurate visualization of plastron degradation, they require advanced technology and difficult preparation/operation conditions, in addition to the inability of dynamic tracking of wetting transitions.105
In this section, we give an overview of some methods that have been reported for characterizing air-layer stability. These methods are categorised depending on their operation principle into the following measurements: (i) optical, (ii) force, (iii) acoustic and (iv) electrochemical methods. As most of these techniques are not directly designed for air layer monitoring, the section highlights how they have been adapted to give information on wetting behaviour.
3.1 Optical methods
Light microscopy has been widely reported in the measurement of air retention in superhydrophobic surfaces. Optical methods enable visualization of plastrons, as well as the real-time tracking of their decay. This allows for understanding the effect of immersion time on the lifetime of the air layer.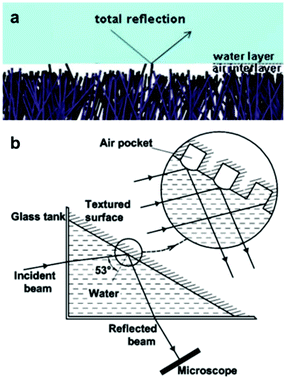 | ||
| Fig. 9 (a) Illustrates the total internal reflection phenomena. (b) A schematic of the setup used to measure reflection intensity. An incident beam gets reflected off the air-layer trapped in an examined surface, and collected/analysed by a microscope. (a) Reproduced with permission from ref. 106. Copyright (2012) The Royal Society of Chemistry). (b) Reproduced with permission from ref. 109. Copyright (2009) American Chemical Society. | ||
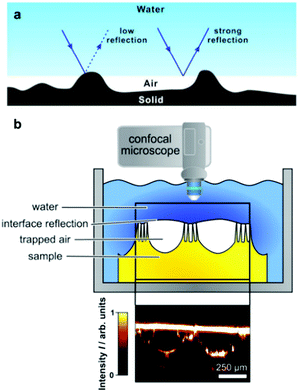 | ||
| Fig. 10 (a) A schematic for the reflection of the laser beam and how it is affected by changing the reflection interface. (b) (above) A schematic of the setup used for the air-layer assessment using LSCM, and (below) a vertical intensity profile of a nanofur sample placed underwater for 7 days. (a) Reproduced with permission from ref. 113. Copyright (2010) Wiley-VCH Verlag GmbH & Co. KGaA. (b) Reproduced with permission from ref. 116. Copyright (2014) Wiley-VCH Verlag GmbH & Co. KGaA. | ||
3.2 Force methods
The following methods depend on force measurement to provide information on air stability. The techniques in this section allow for the estimation of surface wetting and air retention conditions, including water penetration depth and volume of the air retained.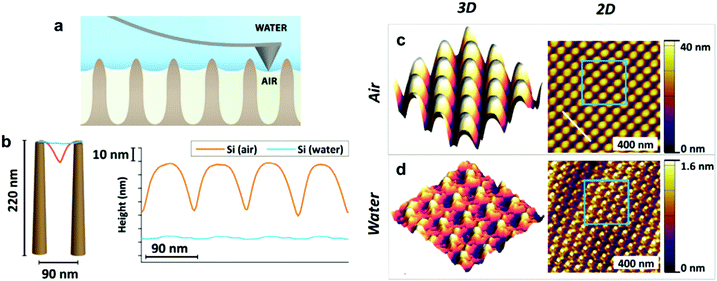 | ||
| Fig. 11 (a) A schematic of measuring the penetration depth using tapping mode in AFM. (b) Shows the cross-section high profile measured by AFM for a sample textured with Si nanopillars, both in air and in water, showing the penetration depth. (c and d) Show the images from which (b) has been constructed. (c) Shows the 3D (left) and 2D (right) images of the nanopillars sample placed in the air, while (d) shows the images for the sample placed underwater. (a–d) Reproduced with permission from ref. 117. Copyright (2018) Elsevier Inc. | ||
For the previous light-based techniques, the visualization was limited to micro-scale structures, as the resolution of optical microscopy hinders observing smaller features.117 In contrast, AFM can be beneficial in getting details on the nano-scale, which Elbourne et al. utilized to map the surface of a Si-nanopillar textured sample.117Fig. 11b shows the cross-section height profile for the sample, which highlights two things: the ability to distinguish nanoscale features and the penetration depth of water into the surface. Fig. 11c and d shows how the height profile has been constructed. The surface was mapped in air and water, and the difference in height detected by the cantilever was used to extract information about surface wettability.117
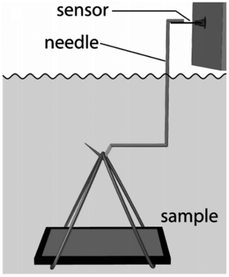 | ||
| Fig. 12 The setup used for buoyancy measurement. Reproduced with permission from ref. 121. Copyright (2014) Mayser et al.; licensee Beilstein-Institut. | ||
3.3 Acoustic methods
The following methods were reported for the detection of different wetting states and their transitions by applying acoustic waves. These methods, although lacking the visual illustration of plastron decay, allow real-time tracking of the average surface wettability changes, which have subsequently provided an understanding of surface properties and air-retention abilities. | ||
| Fig. 13 (a) A schematic for the quartz crystal microbalance. (b) A schematic for the operation principle of detecting wetting states by analysing reflected ultrasound waves. (a and b) Reproduced with permission from ref. 101. Copyright (2019) Wiley-VCH Verlag GmbH & Co. KGaA. | ||
 goes from 1.00 (in air and Cassie state) to 0.86 (during Wenzel wetting).93 For
  , it decreases to 0.86 when the surface is first wetted, and then further to 0.75 during Wenzel wetting, which could be explained by the textures being surrounded with water from the sides.93 In this way, tracking wetting states and transitions can be achieved.
3.4 Electrochemical-based methods
This section highlights many different methods for air layer analysis. The choice of a specific technique is dependent on the type of analysis desired (i.e. precise mapping of the air–water interface or an estimation of the amount of air present), and the compatibility with any external stimuli applied (e.g. submersion pressure or water flow). These two factors (the type of analysis and compatibility) must be considered in conjunction with the tolerance for the complexity of any research project. This multifaceted consideration of analysis techniques has resulted in the diverse array of methods presented in this section.
4 Environmental factors affecting plastrons’ stability
Upon immersion, plastrons are exposed to several factors that can promote the transition from a Cassie–Baxter to a Wenzel state, in addition to the chemical and physical degradation that would usually occur when not submerged in water.91 Underwater degradation can occur under increased hydrostatic pressure, as a result of increased depth or fluid shear forces, in addition to the diffusion of air and other external stimuli. These factors can result in the air–water interface being pushed toward the surface as air is lost from the system. Once the meniscus reaches the bottom of a surface feature, such as a pore, the surface is said to have undergone a transition to a wetted state. These environmental factors have resultantly been utilised to assess the air layer stability, both examining air layer degradation and full wetting transitions.4.1 Pressure
Hydrostatic pressure as a result of increased depth or fluid shear forces is one of the causes of plastron instability, with some surfaces only requiring a small change in pressure to induce a transition.72,91 Over the past decade, a range of experimental and theoretical investigations have focused on understanding the effects of such pressures and the wetting transitions they cause. These studies utilise two main varieties of materials; those with random surface features, and surfaces with ordered/repeating designs. Generally, initial studies in this area focus on the use of indirect optical techniques, in which a wetting transition can be observed by recording intensity as a function of pressure. As a result, any wetting transition occurring as a direct consequence of increased water pressure can be observed without completely resolving the liquid–air interface (Section 3.1).91 For example, Lei et al. submerged polydimethylsiloxane (PDMS) treated transmission gratings within a fluidic chamber, allowing for the observation of diffraction patterns when a laser was passed through the grating.127 As the pressure within the chamber increased, the intensity of the diffraction pattern would decrease (Fig. 14). This results from water replacing air within the grating and the refractive index of PDMS (1.41) being similar to that of water (1.33). | ||
| Fig. 14 Variation of laser diffraction patterns up to a maximum applied pressure of 50 mbar. A decrease in pattern intensity indicates a decrease in trapped air. Reversing the pressure leads to an increased intensity indicating a recoverable transition. Reproduced with permission from ref. 127. Copyright (2009) American Chemical Society. | ||
By gradually decreasing the applied pressure, the gratings were observed to recover their plastrons. A full recovery of the plastron was achieved up to a maximum applied pressure of 50 mbar. However, as this maximum value increased the ability to recover decreased, showing a partial recovery at a maximum pressure of 60 mbar and no recovery when a 100 mbar pressure was applied.112
More commonly, methods utilising the reflective properties of the plastron are used to monitor the transition. Samaha et al. demonstrated the effects of increased hydrostatic pressure on randomly microstructured silicon dioxide-based aerogels.112 Further still, the effect that gas area fraction (GAF, which relates to 1 − ϕS in Section 1) had on plastron stability was investigated. The rate of decrease in light intensity as pressure increased was greater in surfaces with larger GAFs, indicating a higher instability to hydrostatic pressure. In addition, the terminal pressure (i.e. the pressure in which a complete loss of air has occurred) was recorded. For large GAFs, a terminal pressure of ∼100 kPa was reached, this increased to ∼600 kPa (equivalent to ∼60 m underwater depth) when smaller particles were used. Lee et al.106 recorded greyscale images of their submerged W18O49 nanowire arrayed superhydrophobic structures. This allowed a threshold to be applied from which the plastron intensity could be recorded as the ratio of white (dry) to black (wet) pixels. The tungsten oxide nanowires were produced by thermal evaporation and chemical modification with alkyltrichlorosilanes to achieve surfaces with varying surface energies. To understand the effects of hydrostatic pressure on the plastrons stability, the wires were submerged underwater. At all depths, the air layer remained intact for a period before rapidly decaying. As shown in Fig. 15, as the immersion depth increased, the stability of the superhydrophobic state dramatically decreased due to an increased pressure deforming the plastron interface.
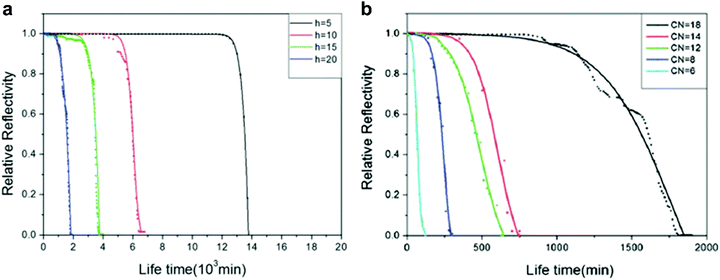 | ||
| Fig. 15 (a) Relative reflectivity for octyltrichlorosilane-modified W18O49 nanowire as a function of time at different immersion depths (5, 10, 15 and 20 cm). The intensity was recorded as the ratio between dark (wet) and light (dry) spots on greyscale images which were recorded at 20 min intervals. (b) Relative reflectivity of alkyltrichloromodified-modified nanowires at 20 cm submersion. Carbon numbers (CN) were increased to vary surface energy. CN = 6 (hexyltrichlorosilane), CN = 8 (octyltrichlorosilane), CN = 12 (dodecyltrichlorosilane), CN = 14 (tetradecyltrichlorosilane), and CN = 18 (octadecyltrichlorosilane). (a and b) Reproduced with permission from ref. 106. Copyright (2012) The Royal Society of Chemistry. | ||
To understand the effects surface energy has on plastron stability, samples were kept at a 20 cm submersion depth. Here, it was shown that with increasing surface energy (with a decreased carbon number (CN) on the alkyltrichlorosilane), the lifetime of the plastron rapidly decreased. That is to say, higher stability was achieved when lower surface energy (higher CN) material was used. As the surface energy increases, the contact angle of the surface decreases. A lower contact angle will give a concave air–water interface and, as a result, the Laplace pressure induced by capillary forces will be exerted downwards, aiding the hydrostatic pressure.128 In contrast, higher WCAs lead to a convex interface and an upwards Laplace pressure, stabilising the plastron.
Along with increased depth, fluid shear forces (e.g. caused by water flow over the material) increase the pressure exerted on a surface. Samaha et al. investigated how increased flow velocities affected the air-layer on electrospun superhydrophobic polystyrene fibres.129 By creating a water jet on the sample inside a pressure vessel, as shown in Fig. 16, a simulation of a moving submersible could be achieved. The intensity of reflected light was monitored as a function of jet Reynolds number and time. The Reynolds number is a dimensionless number representing the flow of fluid, where high Reynolds numbers indicate turbulent flows and low Reynolds numbers are laminar flows. Their results similarly showed that an increased flow rate led to the greater dissolution of trapped air. For static conditions, a level of trapped air could be maintained upwards of 70 hours, however, when the jet flow was applied this greatly reduced to ∼15 hours.
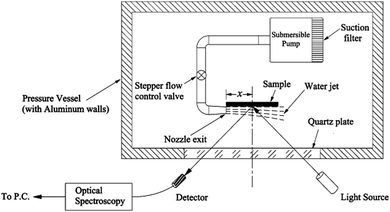 | ||
| Fig. 16 Schematic illustration of the setup used to investigate the effect of water movement on the longevity of the air layer under flow conditions. Reproduced with permission from ref. 129. Copyright (2012) American Chemical Society. | ||
Vüllers et al. also studied the dynamic wetting conditions on their superhydrophobic surfaces.70 Varying surface structures, topographies and materials were used including three densities of polycarbonate nanofur, a hierarchical wrinkled Teflon amorphous fluoropolymer (AF) surface and an ordered polytetrafluoroethylene (PTFE) pillared array. By attaching surfaces to a dip-coater, the velocity could be ranged from 20 mm min−1 to 200 mm min−1. For high density (HD) nanofur, after a velocity of 50 mm min−1 is reached, 8% of the surface had been wetted. Increased velocities after this point showed no further wetting. As the densities of fur decreased, the wetted area increased with medium-density (MD) fur and low density (LD) fur, showing 63% and 88% wetting at 200 mm min−1, respectively. Additionally, MD and LD nanofur showed an accelerated rate of wetting compared to HD (Fig. 17). This was a result of increased pitch between fur and, therefore, less support to the plastron interface. This lead to increased sagging and ultimately greater wetting of the surface. In comparison, the hierarchical structure of the Teflon wrinkles was able to remain completely intact at all immersion speeds, and the PTFE showed 63% wetting at 200 mm min−1.
 | ||
| Fig. 17 SEM images and dynamic plastron stability at different velocities. Averaged dry area as a function of immersion speed in Milli-Q water where dark and white areas represent dry and wetted areas respectively. Error bars show respective standard deviations for at least n = 3 measurements. (left) LD = low density, MD = medium density and HD = high density nanofur. Results indicated that a lower hair density and higher pitch resulted in a less stable air layer. (right) Wrinkled and PTFE pillared array structures. Reproduced with permission from ref. 70. Copyright (2019) Vüllers et al. | ||
The random nature of the Teflon surface leads to cavities and barriers which help protect against shear forces as opposed to the open-air layer on the ordered surface. Comparing nanofur to the pillared array, the polycarbonate of the nanofur has higher surface energy than PTFE, allowing for easier pinning to feature tips and therefore increased stability. Based on their findings, a list of topographical features was recognised for increased stability: (i) hierarchical topography; (ii) high-density surface features; (iii) minimal water-solid contact area; (iv) nanoscale feature size; and (v) reentrant geometries. Each surface also highlighted how an increased flow rate resulted in a decreased plastron lifetime due to enhanced diffusion of trapped air. It should be noted that the stability promoting features relate directly to the specific material investigated in this report, a more general summary is provided at the end of this review.
Another indirect method for understanding the effects of pressure on plastron stability is to monitor the effectiveness of drag-reduction or corrosion resistance. These effects are a direct result of trapped air and, therefore, a reduction in either would indicate air loss. Ou et al. used superhydrophobic aluminium samples immersed at varying depths in aqueous NaCl to observe the corrosion behaviour.130 The results indicated that, as hydrostatic pressure increased, the degradation of superhydrophobicity increased and more severe corrosion was observed for non-oxidised samples. The air layer acting as a protective barrier was lost at increased pressures allowing corrosive species, such as Cl− ions, to reach the surface. Interestingly, oxidised aluminium surfaces showed an increased level of corrosion between 1 kPa and 15 kPa of hydrostatic pressure, but an even greater amount at 0 kPa of hydrostatic pressure. This is thought to be due to the reduction of the sample by oxygen. The proposed mechanism of which is shown in Fig. 18. As only a thin layer of the aqueous solution was present, oxygen from the air could easily diffuse through to the metal substrate. In comparison, at higher fluid pressures, a greater volume of water separated the air and surface, and so oxygen could not diffuse through easily to corrode the aluminium.
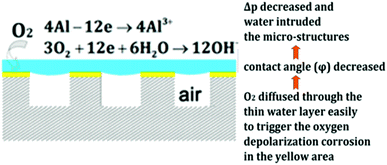 | ||
| Fig. 18 Schematic of the oxygen corrosion of the aluminium substrate and proposed corrosion mechanism. Reproduced with permission from ref. 130. Copyright (2018) American Chemical Society. | ||
An alternative approach was reported which utilises theoretical study and calculations to investigate how an increase in hydrostatic pressure can affect the air layer of various surfaces. Emami et al. carried out a range of studies on randomly structured surfaces, submerged in water while applying hydrostatic pressure.131 The loss of superhydrophobicity was then calculated. To do so, a partial differential equation was derived from the Young–Laplace equation and solved to obtain the shape of the air–water interface. The results showed that as the pressure increased, the meniscus depth increased as the interface sagged into the surface (Fig. 19).
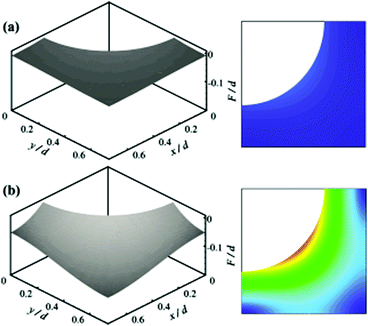 | ||
| Fig. 19 Calculated air–water interface and gradient contour for ordered identical posts. (a) 1000 Pa and (b) 7000 Pa. Surface function, F, and the coordinates x and y are normalised with the post diameter. As the hydrostatic pressure increased the meniscus curves down due to the pressure. (a and b) Reproduced with permission from ref. 131. Copyright (2011) American Institute of Physics. | ||
For post structures, it was noted that the critical pressure for randomly distributed samples was much lower than ordered posts. Similarly for fibrous coatings, a lower critical pressure was seen when fibres were randomly orientated as opposed to their orthogonal counterparts. Randomly structured surfaces can often show a dramatic increase in pitch and as such fewer posts support and pin the plastron in place. This means there is less resistance against hydrostatic pressure and such the transition of the interface occurs much more readily.
As discussed in Section 3.1.2, confocal microscopy is a useful tool that allows for observation of the air–water interface, which gives insight into the mechanism of transition and the existence of metastable states. The metastability results from the compressibility of trapped air, resisting the push of water into the surface by hydrostatic pressure.73,132 The wetting transition has been observed (both mathematically and experimentally) to follow a sagging transition in which the meniscus remains pinned to the corners of surface features but the contact angle increases.65,91,133,134 From this point, the angle will increase until a critical point is reached, after which the interface de-pins from the edges and slides down the surface topography. Using LSCM, Lv et al. observed the transition from the Cassie–Baxter to Wenzel state, including de-pinned metastable states (Fig. 20).132 The transition was carried out for cylindrical micropores etched into a silicon substrate coated with a self-assembled monolayer of fluorosilanes. At lower pressures, the surface was able to stabilise against the hydrostatic pressure, remaining in a pinned Cassie–Baxter state. As this pressure increased, however, the interface de-pins from the micro-posts and slides into the structures. Remaining at this pressure eventually led to a full transition to the Wenzel state.
 | ||
| Fig. 20 LSCM images showing the air–water interface 5 minutes after immersion at different pressures (a–c); (a) Cassie–Baxter (0 kPa), (b) pinned metastable Cassie–Baxter (14 kPa), (c) depinned metastable state (50 kPa), and (d) shows the interface 15 minutes under 50 kPa where full wetting has been reached. (a–d) Reproduced with permission from ref. 132. Copyright (2014) American Physical Society. | ||
4.2 Diffusion of air
Even if a surface is designed to withstand high hydrostatic pressure or exists in a metastable state, the longevity of the air layer is a key consideration.91,135 When air is trapped along the surface of a submerged superhydrophobic structure, it is separated from ambient conditions so that it exists in a closed state. This means in addition to the mechanical equilibrium, a new chemical equilibrium is established controlling the overall stability of the plastron.136 This chemical equilibrium is governed by the exchange of gases between the plastron and surrounding water and, therefore, the rate is overwhelmingly controlled by the concentration gradient across the interface. Despite this, even in fully gas saturated water, gas within trapped air bubbles will still diffuse out over time, due to surface tension and compression, resulting from hydrostatic pressure as shown by Epstein and Plesset.137 Other factors affecting the diffusion rate include; pressure, fluid flow, temperature and in the case of surface plastrons, pinning effects to surface features. The overall time for loss of plastron air as a result of diffusion is, therefore, determined by the volume of trapped gas and the diffusion rate.Bobji et al. investigated the stability of trapped air on several superhydrophobic surfaces by leaving the samples submerged in air-saturated water for a minimum of 2 days.109 Three of the surfaces were regularly arrayed silicon structures consisting of pillars, ridges or holes prepared by photoetching whilst the last was a randomly arrayed aluminium surface. A self-assembled layer of 1H,1H,2H,2H-perfluorooctyl trichlorosilane rendered the samples hydrophobic. An optical microscope was used to observe the reflective properties of the sample (air pockets appearing as bright spots) and monitor plastron deterioration. Of the surfaces, the pillared surface trapped the largest amount of air and hence took the longest to completely transition to a Wenzel wetting state.
As the number of bright spots decreased, it can be concluded that the interface has either travelled deep enough into pores that the microscope cannot observe the reflected light or that complete wetting has been achieved. Fig. 21 shows the results obtained for the hole arrayed structure and demonstrates how the rate of diffusion started slow, increasing to a maximum rate between 15–20 minutes into submersion before decreasing back to a slower rate. As air bubbles begin to diffuse from the pores, the local concentration of air is altered, affecting the concentration gradient and hence leading to an increased rate of diffusion. For all samples despite the difference in topography, the air pockets decreased over time highlighting the instability of the plastron due to diffusion of air.
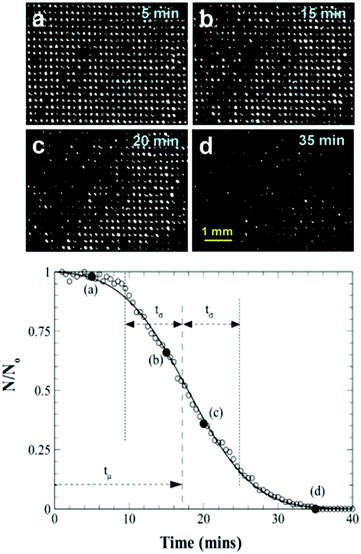 | ||
| Fig. 21 (top) Microscope images of air pockets variation with time on hole arrayed surface. The reduction of holes as time passes indicated the transition of the interface deeper into the holes. (bottom) Variation of the normalised number of bright holes indicating trapped air as a result of total internal reflection, with time for arrayed hole structure. N0 represents the total number of bright holes at the start of the experiment, 522. Solid circles (×) between (a–d) represent the time at which photos were taken. Reproduced with permission from ref. 109. Copyright (2009) American Chemical Society. | ||
Poetes et al. similarly used the reflection of light and confocal microscopy to study the decay of plastrons over time due to diffusion.73 The submerged material was a superhydrophobic Teflon surface with micrometre-sized protrusions separated by <100 nm secondary features. The images in Fig. 22 shows how the plastron began as a continuous air layer that is ∼70 μm thick (Fig. 22d) and supported on the micrometre-sized features. As time passed, the plastron began to thin, decreasing to ∼50 μm after an hour (Fig. 22e). As the air diffused, the plastron came in contact with more surface features and began to separate into a collection of smaller bubbles distributed across the surface (Fig. 22f).
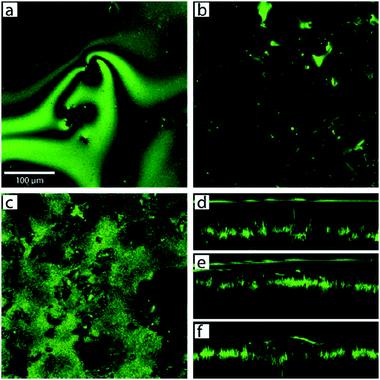 | ||
| Fig. 22 Confocal microscopy images and cross-sections showing the decay of plastron with time. Images taken at different immersion times (a) 15 min, showing a complete plastron and (b) 30 min, showing localised air bubbles. (c) In-place slice of the plastron at the air–water interface after 5 days highlighting the increased number of contact points between water and surface features. Cross-sections are shown (d–f) where (d) shows the plastron immediately after immersion, (e) after 1 h, and (f) shows how the plastron decayed into spherical cup-shaped bubbles pinned to the surface after longer periods. (a–f) Reproduced with permission from ref. 73. Copyright (2010) American Physical Society. | ||
Diffusion rates are further increased with elevated hydrostatic pressure or liquid flow. Hokmabad et al. observed the effect that an increased Reynolds number had on air dissolution.47 The surfaces consisted of random spray-coated textures created with a commercially available superhydrophobic coating (NeverWet). The lifetime was estimated as the time over which the intensity of the reflected light decreased to zero. As the surfaces were subjected to flows with higher Reynolds numbers, the lifetime of the air layers decreased by up to ∼50%. The reason for increased rates of air loss is suspected to be from the mass transfer mechanism changing from a diffusion regime to forced convection caused by fluid shear stress increasing by up to 75% (Fig. 23).
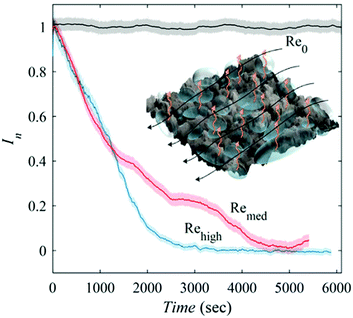 | ||
| Fig. 23 Normalised reflected light intensity as a function of immersion time in under-saturated conditions (95% saturation). Re0 indicates a sample within still waters and shows how as the Reynolds number increases the rate of dissolution, as indicated by a loss in intensity, increases. The black arrows indicated the direction of fluid flow and orange indicated the direction of air loss from the plastron. Reproduced with permission from ref. 47. Copyright (2017) Springer Nature Limited. | ||
In real-world conditions, surfaces will not be in deionized water and as such will be exposed to particles that will collide with the plastron as fluid flows over the surface. To model this, 2 μm (average size) silver-coated glass spheres were added to the water at a concentration of 20–30 particles per mm3. In static conditions, the presence of the micro-particles did not affect the plastron lifetime, however, once flow was applied, the plastron lifetime decreased by 50%. This results from the particles impacting the plastron and destabilizing the trapped air, in addition to damaging the surface structure.
4.3 Condensation
Formation and condensation of water droplets can occur as a result of impurities on the surface of a submerged superhydrophobic material and offer an alternative mechanism by which a wetting transition can occur. Though not as extensively studied as pressure experiments, the effects of microdroplets have been observed. Lv et al. recorded the growth of microdroplets on cylindrical micropores in a silicon substrate using LCSM (Fig. 24).138 Hydrophilic impurities on the surface facilitated the growth of microdroplets.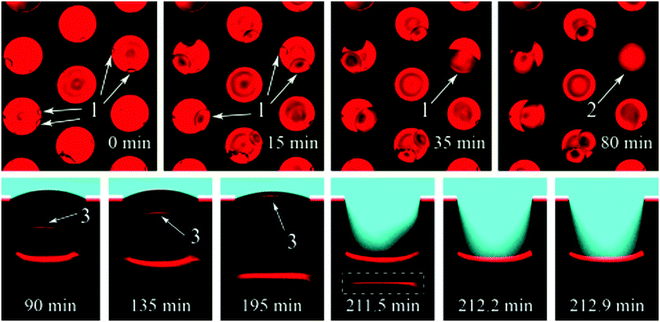 | ||
| Fig. 24 LSCM images showing the formation of microdroplets. Top row: Top view of microdroplets forming in pores (dark circles indicated by (1). Bottom row: Images of a pore in which the dark circle has fully covered the bottom of micro-pore (labelled 2) showing the wetting transition that results from the formation of a condensed droplet (indicated by 3). Reproduced with permission from ref. 138. Copyright (2015) American Chemical Society. | ||
From the recorded images, it was deduced that microdroplets were forming at the bottom of pores with defects, and advanced until they reach the upper interface. At this point, the interfaces coalesce and start the transition of the liquid–air boundary down the micropore until a full wetting transition has occurred. After coalescence of the meniscus and microdroplet, a transition to a Wenzel state occurred within 1 minute.
The above discussion highlights how the act of submerging surfaces exposes the air layer to a range of new factors which can decrease the stability of the entrapped air. Increased fluid pressure and fluid flow act to destabilise the plastron leading to a loss of air and, therefore, a loss of beneficial properties. Differing from sessile droplets on a surface that only need to satisfy a mechanical equilibrium, a new chemical equilibrium is also established which drives the diffusion of gas from the plastron. Through the design of surface topography, the rate at which air is lost, resulting from these mechanisms, can be decreased. However, in real-world environments loss of air will occur after some time if no procedures are set in place to replenish air.
5 Approaches for underwater stability in manufactured surfaces
The understanding of plastrons and their decay, in combination with natural designs with high air retention, has led to much research attempting to fabricate surfaces with high underwater stability. As elaborated earlier in Section 4.1, high water pressures and/or pressure fluctuations can displace trapped air and a Cassie–Wenzel transition occurs.45,57,139–141 Starting from this definition, some routes have been developed to overcome this issue and enhance underwater stability. These routes can be classified into three major categories and are discussed with detailed examples in this section.(1) Systems inspired by nature: many reports have directly utilized natural references to improve the properties of man-made surfaces. In these reports, the detailed study of natural designs (e.g. Salvinia leaves) has directly influenced the choice of selected materials/chemicals and fabrication methods, which helped to improve the air retention ability.142–145
(2) Controlling plastrons’ environment: other methods attempt to work on the environmental conditions around the plastrons and how to make them less detrimental for plastrons’ lifetime. In this case, the target is to record higher failure/breakdown pressures than what would be achieved solely by optimising design/fabrication conditions.115,141,146,147 Some researchers reported the ability to adjust the plastrons pressure in response to changing water pressure (by changing the depth of submersion, and/or applying flow, etc.). Others reported controlling the gas-solubility of water to decrease air diffusion from plastrons.
(3) Plastron regeneration/recovery: while it can be challenging to ensure that the air layer would always remain stable, some reports tried to find ways by which a failed system with damaged plastrons can be recovered.45,148
5.1 Systems inspired by nature
As discussed in Section 2, nature has provided numerous examples of high-stability plastrons. Among these examples, many reports expressed a great interest in the intricate structure of Salvinia leaf and its resultant underwater stability.142–144 The “Salvinia effect” has received particular attention as it has excellent air layer stability but does not display extreme water-repelling properties, with reported WCAs of ≤140°.76,149 From investigations of the leaf properties and structure, it was concluded that five factors are essential for any surface to show the Salvinia effect: (i) choosing an inherently hydrophobic material, (ii) inducing a high aspect-ratio feature (hair, filament, etc.), (iii) the elasticity of these features, (iv) the presence of small inclinations, and (v) chemical heterogeneous.71,80,92,150 The reported Salvinia-inspired surfaces aimed to incorporate as many of these five factors as possible, with the hope of obtaining similar plastron stability when submerging synthetic superhydrophobic materials underwater.In some reports, attempts to fabricate an exact duplicate of Salvinia hair features with the egg-beater attachments were made, utilizing techniques that enable high control over the product's dimensions, e.g. 3D printing and direct laser lithography.142,143,151 Yang et al. utilized a mixture of photocurable resins with multi-walled carbon nanotubes to construct the 3D-printed Salvinia leaf (Fig. 25a).142 Tricinci et al. were able to scale down the original leaf hairy features (100 times smaller) and fabricate a micropatterned surface using direct laser lithography (Fig. 25b).143,151
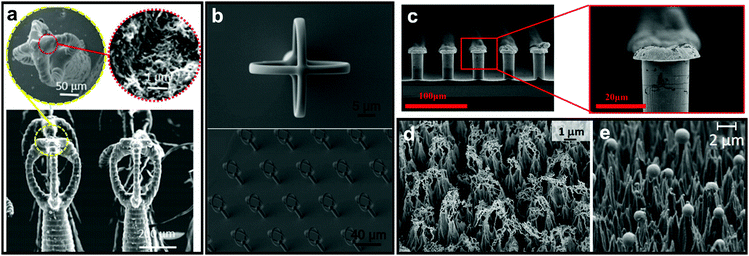 | ||
| Fig. 25 SEM images of Salvinia-inspired manufactured systems. The egg-beater array was fabricated using (a) 3D printing and (b) direct laser lithography. The selective deposition of hydrophobic tips on hydrophobic features/surface was done using (c) meniscus-confined electrodeposition. Teflon sheets were microstructured into cones using oxygen-fed plasma process, with either (d) filaments or (e) spheres on top of the structure. (a) Reproduced with permission from ref. 142. Copyright (2018) Wiley-VCH Verlag GmbH & Co. KGaA. (b) Reproduced with permission from ref. 151. Copyright (2017) MDPI. (c) Reproduced with permission from ref. 144. Copyright (2017) American Chemical Society. (d) Reproduced with permission from ref. 152. Copyright (2017) MDPI (e) Reproduced with permission from ref. 153. Copyright (2016) Elsevier Inc. | ||
In a different study, Zheng et al. attempted to mimic the heterogeneity of the Salvinia's hairs and fabricate a hydrophobic structure with hydrophilic pins (Fig. 25c).144 For this purpose, the meniscus-confined electrodeposition technique was utilized (Fig. 26). Taking advantage of the trapped air, the metal was deposited only on the tips, as there is no electric current in the areas that are not in direct contact with the electrolyte. This selective coating was found effective to induce the pinning effect and increase the droplet adhesion to the tips. This was noticed when compared to that of the uncoated-hydrophobic surface in terms of the depinning force and contact angle hysteresis.144
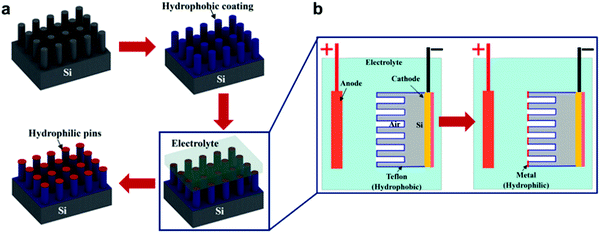 | ||
| Fig. 26 (a) Fabrication process of hydrophobic-coated Si-micro-posts with hydrophilic metallic pins. (b) Demonstrates the meniscus-confined electrodeposition process that is used to selectively coat the pins and leave the rest of the structure. (a and b) Reproduced with permission from ref. 144. Copyright (2017) American Chemical Society. | ||
Other attempts were made at fabricating air-retaining synthetic surfaces, inspired by the Salvinia leaves, via the employment of techniques with less morphological control, as such methods could be highly expensive and not commercially scalable.116 Mundo et al. reported using oxygen-fed plasma etching on Teflon sheets to construct random cones.152,153 Depending on the etching conditions, these cones could be either topped with spheres or filament-like structures (Fig. 25d and e).152,153 When both surfaces were placed underwater, it was noticed that, unlike the sphere-topped surface, the filamentary-topped material appeared shiny, indicating a layer of air being preserved.153 This was attributed to the fact that the open filaments with air cavities present, act similarly to the egg-beater attachments in Salvinia leaves, which was not possible in the case of the solid spheres.153 In another report, Babu et al. applied water-assisted chemical vapour deposition to synthesize vertically aligned carbon nanotubes.150 To make them superhydrophobic, a regrowth process of CNTs was initiated to roughen the surface, followed by coating with PDMS.150 Again, the surface shows the reflective layer when submerged, demonstrating air-retention ability.150
In contrast to the previous examples, other reports were interested in mimicking different creatures which rely on other mechanisms for air retention. Air-retaining grids are not common in nature; examples of creatures that contain grid-like structures as a part of their biological body are scarce, but have been known, e.g. the plant Aponogeton madagascariensis, Fig. 27a, and examples where these grids display air-retaining abilities are even rarer.92 The only known example of this case is Hydrozetes (a schematic of its surface in Fig. 27b).92,154 Its structure consists of a grid held by props, which Mail et al. were aiming to mimic (Fig. 27c). They examined different geometric shapes of the meshes (round, square, hexagonal, and rectangular) with different opening sizes, and also different holding props (either allow or don’t allow connection between compartments). It was found that while meshes with smaller opening areas remain stable at higher pressures, square geometries showed better air-retention compared to the circular ones with the same opening size. It was attributed to the fact that square shapes have higher circumferences (when both shapes have equal areas), which results in water being suspended by a higher solid fraction, and subsequently, more energy is required to overcome this interaction. In addition, connected compartments displayed rapid wetting at the beginning of the experiment, as air can travel freely to compartments where water pressure is minimized. As the experiment proceeded, the isolated plastrons decayed more rapidly, while connected compartments allowed higher air-volume preserved, and hence a higher resistance against the water pressure.
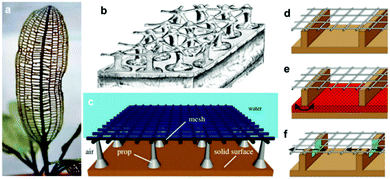 | ||
| Fig. 27 (a) Aponogeton madagascariensis is an example of plants with grids in their structure, while (b) Hydrozetes is probably the only known plant where the grid is used to air retention purposes. The image is a schematic of the plant structure. (c) A schematic of the proposed air-retaining grid. (d–f) Schematics for different designs of the air grid. In (d) the compartments are not connected, while in (e) and (f), the compartments are connected by a porous sintered metal sheet (red) in the bottom and by small embrasures (green) located under the grid, respectively. (a–f) Reproduced with permission from ref. 92. Copyright (2019) the Royal Society. | ||
Mimicking the surface structure and/or chemical composition of naturally occurring air-retaining surfaces has led to the fabrication of materials with compelling properties. However, further reports have been focused on finding characteristics shared by many natural surfaces and applying this feature to their proposed designs. As mentioned in Section 2, properties like the density of the hairy features, their physical properties and alignment with respect to the surface were found common between different natural surfaces, and are believed to be crucial to their air-retention abilities.
As an example, a straightforward approach has been reported for the synthesis of nanofur (Fig. 28a and b) inspired by the dense-hairy layer covering the Salvinia leaf and the Notonecta glauca bug.114,116 A thermoplastic polymer (polycarbonate) was placed between two moulds and pressed with heating, at a temperature that exceeded the polymers glass transition temperature (Tg). When the mould was pulled away, the softened polymer randomly elongated, increasing the aspect ratio of the resultant surface, in addition to enhancing roughness.114 Although mould fabrication in general can be complex, the mould employed here was made by sandblasting (Fig. 28a), a technique which effectively roughened the steel plate surface. Using this method, a dense layer of hairs (nano/microscale) were obtained, with microcavities randomly distributed between them, as a result of using sandblasting particles (Fig. 28c).114,116
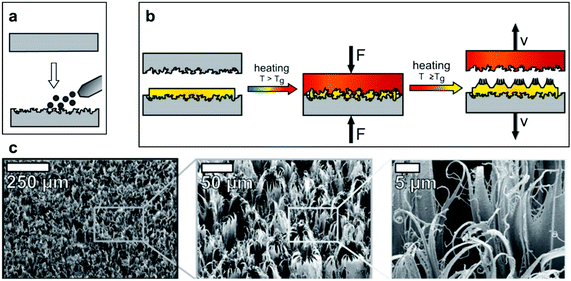 | ||
| Fig. 28 (a) Sandblasting of a steel plate to make a mould. (b) The mould is pressed against the polymer under heating. When removed, the soften polymer elongates to form the high aspect-ratio hairy features. (c) SEM images of nanofur showing its high roughness and features’ density. (a–c) Reproduced with permission from ref. 116. Copyright (2014) Wiley-VCH Verlag GmbH & Co. KGaA. | ||
The possibility of introducing the pinning effect into the nanofur samples was examined by Vüllers et al. Experimentation was carried out to probe the effect of surface energy, controlled by changing the surface coating, on the air retention ability.115 The polycarbonate nanofur was coated with a higher (silver) and a lower (fluoroalkylsilane, FAS) surface energy material. For the silver-coated sample, the penetration depth (the distance that the air–water interface moves when changing hydrostatic pressure from 0 to 300 mbar) was found to be the same for the original uncoated nanofur, while it increased dramatically (from 11 μm to 92 μm) for the FAS-coated sample.115 This was attributed to the fact that the water pinning effect disappeared, due to the lack of points where water could adhere when the surface energy of the coating was lowered.71,115 By measuring the pressure at which the air–water interface breakdown occurs, both the hydrophilic silver and the hydrophobic FAS coatings had lower air stability compared to the uncoated sample.114,115 This suggests that although a low surface energy material would limit the pinning effect, a high surface energy (hydrophilic) coating would, lower the energy cost of wetting the surface. Hence, a material with moderate surface energy is required to achieve balance. This means that a water droplet pinned on the tips of hydrophobic hairs, its most energetically favourable position, would require energy input to be relocated, either forced to wet the surface or be removed from it.76,115 It is noticed that this situation is differentiated from superhydrophobic surfaces that are not involved in underwater applications, where lower surface energy leads to a more slippery surface and, hence, higher water repellence.155,156
Another aspect that has been featured in many natural examples, such as, Salvinia leaves and the skin of springtails (Collembola), is the re-entrant structure.90,157 Any structure with a convex texture (β < 90°, Fig. 29b and c) is considered to be re-entrant, this definition can include a range of different shapes and geometries, as illustrated in Fig. 29d. These structures have captured many interests due to their ability to maintain a stable air layer, even with liquids with low surface tensions.91,158,159 This is because the three-phase contact line is pinned by the edges of these textures, which can suspend liquid for a period that is 107 million times longer compared with simple cylindrical textures, as reported by Domingues et al. (for mushroom-shaped silica cavities immersed in hexadecane).160–162 Many reports highlighted the application of these surfaces as superomniphobic surfaces,96,163–166 with the ability to repel both water and oil, even when employing textured hydrophilic surfaces.167–169 Some reports utilized these properties to create surfaces with a controlled switching ability between superomniphobic and omniphilic, using an electric170 or a magnetic171 field. More relevantly, re-entrant structures have been reported for water immersions and they were found to increase the breakdown pressure at which a Cassie–Wenzel transition takes place, making these surfaces more stable underwater compared to simple cylindrical textures.145,161,162
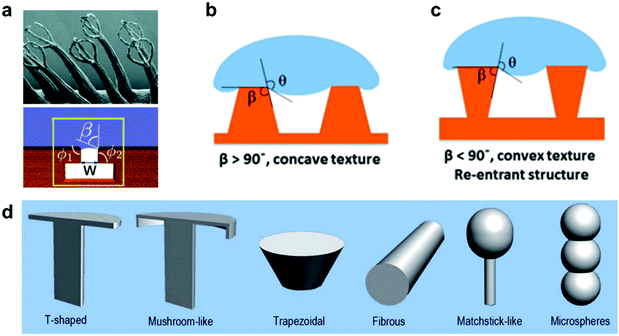 | ||
| Fig. 29 (a) Salvinia egg-beaters could be modelled as a re-entrant structure. (b and c) Schematics showing the difference between concave and convex texture. (d) Different geometries that lay under the re-entrant structure definition. This includes (from left to right) t-shapes, mushroom-like, trapezoidal, fibrous, matchstick-like and microspheres geometries. (a) Reproduced with permission from ref. 90. Copyright (2015) Amabili et al. Published by Wiley-VCH Verlag GmbH & Co. KGaA. (b and c) Reproduced with permission from ref. 145. Copyright (2019) American Chemical Society. (d) Reproduced with permission from ref. 158. Copyright (2017) The Royal Society of Chemistry. | ||
Re-entrant structures are reported for the fabrication of distillation membranes, due to their stability against fluid pressures which enable their application under water-fluxes during the distillation process.145,172,173 Lee et al. reported a dual-layer membrane fabricated by; (1) electrospinning of polyvinylidene fluoride-co-hexafluoropropylene (PVDF–HFP), followed by, (2) electrospraying of PVDF/PDMS-microspheres (Fig. 30).173 The presence of polymer microspheres formed the re-entrant convexity, which allowed air-pocket formation and water repellent behaviour. The liquid entry pressure (LEP, the pressure at which liquid starts entering the pores and wetting the membrane) measured for membranes with (PDMS-3%, PVDF-2%) sprayed solution was 111 kPa (1.11 bar), with a partial wetting observed when using seawater with 0.1–0.2 mM sodium dodecyl sulfate (SDS).145 To extend the membrane anti-wettability under harsher saline conditions, Deka et al. aimed to increase the membranes roughness and superhydrophobicity by including hydrophobic silica aerogel into the microspheres (Fig. 30c and d).145 Using 30% aerogel concentration, the LEP was enhanced to reach 129.5 kPa, and the wetting resistance was observed even under 0.5 mM SDS concentration.145
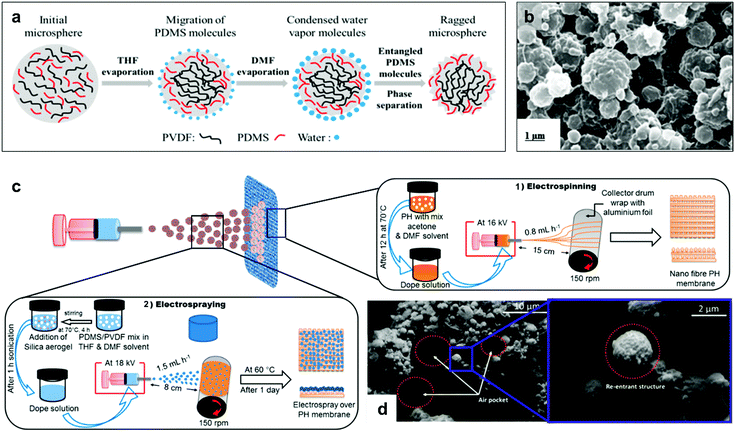 | ||
| Fig. 30 (a) A schematic showing the formation of PVDF/PDMS-microspheres. (b) SEM image of the electrosprayed microsphere solution (PDMS-3%, PVDF-2%). (c) The process of fabricating electrospun (PVDF–HEP) membranes followed by electrospraying of aerogel/PDMS/PVDF solution. (d) SEM images of a membrane fabricated using (aerogel-30%, PDMS-3%, PVDF-2%) spraying solution. The image shows the formation of air pockets and defined re-entrant structures. (a and b) Reproduced with permission from ref. 173. Copyright (2017) American Chemical Society. (c and d) Reproduced with permission from ref. 145. Copyright (2019) American Chemical Society. | ||
Although these re-entrant structures have shown the ability to hold a stable air layer, this can be highly affected by structural defects. Domingues et al. illustrated that for single, isolated mushroom-like pillars, when the surface suffers from localized physical damage (e.g. broken pillars), this discontinuity causes a rapid wetting at the defect area. This then allows the liquid to push the trapped air outside and spread further to un-damaged areas, leading to a complete surface wetting (Fig. 31a).162 As a solution, they proposed mushroom-like cavities (also referred to as doubly re-entrant cavities), in which the solid material is connected and air pockets are isolated (Fig. 31b). To investigate this, doubly re-entrant silica surfaces with induced local damage were immersed in water. Fig. 31c shows optical images of the wetting state at different periods. In these images, cavities (3, 1), (4, 1) and (3, 2) were connected before the experiment took place. It was noticed that after the three cavities were filled, the surrounding cavities remained intact, even after 30 days of immersion.162
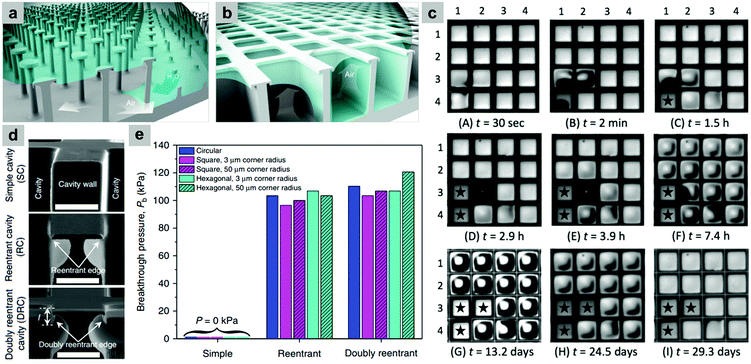 | ||
| Fig. 31 (a and b) Schematics show the impact of physical damage on the wetting resistance in the case of pillars and cavities, respectively. (c) Optical images for the wetting transition of doubly re-entrant silica surfaces immersed in water, with cavities (3, 1), (4, 1) and (3, 2) are connected due to physical damage. Cavities marked with a star (★) are water-filled. (d) The different cavity-shapes examined (from top) were simple, re-entrant and doubly re-entrant cavities. (e) Graph for breakthrough pressures measured for different geometric microtextures with different cavity shapes, showing how complex cavities are better in stabilizing air layers compared to simple cavities. (a–c) Reproduced with permission from ref. 162. Copyright (2017) American Chemical Society. (d and e) Reproduced with permission from ref. 161. Copyright (2018) Nature Publishing Group. | ||
In another report, t-shaped (re-entrant) and doubly re-entrant cavities were compared to simple cavities in terms of their ability to sustain the air layer (Fig. 31d). Circular geometries, along with square and hexagonal (with different corner radii) were prepared from un-coated silicon wafers.161 When measuring breakthrough pressures (Pb) (Fig. 31e), all structures with simple cavities failed at low pressures compared to other cavities. It was found that doubly re-entrant cavities, in general, show better stability against high pressures.161 More importantly, the dependence of Pb on the cavity diameter was highlighted. While the examined cavities with a diameter = 200 μm showed a Pb value ranging between 100–120 kPa, decreasing the diameter would allow for a higher contribution of Laplace pressure pushing water upwards. Typically, the predicted Pb for cavity diameter = 100 nm is 1700 kPa.161 This gives a guide for designing surfaces with sustained hydrophobicity underwater.
In summary, nature designs are a great source of inspiration for their exceptional air retention abilities. From the Salvinia leaves to the dry-underwater insects, many lessons were learned regarding the influence of surface design, structural geometry and chemical composition. In addition, the challenges of mimicking natural surfaces, with some of them exhibiting a degree of complexity, have been addressed and many solutions were proposed. However, the progress achieved to date is still considered to be below the required for many application fields, which leaves room for more efforts to be invested.
5.2 Controlling plastrons’ environment
The development of the structural design of materials has led to significantly improved underwater stability. However, currently obtained results have limited applicability relative to the expected challenges faced in a real-world application environment. Therefore, alternative approaches are required, one of these methods is the control of the plastrons pressure, adjusting it in response to the increased water pressure.115,141,146,147 Other methods include operating under air-saturated water flow,174 and heating the surface to create a stable solid–vapour interface.29,57 The following section will discuss these approaches and how they enhance plastrons’ lifetime.Carlborg et al. designed a channel that allows the trapped-air pressure to increase when liquid flow exerted pressure on plastrons.146Fig. 32a and c shows a schematic of the standard channel and the self-regulating design they proposed. In the self-regulating design, a feedback channel is introduced, which is connected to the air trapped in the gas pockets. When the flow takes place, the liquid compresses air in the feedback channel, which in turn increases the pressure in the air pockets, allowing for longer sustainability of the air layer.146Fig. 32b and d shows the difference between both channel designs in a prototype experiment. Once the flow started, gas pockets in the standard design failed gradually. However, the self-regulating design allows pressure adaptation with increasing fluid pressure. When the fluid pressure was raised from 2 kPa to 8 kPa and then 25 kPa, the pressure inside the gas pockets increased in response from 0 kPa to 3 kPa and then 14 kPa, respectively.146
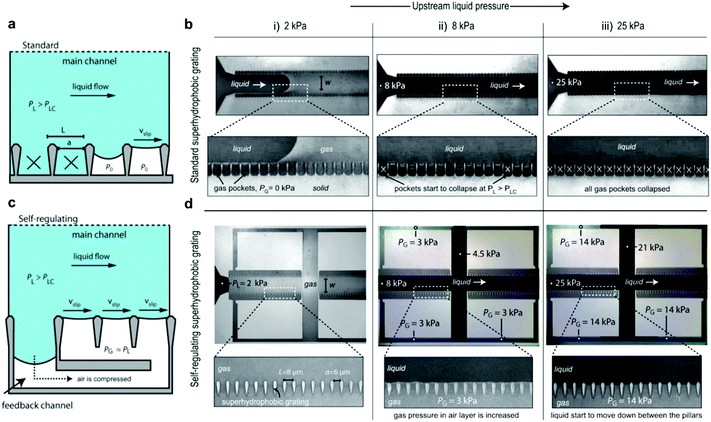 | ||
| Fig. 32 Schematic of (a) the standard channel and (c) self-regulating channel. The difference in liquid pressure tolerance is shown in (b) (standard) and (d) (self-regulating) under the following pressures: (i) 2 kPa, (ii) 8 kPa and (iii) 25 kPa. (a–d) Reproduced with permission from ref. 146. Copyright (2010) American Chemical Society. | ||
A notable limitation of the previous design is when the fluid pressure goes above a certain threshold, the feedback channel would no longer be able to accommodate the increased liquid volume.141 When this point is reached, the system would start to behave like the standard system, and the air stability would be threatened. Another way to overcome this and increase the lifetime of the plastron further was introduced by Vüllers et al., as illustrated in Fig. 33a.115 Nanofur was used in this experiment, which was perforated to allow pressure control. The nanofur was attached to the inner cell in a double-cell setup, allowing pressurizing of the trapped air in the plastrons. The outer cell, where water is placed, was also pressure-controlled. The experiment revealed that, while un-pressurized nanofur suffered from an exponential decrease in the percentage of the dry area over time, even under a small applied external pressure, pressurized samples showed much-enhanced stability (Fig. 33b). Samples tested under 3.5 bar remained almost completely dry for over 4 hours. Increasing the pressure, 86% of trapped air was retained at 4 bar, which is equivalent to submerging the surface at 40 m water depth.115
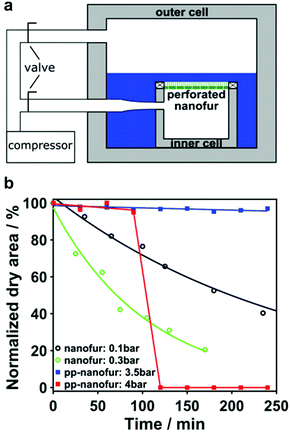 | ||
| Fig. 33 (a) Schematic of the double-cell setup used to pressurize the nanofur (attached to the inner cell) and to control the applied water pressure (outer cell). (b) A graph showing the change of dry area percentage with time for samples immersed under different pressures. (a and b) Reproduced with permission from ref. 115. Copyright (2018) Wiley-VCH Verlag GmbH & Co. KGaA. | ||
A modified approach has been reported by Li et al., with porous superhydrophobic titanium (Ti) surfaces.141 The surfaces were nano/micro-structured with the presence of micropores, which allowed an active supply of air to feed the plastrons (Fig. 34). While water pressure increases, the air supply creates an opposing pressure, which stabilizes the trapped air and prevents plastrons decay.141 Using this setup, the Ti surfaces were able to sustain the air layer under a 350 kPa hydrostatic pressure (3.5 bar).141
 | ||
| Fig. 34 Schematic of the setup utilized by Li et al. (a) The porous superhydrophobic surface is attached to an inner cell, which is connected to an air supply source. (b) As the water pressure increases, the air supply continues to feed the plastrons, making the trapped-air pressure increases. (c) A comparison between (no-active-air-control) case (left) versus the presence of air control (right). In the first case, water pressure (Phydro) forces the decay of the plastrons, while in the second case, an opposing pressure (P2) is applied by the air supply, making the plastrons more stable. (a–c) Reproduced with permission from ref. 141. Copyright (2019) The Royal Society of Chemistry. | ||
To conclude, controlling the plastron pressure gives a way to further extend the lifetime of the plastron. The total pressure tolerance of a system could be much enhanced by adapting the plastron pressure to the surrounding environment, compared to relying on the superhydrophobic properties of the surface only without effective pressure control. Approaches reported to increase the plastrons pressure, although limited, have been shown to obtain interesting results. These include; creating a pressure feedback channel for plastrons, pressurising the samples during testing, and pumping air through a porous superhydrophobic surface.
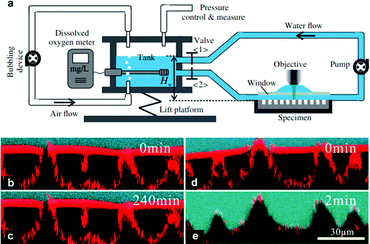 | ||
| Fig. 35 (a) A schematic showing the experiment setup. Water saturation is maintained and controlled by attaching a bubbling device and a dissolved oxygen meter. Confocal microscopy was incorporated to visualize plastrons decay. (b–e) Images obtained from confocal microscopy of a lotus leaf placed under (b and c) saturated and (d and e) unsaturated water. The blue and red regions show water and air–water interface, respectively. (a–e) Reproduced with permission from ref. 174. Copyright (2017) American Physical Society. | ||
Vakarelski et al. showed that textured superhydrophobic surfaces can prevent vapour-layer collapse until completely cooled, and that their critical temperature is typically lower compared with hydrophilic and superhydrophilic surfaces. The maximum critical temperature for a hydrophobic or superhydrophobic surface required to observe this behaviour is ∼400 °C.29 Considering the cooling process, Fig. 36a shows the formation of a stable vapour layer around a superhydrophobic sphere at T = 200 °C, water T = 100 °C. This layer was not disturbed until the sphere reached the ambient temperature (100 °C, Fig. 36b). On the other hand, a hydrophilic sphere at T = 275 °C, water T = 100 °C shows an immediate transformation from vapour-layer boiling to a nucleate boiling, which leads to few isolated air bubbles as the sphere reached T = 200 °C (Fig. 36c and d).
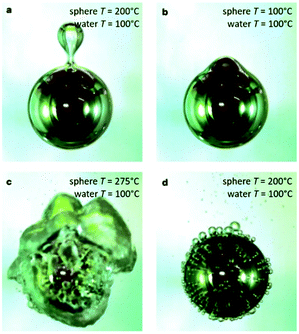 | ||
| Fig. 36 The cooling of a superhydrophobic sphere (a and b) and a hydrophilic sphere (c and d). (a and b) Reproduced with permission from ref. 29. Copyright (2012) Nature Publishing Group. | ||
Using the Leidenfrost effect still faces many challenges, like the design complexity in continuous heating that needs to be implemented to sustain the vapour layer during the whole application period. The research in this area is considered to be at its elementary steps. Further research should be conducted to optimize surface properties, as well as finding suitable applications where this method can compete with other approaches to fabricate underwater hydrophobic surfaces.
5.3 Plastron regeneration/recovery
A general aim for the discussed research focuses on increasing the plastrons lifetime. However, in most cases, it is shown that plastrons’ failure (although delayed) is not completely hindered.115,141 If long-term applications are being targeted, this would present itself as one of the greatest challenges for these systems, giving that the average plastrons lifetime ranges from hours to a few weeks.72,73,180,181 Therefore, considering the ability of a failed system to recover and be re-used could be a solution to this issue.148Water splitting reactions have been considered by many researchers as a method of regenerating lost plastrons, as this can be facilitated with low energy consumption, due to the generated gas being stable and compatible with water (i.e. non-reactive). Additionally, incorporation into superhydrophobic systems is likely to be straightforward.50,111,148,182 The gas generated by this reaction can refill the damaged plastron, returning the air-sustaining properties.111 Lee et al. fabricated a gold-coated nanostructured surface that is decorated with other micro-posts made by the patterning of a photoresist, followed by photolithography (Fig. 37a).148 For the electrolysis reaction, the gold layer acts as the cathode, while a copper wire is placed in the water and acts as the anode. Starting the experiment from the wetted state (with nanoscale grooves still unwetted), bubbles were observed. After less than a minute (for a sample with 100 μm pitch, 50 μm height and 95% gas fraction), the dewetted state was achieved.148 In another report, photoelectrochemical (PEC) water splitting was applied on a hierarchical SiC/Si nanostructure surface to regenerate the plastron.111 The fabrication method is shown in Fig. 37b, in which both SiC nanowires and Si micro-posts were combined. Again, after performing the PEC reaction, the surface restored its superhydrophobicity and drag reduction ability.111 The same conclusion was reached when Zn/O nanorod/Si micro-post hierarchical structures were utilized.50
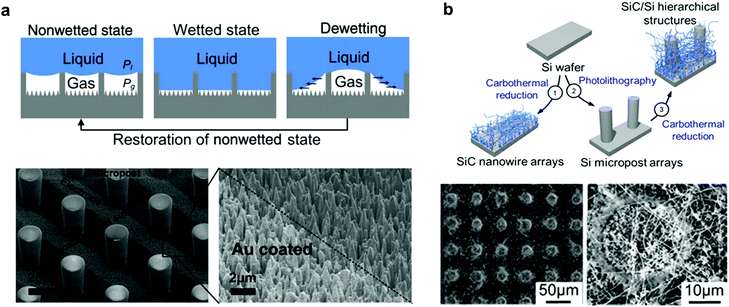 | ||
| Fig. 37 (a) (above) A schematic for the wetting/dewetting process and (below) SEM images for the prepared surface, showing the micro-posts and the nanoscale gold-coated features. (b) (above) The fabrication of hierarchical SiC/Si nanostructure and (below) SEM of the prepared surface. (a) Reproduced with permission from ref. 148. Copyright (2011) The American Physical Society. (b) Reproduced with permission from ref. 111. Copyright (2016) Nature Publishing Group. | ||
It is notable that for the regeneration of the plastron in these examples, a combination of micro/nanostructuring was required. It is well-established that such a combination is beneficial for superhydrophobicity and all subsequent properties, similar to the Lotus leaves and water spiders’ legs.183,184 In addition, the wetting state from which the plastron is being regenerated is a micro-Wenzel–nano-Cassie state, in which, while the micron-size grooves are wetted, the nano-size pockets remain dry. Therefore, it could be concluded that for a microstructured surface, which facilitates complete Wenzel wetting, it would be challenging to recover after plastron failure. Verho et al. highlighted this in their experiment (illustrated in Fig. 38).185 Simple water suction by a syringe could not restore a single-level topography wetted surface, and the wetting, in this case, is considered to be irreversible. Alternatively, when considering the micro-nano surface topography, the surface could be restored from a nano-Cassie state. In another report, Lee et al. showed the possibility of achieving regeneration in various ways (placing in air-saturated water, bringing part of the sample near the surface of the water – the air–water interface – and gas generation) giving that the nano-posts remain unwetted.186
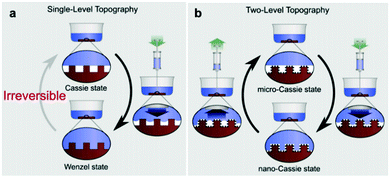 | ||
| Fig. 38 (a) Single-level versus (b) two-level topography in plastrons regeneration. In the first case, the wetting process is irreversible, while for the second, dewetting could be restored. (a and b) Reproduced with permission from ref. 185. Copyright (2012) PNAS. | ||
In response to this challenge, Panchanathan et al. reported a micro-structured Si–Pt–Teflon surface where a regeneration from Wenzel wetting was successfully achieved (Fig. 39a and c).45 The micropillars were constructed from silicon, which is then coated with Pt (except for the tops), and finally with Teflon to make the surface hydrophobic (Fig. 39b).45 Decomposition of H2O2 over a Pt catalyst was chosen as the plastron-regeneration method. It was shown that, even where no nanostructuring was induced, the produced oxygen helped surface recovery and restored the unwetted Cassie state.45
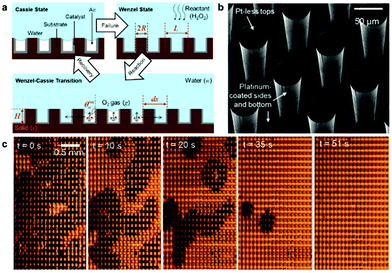 | ||
| Fig. 39 (a) A schematic of the recovery process proposed. (b) SEM image of the surface, showing where Pt-coated is located. (c) Underwater plastrons recovery at 4.5% wt H2O2. The images are taken using total internal reflection at the air–water surface. Reproduced with permission from ref. 45. Copyright (2018) American Chemical Society. | ||
In summary, plastrons regeneration could provide a feasible solution to extend or regain plastrons with short lifetimes. This is becoming of high importance as developing a system with general underwater stability is very challenging. Working on the regeneration ability allows for a longer application time of surfaces and, hence, decreases potential cost. This approach is of great interest in long-term underwater submersion in particular, where durability is highly targeted to avoid/minimize maintenance expenses.
6 Highest-performing manufactured surfaces: what has been achieved
The challenges faced when maintaining plastrons underwater, as illustrated in Section 4, hugely limit the suitability of many surfaces in real-life applications. Developing surfaces with high plastron stability has been widely addressed by many reports in the literature. While many of them highlighted a sustained air layer during immersion for hours, a few reports presented surfaces that could achieve long-time stability and/or at harsh conditions of depth/flow rate.115,174,181,187 The previous section outlined different approaches that have been employed to fabricate superhydrophobic surfaces with good air-retaining abilities. Here, examples with the highest reported underwater stability, to date, are investigated.It must be considered that there are no universal plastron stability testing methods, and so variation in the assessment implemented makes it challenging to definitively identify those materials with the highest stability. While some materials have been reported for exceptional long air-layer stability, other materials can be tested in very different conditions. Because the surrounding environment can significantly change with respect to the aimed application, the conclusion on any reported examples must also differ accordingly. As a way to look at the literature more inclusively, the best performance will be judged firstly on the reported stability time (Table S1, ESI†), and then based on the water pressure they can withstand (Table S2, ESI†).
Starting with examples with the longest stability time, the material reported by Martinez-Gomez et al.187 Samples were prepared using a range of hybrid organic–inorganic silica-based particles sprayed on glass substrates, and underwater stability was assessed by visually monitoring the mirror-like behaviour for the samples while immersed in a 2 cm depth of water. It was noticed that after 100 hours, the shiny look started to disappear from some spots instead of evenly covering the whole surface (Fig. 40). However, examining the surfaces immediately after removal from water (without drying) indicated the superhydrophobicity to be preserved. This was used to conclude that the air layer was maintained, and the observed reduction in reflection is linked to its thinning.187 The surfaces were kept underwater for longer periods, and it was established that superhydrophobicity was sustained even after a six month immersion period.187 To the best of our knowledge, this is the longest-reported plastron stability for a manufactured surface with straightforward water immersion testing.
 | ||
| Fig. 40 Photos for coated substrates immersed in water for (a) a few minutes, (b) 100 hours, and (c) after removing and placing in the water again. (a–c) Reproduced with permission from ref. 187. Copyright (2017) American Chemical Society. | ||
Xu et al. have reported samples with ‘infinite’ lifetime underwater utilising trench structures with varying widths.181 Three trenches with the same length (1 mm) and depth (∼85 μm) but different widths (147, 96, 46 μm) were tested (Fig. 41a). The critical immersion depth (HC), defined as the depth after which the lifetime of plastrons decreased rapidly, was identified for these samples. It was found that with decreasing the trench width, HC increased from 5 cm to 7.5 cm and 16.5 cm, respectively (Fig. 41).181 The main finding was that for depths smaller than HC, the air layer remained stable typically >50 days (indicated as ∞ in Fig. 41b), after which the experiment was terminated.181 This highlights the possibility of getting long-term stability if depth can be controlled to be less than HC.
 | ||
| Fig. 41 (a) SEM image of the trench used, with length (l), depth (h) and width (w) indicated. (b) Plastrons lifetime at different immersion depths for 147, 96, and 46 μm trench widths. The graph shows the maximum depth for each trench width at which an infinite lifetime (>50 days) can be obtained (c) critical immersion depth (HC) for each trench width. (a and b) Reproduced with permission from ref. 181. Copyright (2014) American Physical Society. | ||
Considering other samples with shorter plastron lifetime, the nanofur prepared by Vüllers et al. (Section 5.1) and assessed using LSCM (water depth = 4 mm) showed a sustained air-layer for 31 days, after which the experiment was terminated.116 In addition, Lee et al. reported their W18O49 nanowire arrayed superhydrophobic surfaces to remain dry under water-depth of 5 cm for around 9 days, before they started to rapidly become wetted (Section 4.1).106
For applications that involve subtle interaction with water, the previous examples could be highly relevant. However, as many of the application fields require operating under deeper water depths, and/or faster flow conditions, etc., the environment chosen for these examples can be seen as too mild, which makes judging on reported stability time only not sufficient to choose the best performing samples. Another issue with applying mild conditions is that the only limiting factor in most cases will be time, which makes many experiments terminate prior to full failure. This makes it more challenging to differentiate between various materials.
Another way to examine this is by comparing the maximum tolerated pressure. In this context, we are looking at the pressure for which failure in air-layer reservation starts. It worths mentioning that some reports chose to state the pressure at which a complete wetting occurs, which sometimes varies significantly from the value we are considering here, especially for samples with a slow degradation of the air layer.
As discussed previously in Section 5.2, controlling the plastrons internal pressure can improve the air-retention ability, by significantly reducing air shrinking. This was illustrated most effectively by Vüllers et al. in pressurized nanofur samples (Fig. 33), which was stable for the whole experiment time (4 hours) when operating at 3.5 bar, and for 2 hours at 4 bar.115 This is equivalent to a depth at least 250 times greater (40 m) compared with the previous examples. To the best of the authors’ knowledge, this is the highest tolerated pressure that has been reported. This would be followed by the porous Ti surfaces reported by Li et al., also discussed in Section 5.2, with an air-layer being sustained under a maximum of 3.5 bar.141
Applied flow conditions are highly relevant to many fields (e.g. drag reduction), and these testing environments represent a similar challenge to submersion depth, albeit not the same. Experimental conditions across the literature are varied, however, work conducted by Xiang et al. on lotus leave (Section 5.2) highlighted the effect of using air-saturated water on enhancing the plastrons stability under 1.5 bar and a flow rate of 23 mL min−1.174 Compared with the case of using unsaturated water, during which plastrons decayed after 2 minutes, the saturated water extended this time to 4 hours, after which the experiment was terminated (Fig. 35).174 Although the reported pressure is lower compared with the previous two examples, the combination of this with flow conditions makes it challenging to identify the effect of solely using air-saturated water.
Doubly reentrant SiO2/Si cavities, reported by Domingues et al. (Section 5.1), recorded a breakthrough pressure between 1–1.2 bar, depending on the cavity opening shape and diameter.188 The non-pressurized nanofur, although failed at much less pressure compared with the pressurized one mentioned earlier in this section (typically 0.9 bar), is still considered to be good relative to many other examples.115
While the examples mentioned in this section are considered to be among the best-performing surfaces underwater, they demonstrate how much additional progress is required to attain the targeted properties. For real-life applications (discussed in the following section), where deep immersions and/or high flow rates are expected, these systems currently face major limitations.91,189,190 Cutting edge research reveals some structural aspects that can enhance plastrons stability generally. These include: (i) low-magnitude roughness (nanoscale), (ii) non-wide grooves with a low gas-to-solid ratio, (iii) ordered roughness textures with sufficient density, and (iv) moderate surface energy. Low-magnitude roughness is more able to preserve a stable air layer for a longer time, as the small air pockets are easier to maintain.187 Considering the reentrant structures reported by Domingues et al., it was predicted that by reducing the cavities size from micro to nanoscale (typically to 100 nm), the breakthrough pressure will increase to 17 bar.188 Small, narrow grooves protect trapped air better than wider grooves, as the latter suffer more from oscillating pressures.191–193 In addition, small plastrons generally result in greater solid–water contact, which although leads to lower WCAs, is considered better for long-term air trapping.193 Ordered structures ensure no sudden increase in pitch between textures and provide better plastron support, and their high density has the same effect in decreasing the pitch as well.70,131 The surface energy controls water pinning, with low surface energy coatings not supporting this effect.115 However, the enhanced air-stability resulting from these structural enhancements may still not be sufficient. Further research should be conducted to improve the properties of the fabricated surfaces and make them adequate for the current needs. Currently, materials have been shown demonstrate resilience to particular environments, but the search for a universal approach is still ongoing.
7 Applications
Superhydrophobic materials are widely covered in detail in the scientific literature for their many proposed application areas, primarily in non-submerged environments. However, the challenges faced in submerged applications differ greatly from those that do not consider trapped air. In simple terms, the material with the highest WCA does not necessarily provide the greatest underwater stability, and so this introduces a layer of complexity in the search for technological solutions. This section covers the most prevalent applications for submerged superhydrophobic materials.7.1 Drag reduction
One of the main applicational areas for underwater superhydrophobic materials stems from their ability to reduce drag. Frictional drag results when materials travel through fluid phases, which is highly relevant to marine vessels moving through water. This added drag results in a higher energy requirement, leading to a significant increase in fuel consumption and an increase in transport costs and emissions (CO2). Marine transportation accounts for 12% of the world's transportation energy consumption, and 60% of this is used to overcome frictional drag, therefore a reduction in these forces would greatly benefit both the environment and economy.194–196 Fluid drag is not just limited to marine vessels; applications including the transportation of fluid through pipelines would also see a great benefit from the reduction of drag forces. Implementation of drag reduced surfaces would allow for lower power usage by engines and hydraulic pumps, and consequently lower energy consumption and costs. Superhydrophobic materials have been demonstrated as a potential solution for this purpose. .
.
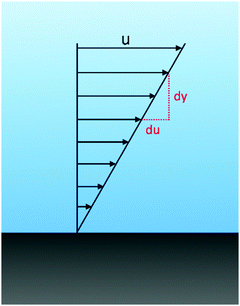 | ||
Fig. 42 Schematic showing the velocity profile for the no-slip boundary condition. Velocity, u, of the fluid at the surface is 0 relative to the surface.  represents the shear rate of the fluid. represents the shear rate of the fluid. | ||
One of the exceptions to this boundary condition is superhydrophobic surfaces. When air is trapped in the rough micro/nanostructures on a superhydrophobic surface, it creates a complex interface with regions of water–solid and water–air contact. In flow conditions, the water–solid regions adopt a typical flow profile, in contrast, the regions of water–air contact enable water to flow over the structures with an ‘effective slip’ (Fig. 43). Slip is a microscopic phenomenon in which the relative velocity at the interface is no longer equal to that of the solid. The air–liquid interface has a considerably lower friction force than the corresponding solid–liquid interface creating the apparent slip and allowing for the reduction of drag. The resulting fluid velocity at the surfaces is named the slip velocity, u0.198 An effective way of quantifying the level of slip a surface exhibits is by measuring the slip-length, b, which is related to the slip velocity and shear rate by:198
An important detail to bear in mind is that the drag reduction is not directly related to the WCA value and as such, measurement of the WCA alone is not enough to declare a material as drag reducing. For instance, materials that exhibit Wenzel wetting may possess a high WCA but due to the lack of retained air, slip lengths are low and drag reduction will not occur.198,202 As a result, the design of drag-reducing superhydrophobic materials requires a more in-depth characterization, such as measuring surface flow properties like the slip length, to fully quantify the effects and compare materials.
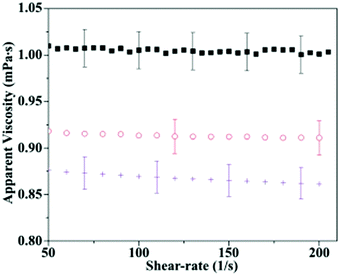 | ||
| Fig. 44 Slip-length measurements carried out on a cone and plate rheometer. The black square represents water baseline test carried out on a stainless steel surface (b = 0 μm), red circles represent PTFE surface (b = 27 μm) and purple crosses represent TiO2 surfaces (b = 55 μm). Error bars were calculated by variation from repeats. Reproduced with permission from ref. 204. Copyright (2018) The Royal Society of Chemistry. | ||
Rajappan et al. evaluated the drag reduction performance of randomly structured superhydrophobic materials.205 This included aluminium which had been spray-coated with a fluorinated silsesquioxane, chemically etched with acid or sandblasted. Frictional torque measurements allowed for the determination of the slip lengths which ranged from 12.1% (b = 8.4 μm) to 26.9% (b = 32.1 μm). Zhang et al. similarly used chemical etching to produce superhydrophobic materials from drag reduction studies.206 The produced surface consisted of ZnO nanowires on steel substrates and exhibited drag reduction between 40–50% compared to untreated surfaces (Fig. 45).
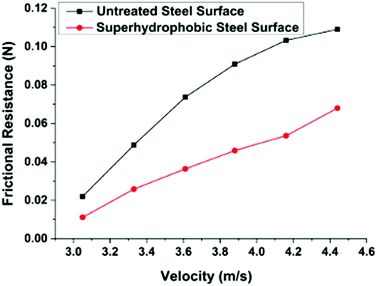 | ||
| Fig. 45 Change in frictional drag with velocity of water flowing over untreated steel substrated coated in ZnO nanowires. The superhydrophobic surface shows a drag reduction between 40–50% of the untreated surface. Reproduced with permission from ref. 206. Copyright (2017) Institute of Materials, Minerals and Mining Published by Taylor & Francis on behalf of the Institute. | ||
As drag reduction is a direct consequence of trapped air, the surface morphology and chemistry (which control the possible volume of air) are the main influencing factors. For instance, Samah et al. demonstrated the effects a random topography had vs. microfabricated structures using numerical simulations.207 Random roughness is highly desirable for real-world applications as they lower costs and for the most part are easier to scale up. The work showed that the random micro-post structure led to lower frictional forces compared to the regular structures, this was amplified with an increased gas fraction. It was believed this is due to the possibility of finding larger areas to flow through which would have lower resistance and hence lower overall friction. As the gas fraction increases, the possibility of these large passages also increases leading to the increased difference in the drag reduction of the two. A similar study was carried out by Aziz et al. investigating slip on random and designed granular coatings.208 Their simulation also varied the hydrostatic pressure so that at an increased pressure the air–water interface moved deeper into the coatings. This meant calculations were undertaken on a curved interface as opposed to the flat interface in the work by Samah et al.207 It showed in all particle arrangements the slip decreased with increased pressure due to the increased wetted contact area. However, the random structures were much more susceptible to wetting with a lower critical hydrostatic pressure. Furthermore, with increased gas fractions (particles more spaced out) the degree of partial wetting is also greatly increased. The increased water penetration will lead to increased friction and as such increased drag. This work by Aziz et al. opposes that done by Samah et al. and highlights the importance of considering both structural properties and environmental factors such as pressure.207,208
Other research has focused on the difference in drag reduction between surfaces with roughnesses on a single scale and one that is hierarchical. Taghvaei et al. produced aluminium substrates with a hydrophobic Al2O3 micro/nanoparticle coating to create a dual structured surface that could be compared to a non-hierarchical nanostructured counterpart.209 The surfaces were submerged in water (as shown in Fig. 46) before being moved at a range of velocities, up to 0.5 m s−1 and the resulting drag across the surface measured by a dynamometer.
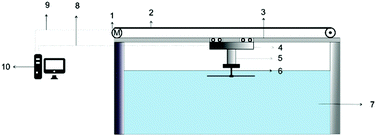 | ||
| Fig. 46 Schematic of test equipment and tank used by Taghvaei et al. (1) Electromotor, (2) cable to transmit motion, (3) supporting structures, (4) datalogger to record drag values, (5) dynamometer to measure exerted drag on the surface by the water, (6) superhydrophobic substrate connected by threaded shaft and nut, (7) towing tank, (8) wire to transmit data, (9) wire to transmit commands and (10) processing computer. Reproduced with permission from ref. 209. Copyright (2017) Elsevier Ltd. | ||
By also testing an as-received aluminium sheet the percentage drag reduction could be calculated. For the hierarchically structured surface, drag reduction was achievable over a wider range of velocities with reductions ranging between 7–77%. On the single scale surface, a drag reduction of 78% was achieved at 0.1 m s−1, however, this decreased with increasing velocity to the point that no reduction was seen at velocities greater than 0.38 m s−1. Furthermore, the drag after this point was even higher than that of the smooth as bought aluminium. It was concluded that on the hierarchical structure, nanoparticles embedded in the micro-particles delay water from entering the pores and so stabilise the trapped air at higher velocities, allowing the air to reduce the drag forces. When only nanoparticles existed, water was easily pushed into the surface at higher velocities, increasing the contact area and hence the drag force.
Recently Xu et al. utilised a high-speed towing tank to produce high-Reynolds-number flows, similar to that which would be seen for boats in open waters (Fig. 47).210 A superhydrophobic surface composed of micro-trenches was chosen in which careful consideration of plastron stability was observed during fabrication. Whilst a larger trench would allow for higher fluid slip and as such greater drag reduction, smaller trenches would increase the stability against diffusion and hydrostatic pressure (Section 4). The final trench composed of a gas fraction of approximately 90%. Further still re-entrant edges were produced to aid in the pinning of the plastron and preserve the drag reduction. The towing speed went to a maximum of 10.06 m s−2 (Re = 1.12 × 10⁷). The results showed an increase in drag reduction at low/medium speeds up to a maximum of 27%. However, upon reaching higher speeds all drag reduction was lost due to a loss of plastron (as seen via optical camera and applied thresholds).210 This work by Xu et al. highlights the importance of reporting testing parameters due to the effect of flow on the measured drag reduction.
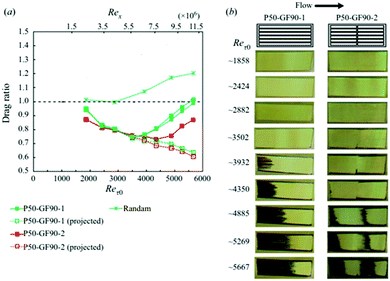 | ||
| Fig. 47 (a) Towing experiment results showing the drag ratio (relative to a smooth surface). P50-GF90 refers to a pitch of 50 μm and 90% gas area fraction for the trench structures. The ordered trenches were also compared to a random structured superhydrophobic material. On the trenches, drag reduction increased with increased flow rate up until too much wetting occurred at a Re value of ∼6 × 10⁶ and ∼8 × 10⁶, after which the drag reduction began to decrease. The random structure on the other hand showed a continued decrease in drag reduction with increased speed. (b) Pictures of the superhydrophobic surface after towing tests at increasingly high Reynolds numbers. Wetted areas are visible as the darker regions and areas where the plastron remains are bright. An increased loss of air is visible at higher speeds. (a and b) Reproduced with permission from ref. 210. Copyright (2020) Xu et al., Published by Cambridge University Press. | ||
All these studies have demonstrated the potential of superhydrophobic surfaces to minimise drag as a direct result of trapped air in a laboratory environment. However, further testing is required if the materials are to be implemented in real-world environments and for long-term use. There are two ways in which the drag-reducing properties of the material can be lost; either through the loss of plastron (via diffusion, hydrostatic pressure, etc.) or by loss of surface features, the former of which is discussed in Section 4. The micro/nanostructures, fundamental to superhydrophobicity are inherently weak, as such the surface roughness can readily be lost. Unlike the loss of trapped air which can be recovered using techniques such as air injection and gas generation, damage to surface structures is permanent and cannot be recovered. Partial removal of surface roughness by degradation may reduce the volume of air that can be trapped in the surface and hence, increase the extent of drag felt by the surface coating. Further still, complete removal or surface features would result in a complete loss of superhydrophobicity and drag-reducing properties. Therefore, it is vital when fabricating materials and coatings to reduce drag that both the mechanical stability of the surface and the stability of the air layer are considered.
7.2 Antifouling
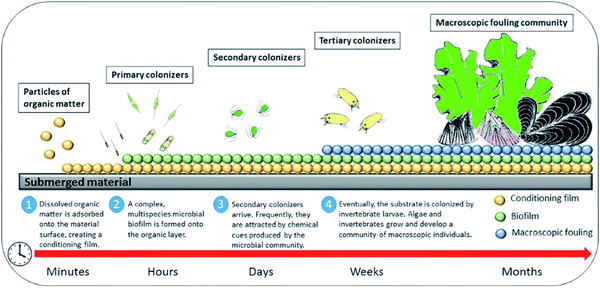 | ||
| Fig. 48 The sequence and time scale of each stage of the biofouling process. Reproduced with permission from ref. 212. Copyright (2015) Martín-Rodríguez et al. | ||
The biofouling process is generally initiated by the deposition of a conditioning film, which is a thin coating that helps promote microbial attachment, and is primarily composed of proteins and glycoproteins,211 but may also contain other organic and inorganic molecules.213 The deposition of proteins on surfaces is largely driven by physiochemical dynamics and protein stability, in addition, electrostatic interactions are also considered to play a role. In an aqueous environment, softer proteins (those with lower internal stability) can denature, exposing hydrophobic cores, which in turn may favourably bind to hydrophobic materials.214,215 Electrostatic interaction of proteins with the surface is highly dependent on the type of suspension medium, local conditions (e.g. temperature), and individual protein characteristics.216 The formation of the conditioning layer has been shown to occur within minutes of immersion in seawater. In underwater environments, the conditioning layer facilitates the binding of microorganisms including bacteria, diatoms, and animal cells. This biofilm layer is occasionally referred to as the slime layer, as it can dramatically change the texture and appearance of surfaces. For much of the biofilm growth process it is not readily visible, however, the final phase of fouling in marine environments is the growth of macroscopic organisms such as algae.217
Once microorganisms establish a biofilm, they can become highly resistant to both chemical and physical means of removal. The biofilm presence can have a considerable effect on a material's performance, for example, an increase in fluid drag, which can drastically decrease the fuel efficiency of marine vessels (as discussed in Section 7.1). Fouling can also accelerate corrosion of marine vessels, as the attachment/growth of biofilms can accelerate surface-based reactions.218,219 Also, biofouling has associated ecological implications, as it can facilitate the transportation of invasive species to new environments.211,220
Thus, superhydrophobic surfaces are of growing interest as their antifouling properties do not require biocides, therefore, lowering their ecological impact compared with conventional technologies. Superhydrophobic surfaces are also of particular interest in the prevention of biofouling due to the presence of the plastron. While it has been demonstrated that the presence of an air layer is not a necessary condition for superhydrophobic surfaces to repel all bacteria,223 the trapped air decreases surface-water contact area, and therefore also limits contact with waterborne components, including proteins and microbes. Thus decreasing the likelihood of hydrophobic and electrostatic interactions and molecular rearrangement/attachment to the surface. Generally, most antifouling approaches tend to be overcome in environments with a high protein concentration.224
Considering the highly dynamic and complex nature of the biofouling process, it is not surprising that a universally antifouling design has yet to be reported to our knowledge. Similarly, evaluation of antifouling properties must be done appropriately. It is difficult to conclude as designs are evaluated inconsistently; however, certain testing regimes may be more informative of the ultimate performance of an antifouling design than others. For example, Ferrari et al.225 compared commercially available fluoropolymer antifouling blend (non-superhydrophobic) with a superhydrophobic coating on aluminium alloy samples through mesocosm experiments, in which samples were exposed to replicated euphotic seawater conditions for three weeks. Their evaluation demonstrated similar antifouling behaviour between their superhydrophobic coating and a biocidal, fluoropolymer antifouling coating. They also noted that the superhydrophobicity of their surface was ultimately lost, suggesting that other factors such as temperature, sunlight irradiation, and other environmental variables are important factors for the design of superhydrophobic coatings for marine antifouling applications. They also suggest that the process of applying superhydrophobic coatings may be critical in maintaining its properties, as shown in Fig. 49. Methods such as those employed by Ferrari et al. in which the material is submerged in its intended environment is likely to be more representative of its overall performance compared to those with laboratory-based approaches since various relevant physiochemical dynamics would be encountered. Furthermore, such an approach does not require prior knowledge of the microbes and proteins that may be present or their behaviour in artificial environments.
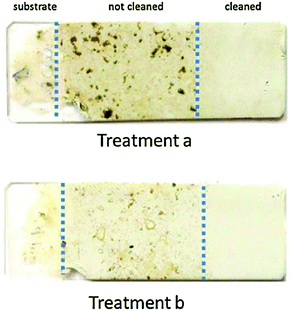 | ||
| Fig. 49 Macroscopic biofouling coverage after one-week exposure in marine mesocosms that allowed for the development of shallow sea-water photobiology. Treatment (a) refers to the application of the superhydrophobic coating when the undercoating was completely dry, treatment (b) refers to the application of the superhydrophobic coating when the substrate undercoat was not yet dry. Reproduced with permission from ref. 225. Copyright (2015) Elsevier B.V. | ||
Some designs for superhydrophobic surfaces also incorporate bactericidal components such as copper nanoparticles to boost their efficacy.226 While superhydrophobicity can reduce adhesion, inactivation of adherent bacterial would further prevent biofouling. Antibacterial mechanisms can include photocatalytic effects that produced reactive oxygen species, compromising of the bacterial membrane, or the disruption of electron transport in bacterial membranes.227 Other designs attempt to prolong the lifespan on antifouling properties by plastron regeneration.49
Currently, universal repulsion of bacteria using superhydrophobic surfaces has yet to be achieved, with current efforts focusing on optimising surface architectures to facilitate this property.224 When generally considering the microbial adhesion to surfaces, an increase in surface roughness typically enhances bacterial binding – which is not the case for superhydrophobic materials and is likely due to the plastron. Due to the range of protein dynamics and varied microbial adhesion strategies that play a role in the interaction with a material surface, creating a surface that universally repels bacteria under all conditions is unlikely;228–230 however, strategies to preserve and regenerate the plastron seem to be the most promising. Though even temporary loss of the plastron may facilitate the formation of a conditioning film and negation of superhydrophobic surface architecture. Due to inconsistent testing methodologies, evaluating between designs and drawing generalisable conclusions regarding surface architecture is difficult.
7.3 Underwater gas/involving reactions
Countless chemical reactions involve the generation/consumption of gas. For many of these, the reaction medium is water, bringing to interest the wettability of the reaction catalyst/electrode as it can be crucial in the reaction progression. Well reported examples for such reactions include; hydrogen evolution reactions (HER, gas generation) and oxygen reduction reactions (ORR, gas consumption), which are significant for many applications, particularly those related to energy generation and storage, and chemical synthesis.62,231–235 Both HER/ORR reactions take place in aqueous media, however, the interfacial chemical dynamics in each reaction necessitate variation in targeted catalyst designs. The surfaces where these reactions take place (e.g. catalyst/electrode) play a vital role in facilitating the reaction, which determines its efficiency and resulting industrial costs.233 For gas-generating reactions, the accumulation of gaseous products on the reaction surface hinders the accessibility of reactants to reaction sites, which significantly lower the reaction efficiency.233 Surfaces with a hydrophilic nature are desirable for these reactions, as their strong interaction with water would be preferred over gas bubbles, and hence these bubbles would be displaced by water once generated. In contrast, the gas-consuming reactions that occur underwater suffer from the insufficient delivery of reactant gases through water covering the surface, especially if gases involved have low solubilities in water.64,233 In this case, the surface ability to sustain a gas layer in close proximity to reaction sites is crucial to sustaining an ongoing reaction.64,233,236Complementary to this, underwater gas transportation becomes essential in many processes, including underwater micro-reactions, water treatment, and selective aeration.237–241 Whether gases are meant to be delivered to the reaction place or removed away from it, controlling the bubbles pathway is important for process completion.233,242 Generally, bubble movement is influenced by buoyancy forces, which could make the process less concerning in some cases.237,239 However, when directional and continuous transportation is required, effective manipulation and control need to be applied. In addition, relying on buoyancy, while being possible for small bubbles, becomes inefficient when bubble volume increases.233,237,239 For these reasons, finding a method to provide sufficient gas transportation is required.
As the focus in this review is on underwater superhydrophobicity, processes where the air is being pulled away from the surface are not discussed here, as aerophobic (air-repellent) surfaces underwater tend to be hydrophilic in air. Therefore, gas-consuming reactions and gas transportation, as examples for events that need superhydrophobic surfaces, are discussed in this section.
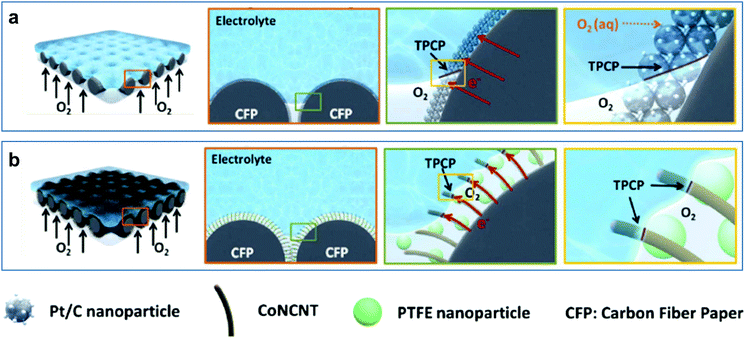 | ||
| Fig. 50 (a) A schematic for Pt/C commercial catalyst used in ORR, showing the reduced TPCPs and the insufficient delivery of O2 gas. (b) A schematic for the proposed design using CoNCNT electrode, showing how the structure arrangement allows for higher TPCPs and a sustained layer of O2 gas. (a and b) Reproduced with permission from ref. 64. Copyright (2016) Wiley-VCH Verlag GmbH & Co. KGaA. | ||
Another example where the availability of O2 underwater becomes significant is wastewater treatment. Using photocatalysis to generate charge carriers (i.e. electrons/holes) can be effective for the decomposition of organic contaminants.244 However, electrons and holes can easily recombine again, reducing activity, which is the primary limitation of this process. To avoid this, O2 is used as a stable carrier for electrons. Sheng et al. reported the fabrication of TiO2-nanoparticles deposited on a porous PTFE-treated carbon fibre substrate.244 The high porosity of the structure allows water to wet the TiO2-catalyst surface while not penetrating further to displace trapped O2, and hence, solid–liquid–gas contact is achieved.244
Gao et al. have utilized surface-enhanced Raman spectroscopy (SERS) to investigate the effect of surface wetting behaviour on the plasmon-driven catalytic-coupling reaction of p-aminothiophenol (PATP) into p,p′-dimercaptoazobenzene (DMAB), which require the presence of O2 as an oxidizing agent for PATP molecules.236 A hierarchical surface made from silver micro-balls decorated with silver nano-dendrites was employed as a SERS active reaction surface, and surface-modification was carried out to make samples with different wetting behaviours; hydrophilic, hydrophobic and superhydrophobic.236 It was revealed that for superhydrophobic surfaces, a higher Raman intensity was detected for PATP binding to the catalyst surface, indicating an increase in the reaction dynamics.236
Other gases have been involved additionally in underwater gaseous reactions. CO2 reduction provides an interesting way to both recycle CO2 harmful emissions and to produce other valuable chemicals.243,245 Chen et al. reported the selective reduction into CO using a superhydrophobic carbon nanofibre (CNF)-based system, in which Ni-incorporated N-doped CNTs were grown vertically on its surface (Fig. 51).243 The fibres were then treated by PTFE to add the hydrophobic nature, as well as to enhance the mechanical properties and long-term durability of the system. In addition, the PTFE-H-NiNCNTs-CNF structure enhanced the selectivity of the catalyst to CO2 reduction over H2O reduction into H2, which takes place with the desired reaction for the un-coated NiNCNTs-CNF.243 This is explained by the superhydrophobic nature of the PTFE-coated fibres, which reduces water binding to the reaction sites and also preserves an air layer to feed the main reaction. Similarly, Cai et al. used a PTFE-modified Cu nanoarray electrode for the same reaction.245 Again, the porous Cu surface allows CO2 transportation, while the hydrophobic treatment decreased H2 production to less than the half compared to the untreated electrode.245
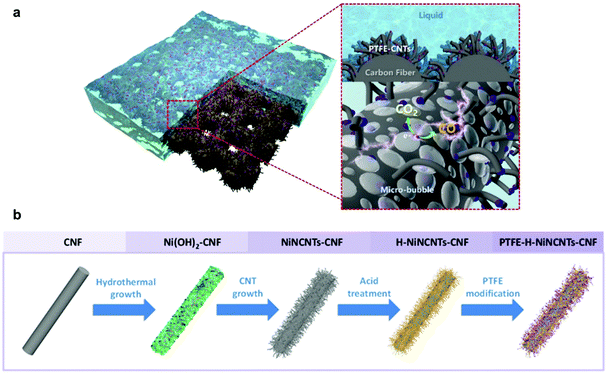 | ||
| Fig. 51 (a) A schematic for CO2 reduction reaction over PTFE-H-NiNCNTs-CNF surface. The superhydrophobic nature allows for micro-bubble adhesion on the surface underwater and helps reaction progression. (b) A schematic for the fabrication method. Macroporous CNF were used to vertically grow Ni-incorporated N-doped CNTs and then treated with PTFE to give the hydrophobic properties. (a and b) Reproduced with permission from ref. 243. Copyright (2019) American Chemical Society. | ||
Another reaction field that has been investigated by Li et al. is liquid hydrogenation, which is widely applied in many chemical and pharmaceutical processes.246 Superhydrophobic surfaces provide a way to solve the main kinetic limitation of these reactions embodied in the low hydrogen concentration in the aqueous environment.246 Pd catalyst nanoparticles were loaded on a graphene aerogel, and the hydrophilicity of the surface was changed and tested for hydrogenation reaction. The highest observed reaction rate was achieved with superhydrophobic samples.246
This concept provides a promising way to enhance the rate and efficiency of gas-consuming reactions that occur underwater. By making participating gases more abundant around the reaction sites, the reaction can progress much further in comparison to other designs that do not prevent a complete wetting of the catalyst. This could lead to a facilitated operation process and lower costs.
Copper cones have been reported for directional transportation.63,237 Yu et al. utilized roughened cones and treated them with a low-surface-energy coating, which showed bubble movement from the cone tip towards the base.63 This movement direction was maintained regardless of cone alignment, even travelling against buoyancy forces when the cone tip is pointing up (cone is standing vertically on its base). They also reported that higher transportation velocity was achieved with smaller bubble volume and higher apex angles (Fig. 52a–d).63 In a comparison between superhydrophobic and hydrophobic cones, it was found that hydrophobic cones display a random arrangement of micro/nanobubbles adhered to the surface that is not sufficient to facilitate movement. This was rationalised through the high hysteresis resistance force (FH) acting in the opposite direction of the movement of the bubbles. In contrast, the air film adhering to the superhydrophobic cone surface decreases FH to almost 0 μN, and hence, the Laplace force (FL) pushes the bubble along the cone axis (Fig. 52e and f).63 Benefiting from this, Xue et al. applied superhydrophobic copper cones to remove CO2 microbubbles which stagnate on metal surfaces underwater and accelerate corrosion, leading to potential surface damage.237 Duan et al. replicated this with polymer-based cones (made from PTFE and textured using a two-step femtosecond laser direct writing technique). The cones maintained gas-transport ability after immersion in different corrosive solutions (1 M HCl, 1 M NaOH, and 10 wt% NaCl).249
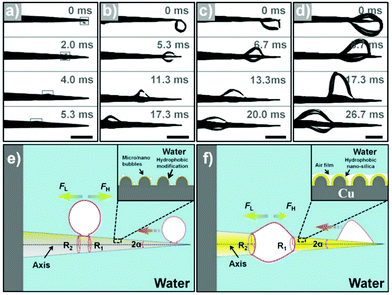 | ||
| Fig. 52 (a–d) Recorded images for directional transportation of gas bubbles on copper cones with apex angle 5°. The bubble volume used was (a) 0.02, (b) 0.50, (c) 4.20, and (d) 14.20 μL. (e and f) Schematics showing the mechanism of bubble transportation on a hydrophobic (e) and a superhydrophobic (f) copper cones. Randomly-arranged bubbles on the hydrophobic surface, in contrast to the superhydrophobic cone, does not form a continuous air film which increases hysteresis resistance force (FH). (a–f) Reproduced with permission from ref. 63. Copyright (2016) Wiley-VCH Verlag GmbH & Co. KGaA. | ||
Aiming to achieve a more controlled delivery, Yu et al. suggested a superhydrophobic helix structure with a high air-affinity (Fig. 53a–c) to transport bubbles sticking to its surface.250 The mechanism is illustrated in Fig. 53d and e. Buoyancy forces keep the bubble always adhering to the highest point of the helix rather than sticking to a single physical point on it. Subsequently, the bubble is moving from one helix ring to another, instead of rotating with one single ring. As the helix rotates, the bubble will be remain pushed to the top, which makes the bubble travel along the helix towards the rotation axis. In this way, the transportation velocity can be controlled by changing the spacing length of the helix and rotational speed, with larger spaces and speeds, allowing for faster delivery.250 The effect of bubble volume was examined, with small bubbles (5 μL) adhering strongly to the helix surface, which causes them to rotate with the helix instead of being moved along it. Conversely, large bubbles (30 μL) were not well adhered to the surface and were easily released from the helix. Volumes between these two extremes could be transported successfully.250 Due to the high controllability of the delivery speed for such small gas volumes, a micro-reaction between H2 and O2 bubbles placed on two attached oppositely-rotating helixes was conducted. This opens pathways for enhancing the efficiency of aqueous reactions in micro-systems.250
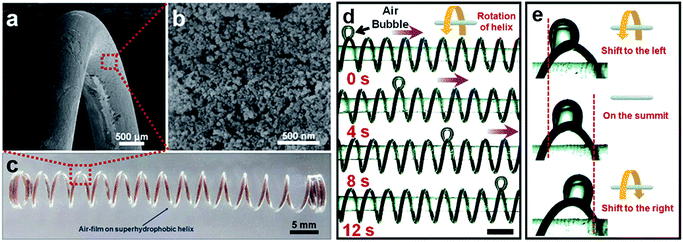 | ||
| Fig. 53 (a and b) SEM images of the superhydrophobic helix, where the nanostructuring of its surface is shown in (b). (c) An optical picture of the helix underwater, with the shiny surface indicating its superhydrophobicity. (d) Shows the bubble movement with time. As the bubble sticks to the helix summit, the helix rotation makes the bubble shifts to the direction of the rotation axis. Scale bar = 5 mm (e) illustrates how the bubble stays at the helix summit during its rotation. (a–e) Reproduced with permission from ref. 250. Copyright (2016) The Royal Society of Chemistry. | ||
Cao et al. investigated how hydrophilic defects on superhydrophobic surfaces can change the gas-delivery mechanism, and used this to induce directional transportation.251 Laser ablation was used to create precise defects, ranging between slight, medium and serious. They showed that for a defect-free surface, the bubble tends to spread creating a gas film, and then re-collect and detach at the release point (Fig. 54a). Inducing defects creates a motion barrier, making gas-layer formation difficult. The bubble volume increases (volume of air forming a gas-layer decrease) as defects get more severe, until reaching the surface with serious defects where the transportation is failed (Fig. 54b–d). This is explained by the decreased width between two defects, which enhances the surface resistance for bubble motion. Using this finding, an anisotropic angular defect has been created to induce unidirectionality (Fig. 54e–h). In the transporting direction, the bubble starts to accumulate at the small tip of the defect but will pass through it and continue moving. At the release (opposite) direction, the long defect sides will create a larger resistance force, stopping bubble progression.251
 | ||
| Fig. 54 (a–d) The effect of increased defects on gas transportation behaviour, compared with the defect-free surface. (e–h) An anisotropic defect can support bubble transformation through one direction only and suppress it in the opposite direction. (a–h) Reproduced with permission from ref. 251. Copyright (2018) American Chemical Society. | ||
The previous systems are examples of gas transportation methods on open surfaces. An issue that open surfaces may suffer from is the resistant buoyancy forces, which intensify when the transportation occurs in the opposite direction of the buoyancy force component.241 A pipe-like design could provide a solution for this, as such forces get reduced in closed surfaces. This also could be beneficial in cases where physical forces become insufficient for transportation, like transporting large bubble volumes or under high depths.241 Zhang et al. suggested superhydrophobic yarn-like fibres were to be used for this purpose.241 The resistance-force reduction was indicated by the consistent flow from the injection point to the highest escape point (yarn end), regardless of how the yarn was being shaped. Moreover, when the yarn is U-shaped with one of the ends being underwater, the gas flow was observed indicating siphon-effect.241 Another system that combines both storage and transporting capabilities was reported by Chen et al.240 as a way to collect and eliminate methane generated under oceans and avoid its release into the atmosphere, as it contributes significantly to the greenhouse effect.252–254 Porous polyurethane sponges were dip-coated by a silica nanoparticles/polystyrene mixture to add the hydrophobic nature. In comparison to other porous materials reported for methane storage (zeolites, metal–organic frameworks, porous coordination polymers, etc.), the superhydrophobic nature of these sponges protects them from being filled with water, saving all the storage capability selectively for methane bubbles. The effect of increasing immersion depths on the absorbed methane was found to be advantageous, due to the additional water pressure compressing larger methane volumes into the sponges. Finally, the collection of the absorbed gas from an immersed sponge was achieved by connecting it to a pipe, where the gas was driven along if by the differential pressure.240
As a part of constructing a transportation system, it is important to control the pathway of the gas molecules. Fabricating sheets that can either allow/block the gas flow has been reported. Yong et al. used femtosecond laser ablation to structure sheet materials (including Al, stainless steel, Cu, Ni, Si (all were subsequently modified by FAS), PTFE and PDMS).255,256 The resultant material changes its gas-passage behaviour depending on its hydrophobicity state, with the hydrophilic (underwater aerophobic) sheets block gas passage due to low surface affinity to bubble-interaction, and the sheets with opposite properties allow gas flow through them.256 In another report, they used this behaviour to create a device that removes gas from water and forces it to leave through a designated route.257 This was made by placing a rough copper mesh (hydrophilic) against water flow as a filter to pass through, while covering a side-hole with FAS-treated mesh (hydrophobic) to act as a gas-exit gate. A similar concept was used to make a gas-collecting device as well.257
A more advanced approach was reported by Chen et al. for which the gas passage is unidirectional.258 In the previous examples, the homogeneity in the hydrophobicity state for both sheet sides equalises the passage behaviour in both flow directions. In contrast, Chen et al. fabricated a “Janus mesh”, which is a mesh with two different wettabilities on each side.61 TiO2 nanoparticles were used to cap one side during the hydrophobic treatment, followed by a UV application on that side, generating a hydrophilic-top/superhydrophobic-bottom mesh (Fig. 55a). This hybrid nature of the mesh imposes a single direction delivery of gas bubbles, as bubbles adhere to the superhydrophobic side, resulting in a blockage of flow (Fig. 55b and c).258 An important difference to note here is that, opposite to the homogeneously hydrophobic membranes, the superhydrophobic (underwater superaerophilic) side in a Janus mesh would block the gas flow through the mesh towards the hydrophilic side. This is explained by the more favoured interaction between the superaerophilic side and gas bubbles, in comparison to the aerophobic nature of the other side. This would make bubbles stick to the membrane. In contrast, the unified aerophilic membranes can exchange gases freely between both sides, supporting gas flow. A similar approach was followed by Yin et al. who applied femtosecond laser direct writing technology on one side of a PTTE mesh, creating a hydrophobic/superhydrophobic asymmetry.257 Although the contrast in water-affinity nature was not huge, the hydrophobic side with Wenzel-wetting behaviour supported gas flow. In addition, Zhu et al. used laser ablation on one side of a superhydrophobic-coated copper foam to reverse the hydrophobic nature (Fig. 55d and e).238 This was used to unidirectionally transport CO2 and collect a maximum of 15 mL cm−2 min−1 which was effective to neutralize an alkaline solution connected to the Janus foam. This reflects the potential of these systems in underwater organic-gas harvesting.
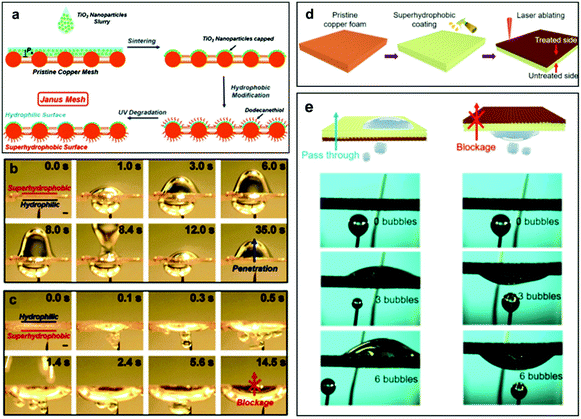 | ||
| Fig. 55 (a) A schematic for the fabrication of Janus mesh with a TiO2 nanoparticles hydrophilic-coated side and a hydrophobic-modified copper on the other side. (b and c) shows the penetration/blockage of air bubble travelling through the hydrophilic/superhydrophobic side of the mesh, respectively. (d) A schematic of the fabrication another Janus foam, where laser ablation was used to treat one side of the foam. (e) Shows the passage behaviour of air bubbles through each of the foam sides. (a–c) Reproduced with permission from ref. 258. Copyright (2015) Royal Society of Chemistry. (d and e) Reproduced with permission from ref. 238. Copyright (2020) American Chemical Society. | ||
The achieved progress in making gas-transporting surfaces brings us closer to designing fully functional systems that selectively transport gas to/from the desired media, with a control on the flow parameters that enables optimum results. With remaining challenges relating to transport volume and time, the applicability of the process still needs further developments.
8 Conclusions
The literature covered in this review embraces a range of topics related to air layer stability at submerged superhydrophobic surfaces. The understanding of the impact of the air layer on the surface properties/functionality underwater has been established from various examples of natural underwater superhydrophobic surfaces, like water-bound insects and the famous Salvinia leaf. This impact has been utilized to differentiate between different wetting states of the surface and to track the plastron decay, which enables surface characterization using a range of optical, force-based, acoustic and electrochemical methods. With the information obtained using these characterization techniques, different theories have been confirmed to affect plastrons lifetime and challenge their real-life applications. These include pressure exerted by water, diffusion of trapped air and condensation. The understanding of natural occurring plastrons and their performance in challenging environments have been transferred into designing surfaces with high air retention underwater. While some designs were inspired by natural-existing structures, other reports suggested controlling the ambient environment (introducing adjustable plastrons pressure, reducing gas-solubility of water to control plastron diffusion, etc.) to reduce its detrimental effect on plastron lifetime. Among these suggested designs, the highest performing materials were highlighted to probe current achievements and to look into their applicability. Finally, examples of applications where underwater air-retention becomes crucial were discussed, these include drag reduction, anti-fouling and underwater gas-consuming processes/gas transportation.Although reaching a system with ultimate air-layer stability under severe conditions has not been achieved yet, the study of natural systems alongside man-made surfaces have suggested some common factors that enhance plastrons stability. As discussed, structural factors such as the size of air pockets can affect their lifetime, as smaller pockets tend to show higher stability against the pressure exerted by water. Another structural factor is the fabrication of rough geometries in a controlled/ordered pattern, compared with a statistical/random surface roughness. Random surface designs result in an uneven distribution of pocket sizes/air volumes, which could create points of defects in the surface that are less likely to remain stable with time and can induce a rapid decay of the remaining surface. In addition, although the fundamental science behind air-layer stability is generally well understood (Section 1.3), complexities are observed to arise when precisely engineered surfaces are exchanged for materials with a variant, less ordered morphology. The performance of those materials with irregular air bubble shape/size, distribution, and surrounding surface morphology, are particularly challenging to predict, model, and consequently optimise.259
The material choice also has an impact on water-pinning ability. It is suggested that systems with intermediate surface-energy material coatings or hybrid hydrophobic/hydrophilic coatings are more likely to hold water droplet above the air pockets and resist plastrons wetting, compared with superhydrophobic coatings with high water repellence.
Despite the amount of research that has been devoted to improving air-retention ability in superhydrophobic surfaces, there is a large gap between the performances of the developed systems and the targeted performance required for these systems to be implemented in a real-life application. This could be attributed to/hindered for many reasons, including the following:
• The development of underwater superhydrophobic materials involves a more complicated set of properties compared to those required for the typical development of superhydrophobic materials. For a superhydrophobic surface, maximisation of WCAs, and minimising contact angle hysteresis will lead to better functionality. This differs for surfaces fabricated for underwater stability. Particularly, the inclusion of water pinning points and having smaller air/solid ratios, which lead to an increase in the measured WCAs.
• As a result of the advantages offered by uniform surface architectures (highlighted earlier), the research field is dominated by precisely engineered materials with regular surface features. These are generally not suited to real-world application through direct scale-up.
• There is a disparity between some of the proposed testing systems and the consideration of the potential for wider applicability. Although some testing methods have been proven to be effective compared to other designs, these systems can be hard to implement. Some reports recommend putting the whole testing setup under pressure, and others attempted to gas-saturate a large amount of water to control air diffusion. Considering the scaling up of these methods, it would be challenging to ensure the same testing conditions are applied.
The review highlights the optimisation of air-layer stability as a key challenge, specifically, to identify the most successful surface architecture for resisting external degradation forces. The numerous testing methods discussed herein, further emphasises the complexity of monitoring air–water-surface interfaces. Due to this, there is a general lack of consistency across the literature, with many different probing forces (e.g. submersion pressure, or water flow rate) implemented, with differences also in adopted monitoring methods. Although not all the mentioned points could be avoided/solved, they open questions and possibilities for future improvements. The scalability and availability of advanced techniques required for designing precisely engineered surfaces could enhance the surfaces applicability and increase the potential for further developments. Adjusting the idealized successful systems to be more suited in the application field is also of great importance to maintain progress in real-life use. In addition, the above conclusions suggest that a unified testing regime for air layer retention would provide a greater understanding, and therefore a more rapid development of these materials. Although this is a logical deduction, it must also be considered that the different testing regimes (e.g. submersion depth vs. flow intensity) are designed around respective potential application areas. Therefore, a comprehensive examination of air-layer stability must be multifaceted. Future advances in this area must also stem from technological developments, providing greater availability, and methods with superior analytical power. This is of specific relevance to the visualisation in real-time of the complex solid–fluid interface on the micro/nanoscale, which can only currently be achieved through less common techniques including synchrotron X-ray imaging.260 The real-time monitoring of this interface will allow for a greater predictive ability to be achieved, and true progress to be accomplished.
Conflicts of interest
There are no conflicts to declare.Acknowledgements
The authors would like to thank the EPSRC and Royal Society for research funding.References
- M. Ghasemlou, F. Daver, E. P. Ivanova and B. Adhikari, J. Mater. Chem. A, 2019, 7, 16643–16670 RSC.
- Z. Guo, W. Liu and B.-L. Su, J. Colloid Interface Sci., 2011, 353, 335–355 CrossRef CAS PubMed.
- Y. Liu, H. Gu, Y. Jia, J. Liu, H. Zhang, R. Wang, B. Zhang, H. Zhang and Q. Zhang, Chem. Eng. J., 2019, 356, 318–328 CrossRef CAS.
- W. Barthlott and C. Neinhuis, Planta, 1997, 202, 1–8 CrossRef CAS.
- Y. Yang, X. Li, X. Zheng, Z. Chen, Q. Zhou and Y. Chen, Adv. Mater., 2018, 30, 1704912 CrossRef PubMed.
- X. Gao, X. Yan, X. Yao, L. Xu, K. Zhang, J. Zhang, B. Yang and L. Jiang, Adv. Mater., 2007, 19, 2213–2217 CrossRef CAS.
- J. Yao, J. Wang, Y. Yu, H. Yang and Y. Xu, Chin. Sci. Bull., 2012, 57, 2631–2634 CrossRef.
- G. D. Bixler and B. Bhushan, Nanoscale, 2014, 6, 76–96 RSC.
- C. Neinhuis and W. Barthlott, Ann. Bot., 1997, 79, 667–677 CrossRef.
- R. L. Upton and C. R. Crick, Mol. Syst. Des. Eng., 2020, 5, 876–881 RSC.
- S. Gao, J. Huang, S. Li, H. Liu, F. Li, Y. Li, G. Chen and Y. Lai, Mater. Des., 2017, 128, 1–8 CrossRef CAS.
- G. B. Hwang, A. Patir, K. Page, Y. Lu, E. Allan and I. P. Parkin, Nanoscale, 2017, 9, 7588–7594 RSC.
- H. Qian, D. Xu, C. Du, D. Zhang, X. Li, L. Huang, L. Deng, Y. Tu, J. M. C. Mol and H. A. Terryn, J. Mater. Chem. A, 2017, 5, 2355–2364 RSC.
- N. A. Patankar, Langmuir, 2004, 20, 8209–8213 CrossRef CAS PubMed.
- R. Chen, Y. Wan, W. Wu, C. Yang, J.-H. He, J. Cheng, R. Jetter, F. K. Ko and Y. Chen, Mater. Des., 2019, 162, 246–248 CrossRef CAS.
- R. Fürstner, W. Barthlott, C. Neinhuis and P. Walzel, Langmuir, 2005, 21, 956–961 CrossRef PubMed.
- R. L. Upton, Z. Davies-Manifold, M. Marcello, K. Arnold and C. R. Crick, Mol. Syst. Des. Eng., 2019, 5, 477–483 RSC.
- Y. A. Mehanna, R. L. Upton and C. R. Crick, J. Mater. Chem. A, 2019, 7, 7333–7337 RSC.
- H. C. Barshilia and N. Gupta, Vacuum, 2014, 99, 42–48 CrossRef CAS.
- J. Lomga, P. Varshney, D. Nanda, M. Satapathy, S. S. Mohapatra and A. Kumar, J. Alloys Compd., 2017, 702, 161–170 CrossRef CAS.
- Y. Shi, Z. Jiang, J. Cao and K. F. Ehmann, Appl. Surf. Sci., 2020, 500, 144286 CrossRef CAS.
- Y. A. Mehanna and C. R. Crick, Materials, 2020, 13, 3160 CrossRef CAS PubMed.
- L. Wen, Y. Tian and L. Jiang, Angew. Chem., Int. Ed., 2015, 54, 3387–3399 CrossRef CAS PubMed.
- N. Verplanck, Y. Coffinier, V. Thomy and R. Boukherroub, Nanoscale Res. Lett., 2007, 2, 577 CrossRef CAS.
- M. Callies and D. Quere, Soft Matter, 2005, 1, 55–61 RSC.
- C. Dorrer and J. Ruhe, Soft Matter, 2009, 5, 51–61 RSC.
- M. Miwa, A. Nakajima, A. Fujishima, K. Hashimoto and T. Watanabe, Langmuir, 2000, 16, 5754–5760 CrossRef CAS.
- J. Bico, U. Thiele and D. Quéré, Colloids Surf., A, 2002, 206, 41–46 CrossRef CAS.
- I. U. Vakarelski, N. A. Patankar, J. O. Marston, D. Y. C. Chan and S. T. Thoroddsen, Nature, 2012, 489, 274–277 CrossRef CAS PubMed.
- D. Quéré, Annu. Rev. Fluid Mech., 2013, 45, 197–215 CrossRef.
- A. B. D. Cassie and S. Baxter, Trans. Faraday Soc., 1944, 40, 546–551 RSC.
- R. N. Wenzel, Ind. Eng. Chem., 1936, 28, 988–994 CrossRef CAS.
- R. N. Wenzel, J. Phys. Chem., 1949, 53, 1466–1467 CrossRef CAS.
- D. Quéré, A. Lafuma and J. Bico, Nanotechnology, 2003, 14, 1109 CrossRef.
- L. Gao and T. J. McCarthy, Langmuir, 2006, 22, 6234–6237 CrossRef CAS PubMed.
- A. Lafuma and D. Quéré, Nat. Mater., 2003, 2, 457–460 CrossRef CAS PubMed.
- X. Tian, S. Shaw, K. R. Lind and L. Cademartiri, Adv. Mater., 2016, 28, 3677–3682 CrossRef CAS PubMed.
- Y. Lu, S. Sathasivam, J. Song, C. R. Crick, C. J. Carmalt and I. P. Parkin, Science, 2015, 347, 1132–1135 CrossRef CAS.
- R. Gupta, V. Vaikuntanathan and D. Sivakumar, Colloids Surf., A, 2016, 500, 45–53 CrossRef CAS.
- H. Xu, C. R. Crick and R. J. Poole, J. Mater. Chem. A, 2018, 6, 4458–4465 RSC.
- C. R. Crick, Superhydrophobic Surfaces-Fabrications to Practical Applications, IntechOpen, 2018, pp. 11–38 Search PubMed.
- K. Golovin, M. Boban, J. M. Mabry and A. Tuteja, ACS Appl. Mater. Interfaces, 2017, 9, 11212–11223 CrossRef CAS PubMed.
- X. Zhang, D. Zhi, L. Sun, Y. Zhao, M. K. Tiwari, C. J. Carmalt, I. P. Parkin and Y. Lu, J. Mater. Chem. A, 2018, 6, 357–362 RSC.
- D. Quéré, Annu. Rev. Mater. Res., 2008, 38, 71–99 CrossRef.
- D. Panchanathan, A. Rajappan, K. K. Varanasi and G. H. McKinley, ACS Appl. Mater. Interfaces, 2018, 10, 33684–33692 CrossRef CAS PubMed.
- L. Whitehead, M. Mossman and A. Kushnir, Phys. Canada, 2008, 64, 7–12 Search PubMed.
- B. V. Hokmabad and S. Ghaemi, Sci. Rep., 2017, 7, 1–10 CrossRef.
- C.-H. Xue, X. Bai and S.-T. Jia, Sci. Rep., 2016, 6, 27262 CrossRef.
- T. Simovich, A. Rosenhahn and R. N. Lamb, Adv. Eng. Mater., 2020, 22, 1900806 CrossRef CAS.
- J. Lee and K. Yong, NPG Asia Mater., 2015, 7, e201 CrossRef CAS.
- W. H. Thorpe, Biol. Rev., 1950, 25, 344–390 CrossRef CAS.
- M. T. Marx and B. Messner, Org. Divers. Evol., 2012, 12, 403–408 CrossRef.
- G. B. Hwang, K. Page, A. Patir, S. P. Nair, E. Allan and I. P. Parkin, ACS Nano, 2018, 12, 6050–6058 CrossRef CAS PubMed.
- F. Cirisano, A. Benedetti, L. Liggieri, F. Ravera, E. Santini and M. Ferrari, Colloids Surf., A, 2016, 505, 158–164 CrossRef CAS.
- P. Wang, R. Qiu, D. Zhang, Z. Lin and B. Hou, Electrochim. Acta, 2010, 56, 517–522 CrossRef CAS.
- M. Cheng, M. Song, H. Dong and F. Shi, Small, 2015, 11, 1665–1671 CrossRef CAS PubMed.
- D. Saranadhi, D. Chen, J. A. Kleingartner, S. Srinivasan, R. E. Cohen and G. H. McKinley, Sci. Adv., 2016, 2(e1600686), 1–9 Search PubMed.
- N. J. Shirtcliffe, G. McHale, M. I. Newton and Y. Zhang, ACS Appl. Mater. Interfaces, 2009, 1, 1316–1323 CrossRef CAS PubMed.
- J. Song, Z. Liu, X. Wang, H. Liu, Y. Lu, X. Deng, C. J. Carmalt and I. P. Parkin, J. Mater. Chem. A, 2019, 7, 13567–13576 RSC.
- J. Yong, F. Chen, Y. Fang, J. Huo, Q. Yang, J. Zhang, H. Bian and X. Hou, ACS Appl. Mater. Interfaces, 2017, 9, 39863–39871 CrossRef CAS PubMed.
- S. Yang, K. Yin, D. Chu, J. He and J. A. Duan, Appl. Phys. Lett., 2018, 113, 203701 CrossRef.
- M. Qiao and M. Titirici, Chem. – Eur. J., 2018, 24, 18374–18384 CrossRef CAS PubMed.
- C. Yu, M. Cao, Z. Dong, J. Wang, K. Li and L. Jiang, Adv. Funct. Mater., 2016, 26, 3236–3243 CrossRef CAS.
- Z. Lu, W. Xu, J. Ma, Y. Li, X. Sun and L. Jiang, Adv. Mater., 2016, 28, 7155–7161 CrossRef CAS PubMed.
- A. A. Hemeda and H. V. Tafreshi, Langmuir, 2014, 30, 10317–10327 CrossRef CAS PubMed.
- J. Zhang, B. Li, L. Wu and A. Wang, Chem. Commun., 2013, 49, 11509–11511 RSC.
- W. Shen, C. Zhang, Q. Li, W. Zhang, L. Cao and J. Ye, J. Cleaner Prod., 2015, 87, 762–765 CrossRef CAS.
- A. Chabas, T. Lombardo, H. Cachier, M. H. Pertuisot, K. Oikonomou, R. Falcone, M. Verità and F. Geotti-Bianchini, Build. Environ., 2008, 43, 2124–2131 CrossRef.
- N. J. Shirtcliffe, G. McHale, M. I. Newton, C. C. Perry and F. B. Pyatt, Appl. Phys. Lett., 2006, 89, 104106 CrossRef.
- F. Vüllers, S. Peppou-Chapman, M. N. Kavalenka, H. Hölscher and C. Neto, Phys. Fluids, 2019, 31, 12102 CrossRef.
- W. Barthlott, T. Schimmel, S. Wiersch, K. Koch, M. Brede, M. Barczewski, S. Walheim, A. Weis, A. Kaltenmaier, A. Leder and H. F. Bohn, Adv. Mater., 2010, 22, 2325–2328 CrossRef CAS PubMed.
- M. A. Samaha, H. Vahedi Tafreshi and M. Gad-el-Hak, Phys. Fluids, 2012, 24, 112103 CrossRef.
- R. Poetes, K. Holtzmann, K. Franze and U. Steiner, Phys. Rev. Lett., 2010, 105, 1–4 CrossRef PubMed.
- X. Gao and L. Jiang, Nature, 2004, 432, 36 CrossRef CAS PubMed.
- D. Neumann and D. Woermann, SpringerPlus, 2013, 2, 1–7 CrossRef PubMed.
- Y. Xiang, S. Huang, T. Y. Huang, A. Dong, D. Cao, H. Li, Y. Xue, P. Lv and H. Duan, Proc. Natl. Acad. Sci. U. S. A., 2020, 117, 2282–2287 CrossRef CAS PubMed.
- A. Balmert, H. Florian Bohn, P. Ditsche-Kuru and W. Barthlott, J. Morphol., 2011, 272, 442–451 CrossRef PubMed.
- X. Feng and L. Jiang, Adv. Mater., 2006, 18, 3063–3078 CrossRef CAS.
- D. J. Crisp and W. H. Thorpe, Discuss. Faraday Soc., 1948, 3, 210–220 RSC.
- P. Ditsche, E. Gorb, M. Mayser, S. Gorb, T. Schimmel and W. Barthlott, Appl. Phys. A: Mater. Sci. Process., 2015, 121, 505–511 CrossRef CAS.
- D. L. Hu, B. Chan and J. W. M. Bush, Nature, 2003, 424, 663–666 CrossRef CAS.
- M. Dickinson, Nature, 2003, 424, 621–622 CrossRef CAS PubMed.
- M. A. Caponigro and C. H. Eriksen, Am. Midl. Nat., 1976, 95, 268 CrossRef.
- C. R. Crick and I. P. Parkin, Chem. – Eur. J., 2010, 16, 3568–3588 CrossRef CAS.
- R. S. Seymour and S. K. Hetz, J. Exp. Biol., 2011, 214, 2175–2181 CrossRef PubMed.
- N. N. Smirnov, Hydrobiologia, 1960, 15, 208–224 CrossRef.
- N. Andersen, Vidensk. Meddelelser fra Dansk Naturhistorisk Foren., 1976, 139, 337–396 Search PubMed.
- L. Rowe, Assoc. Study Anim. Behav., 1994, 48, 1049–1056 CrossRef.
- M. C. Parsons, Z. Morphol. Tiere, 1970, 66, 242–298 CrossRef.
- M. Amabili, A. Giacomello, S. Meloni and C. M. Casciola, Adv. Mater. Interfaces, 2015, 2, 1500248 CrossRef.
- Y. Xue, P. Lv, H. Lin and H. Duan, Appl. Mech. Rev., 2016, 68, 030803 CrossRef.
- M. Mail, M. Moosmann, P. Häger and W. Barthlott, Philos. Trans. R. Soc., A, 2019, 377, 20190126 CrossRef CAS PubMed.
- R. Dufour, N. Saad, J. Carlier, P. Campistron, G. Nassar, M. Toubal, R. Boukherroub, V. Senez, B. Nongaillard and V. Thomy, Langmuir, 2013, 29, 13129–13134 CrossRef CAS PubMed.
- J. Yu, H. Wang and X. Liu, Int. J. Heat Mass Transfer, 2013, 57, 299–303 CrossRef.
- D. Bartolo, F. Bouamrirene, E. Verneuil, A. Buguin, P. Silberzan and S. Moulinet, Europhys. Lett., 2006, 74, 299–305 CrossRef CAS.
- R. Dufour, M. Harnois, Y. Coffinier, V. Thomy, R. Boukherroub and V. Senez, Langmuir, 2010, 26, 17242–17247 CrossRef CAS PubMed.
- E. Bormashenko, R. Pogreb, G. Whyman and M. Erlich, Langmuir, 2007, 23, 6501–6503 CrossRef CAS.
- Z. Han, B. Tay, C. Tan, M. Shakerzadeh and K. Ostrikov, ACS Nano, 2009, 3, 50 Search PubMed.
- D. Wang, Q. Sun, M. J. Hokkanen, C. Zhang, F.-Y. Lin, Q. Liu, S.-P. Zhu, T. Zhou, Q. Chang, B. He, Q. Zhou, L. Chen, Z. Wang, R. H. A. Ras and X. Deng, Nature, 2020, 582, 59 Search PubMed.
- C. Peng, Z. Chen and M. K. Tiwari, Nat. Mater., 2018, 17, 355–360 CrossRef CAS PubMed.
- C. H. Kung, P. K. Sow, B. Zahiri and W. Mérida, Adv. Mater. Interfaces, 2019, 6, 1900839 CrossRef CAS.
- N. Saad, R. Dufour, P. Campistron, G. Nassar, J. Carlier, M. Harnois, B. Merheb, R. Boukherroub, V. Senez, J. Gao, V. Thomy, M. Ajaka and B. Nongaillard, J. Appl. Phys., 2012, 112, 104908 CrossRef.
- L. Gao and T. J. Mccarthy, Langmuir, 2009, 25, 14105–14115 CrossRef CAS PubMed.
- R. Dufour, M. Harnois, V. Thomy, R. Boukherroub and V. Senez, Soft Matter, 2011, 7, 9380–9387 RSC.
- P. Wang, J. Su, M. Shen, M. Ruths and H. Sun, Langmuir, 2017, 33, 638–644 CrossRef CAS PubMed.
- J. Lee and K. Yong, J. Mater. Chem., 2012, 22, 20250–20256 RSC.
- D. Axelrod, Traffic, 2001, 2, 764–774 CrossRef CAS PubMed.
- F. A. Schaberle, L. A. Reis, C. Serpa and L. G. Arnaut, New J. Phys., 2019, 21, 033013 CrossRef.
- M. S. Bobji, S. V. Kumar, A. Asthana and R. N. Govardhan, Langmuir, 2009, 25, 12120–12126 CrossRef CAS PubMed.
- J. Cheek, A. Steele, I. S. Bayer and E. Loth, Colloid Polym. Sci., 2013, 291, 2013–2016 CrossRef CAS.
- B. J. Lee, Z. Zhang, S. Baek, S. Kim, D. Kim and K. Yong, Sci. Rep., 2016, 6, 1–11 CrossRef PubMed.
- M. A. Samaha, H. Vahedi Tafreshi and M. Gad-el-Hak, Colloids Surf., A, 2012, 399, 62–70 CrossRef CAS.
- C. Luo, H. Zheng, L. Wang, H. Fang, J. Hu, C. Fan, Y. Cao and J. Wang, Angew. Chem., Int. Ed., 2010, 49, 9145–9148 CrossRef CAS PubMed.
- M. N. Kavalenka, F. Vüllers, S. Lischker, C. Zeiger, A. Hopf, M. Röhrig, B. E. Rapp, M. Worgull and H. Hölscher, ACS Appl. Mater. Interfaces, 2015, 7, 10651–10655 CrossRef CAS PubMed.
- F. Vüllers, Y. Germain, L. M. Petit, H. Hölscher and M. N. Kavalenka, Adv. Mater. Interfaces, 2018, 5, 1–8 Search PubMed.
- M. Röhrig, M. Mail, M. Schneider, H. Louvin, A. Hopf, T. Schimmel, M. Worgull and H. Hölscher, Adv. Mater. Interfaces, 2014, 1, 1–10 Search PubMed.
- A. Elbourne, M. F. Dupont, S. Collett, V. K. Truong, X. M. Xu, N. Vrancken, V. Baulin, E. P. Ivanova and R. J. Crawford, J. Colloid Interface Sci., 2019, 536, 363–371 CrossRef CAS PubMed.
- M. Moosmann, T. Schimmel, W. Barthlott and M. Mail, Beilstein J. Nanotechnol., 2017, 8, 1671–1679 CrossRef CAS PubMed.
- R. Wang, L. Cong and M. Kido, Appl. Surf. Sci., 2002, 191, 74–84 CrossRef CAS.
- A. Checco, H. Schollmeyer, J. Daillant, P. Guenoun and R. Boukherroub, Langmuir, 2006, 22, 116–126 CrossRef CAS PubMed.
- M. J. Mayser, H. F. Bohn, M. Reker and W. Barthlott, Beilstein J. Nanotechnol., 2014, 5, 812–821 CrossRef PubMed.
- J. Su, H. Esmaeilzadeh, P. Wang, S. Ji, M. Inalpolat, M. Charmchi and H. Sun, Sens. Actuators, A, 2019, 286, 115–122 CrossRef CAS.
- P. Roach, G. McHale, C. R. Evans, N. J. Shirtcliffe and M. I. Newton, Langmuir, 2007, 23, 9823–9830 CrossRef CAS PubMed.
- M. Lee, S. Lee, C. Yim and S. Jeon, Sens. Actuators, B, 2015, 220, 799–804 CrossRef CAS.
- J. C. Tuberquia, W. S. Song and G. K. Jennings, Anal. Chem., 2011, 83, 6184–6190 CrossRef CAS PubMed.
- J. C. Tuberquia, N. Nizamidin and G. K. Jennings, Langmuir, 2010, 26, 14039–14046 CrossRef CAS PubMed.
- L. Lei, H. Li, J. Shi and Y. Chen, Langmuir, 2010, 26, 3666–3669 CrossRef CAS PubMed.
- Y. C. Jung and B. Bhushan, Langmuir, 2008, 24, 6262–6269 CrossRef CAS PubMed.
- M. A. Samaha, H. V. Tafreshi and M. Gad-El-Hak, Langmuir, 2012, 28, 9759–9766 CrossRef CAS PubMed.
- J. F. Ou, X. Z. Fang, W. J. Zhao, S. Lei, M. S. Xue, F. J. Wang, C. Q. Li, Y. L. Lu and W. Li, Langmuir, 2018, 34, 5807–5812 CrossRef CAS PubMed.
- B. Emami, H. V. Tafreshi, M. Gad-El-Hak and G. C. Tepper, Appl. Phys. Lett., 2011, 98, 1–4 CrossRef.
- P. Lv, Y. Xue, Y. Shi, H. Lin and H. Duan, Phys. Rev. Lett., 2014, 112, 196101 CrossRef PubMed.
- H. Duan, Procedia IUTAM, 2017, 20, 128–135 CrossRef.
- H. Wu, Z. Yang, B. Cao, Z. Zhang, K. Zhu, B. Wu, S. Jiang and G. Chai, Langmuir, 2016, 33, 407–416 CrossRef PubMed.
- Y. Xue, S. Chu, P. Lv and H. Duan, Langmuir, 2012, 28, 9440–9450 CrossRef CAS PubMed.
- N. A. Patankar, Langmuir, 2016, 32, 7023–7028 CrossRef CAS PubMed.
- P. S. Epstein and M. S. Plesset, J. Chem. Phys., 1950, 18, 1505–1509 CrossRef CAS.
- P. Lv, Y. Xue, H. Liu, Y. Shi, P. Xi, H. Lin and H. Duan, Langmuir, 2015, 31, 1248–1254 CrossRef CAS PubMed.
- D. Dilip, S. Vijay Kumar, M. S. Bobji and R. N. Govardhan, Int. J. Heat Mass Transfer, 2018, 119, 551–563 CrossRef.
- D. Dilip, N. K. Jha, R. N. Govardhan and M. S. Bobji, Colloids Surf., A, 2014, 459, 217–224 CrossRef CAS.
- Z. Li, J. Marlena, D. Pranantyo, B. L. Nguyen and C. H. Yap, J. Mater. Chem. A, 2019, 7, 16387–16396 RSC.
- Y. Yang, X. Li, X. Zheng, Z. Chen, Q. Zhou and Y. Chen, Adv. Mater., 2018, 30, 1–11 CAS.
- O. Tricinci, T. Terencio, B. Mazzolai, N. M. Pugno, F. Greco and V. Mattoli, ACS Appl. Mater. Interfaces, 2015, 7, 25560–25567 CrossRef CAS PubMed.
- D. Zheng, Y. Jiang, W. Yu, X. Jiang, X. Zhao, C. H. Choi and G. Sun, Langmuir, 2017, 33, 13640–13648 CrossRef CAS PubMed.
- B. J. Deka, E. J. Lee, J. Guo, J. Kharraz and A. K. An, Environ. Sci. Technol., 2019, 53, 4948–4958 CrossRef CAS PubMed.
- C. F. Carlborg and W. van der Wijngaart, Langmuir, 2011, 27, 487–493 CrossRef CAS PubMed.
- P. Du, J. Wen, Z. Zhang, D. Song, A. Ouahsine and H. Hu, Ocean Eng., 2017, 130, 328–335 CrossRef.
- C. Lee and C. J. Kim, Phys. Rev. Lett., 2011, 106, 1–4 Search PubMed.
- A. P. Steigleder and L. Roldo, Rev. Mater., 2019, 24, e-12480 Search PubMed.
- D. J. Babu, M. Mail, W. Barthlott and J. J. Schneider, Adv. Mater. Interfaces, 2017, 4, 1–6 Search PubMed.
- O. Tricinci, T. Terencio, N. M. Pugno, F. Greco, B. Mazzolai and V. Mattoli, Micromachines, 2017, 8, 366 CrossRef PubMed.
- R. Di Mundo, F. Bottiglione, M. Notarnicola, F. Palumbo and G. Pascazio, Biomimetics, 2017, 2, 1 CrossRef PubMed.
- R. Di Mundo, F. Bottiglione, F. Palumbo, M. Notarnicola and G. Carbone, J. Colloid Interface Sci., 2016, 482, 175–182 CrossRef CAS PubMed.
- J. H. Crowe and K. A. Magnus, Comp. Biochem. Physiol., Part A: Mol. Integr. Physiol., 1974, 49, 301–309 CrossRef.
- M. Akram Raza, E. S. Kooij, A. Van Silfhout and B. Poelsema, Langmuir, 2010, 26, 12962–12972 CrossRef PubMed.
- J. Li, T. Kleintschek, A. Rieder, Y. Cheng, T. Baumbach, U. Obst, T. Schwartz and P. A. Levkin, ACS Appl. Mater. Interfaces, 2013, 5, 6704–6711 CrossRef CAS PubMed.
- R. Helbig, J. Nickerl, C. Neinhuis and C. Werner, PLoS One, 2011, 6, 25105 CrossRef PubMed.
- L. Chen, Z. Guo and W. Liu, J. Mater. Chem. A, 2017, 5, 14480–14507 RSC.
- A. K. Kota, G. Kwon and A. Tuteja, NPG Asia Mater., 2014, 6, 109 CrossRef.
- S. R. Gonzalez-Avila, D. M. Nguyen, S. Arunachalam, E. M. Domingues, H. Mishra and C. D. Ohl, Sci. Adv., 2020, 6, 6192–6219 CrossRef PubMed.
- E. M. Domingues, S. Arunachalam, J. Nauruzbayeva and H. Mishra, Nat. Commun., 2018, 9, 1–11 CrossRef CAS PubMed.
- E. M. Domingues, S. Arunachalam and H. Mishra, ACS Appl. Mater. Interfaces, 2017, 9, 21532–21538 CrossRef CAS PubMed.
- H. Zhao, K.-C. Park and K.-Y. Law, Langmuir, 2012, 28, 14925–14934 CrossRef CAS PubMed.
- A. Tuteja, W. Choi, M. Ma, J. M. Mabry, S. A. Mazzella, G. C. Rutledge, G. H. McKinley and R. E. Cohen, Science, 2007, 318, 1618–1622 CrossRef CAS PubMed.
- A. Tuteja, W. Choi, J. M. Mabry, G. H. Mckinley, R. E. Cohen and J. M. Prausnitz, Proc. Natl. Acad. Sci. U. S. A., 2008, 105, 18200–18205 CrossRef CAS PubMed.
- R. Hensel, R. Helbig, S. Aland, A. Voigt, C. Neinhuis and C. Werner, NPG Asia Mater., 2013, 5, e37 CrossRef.
- T. Liu and C. J. Kim, Science, 2014, 346, 1096–1100 CrossRef CAS PubMed.
- L. Cao, T. P. Price, M. Weiss and D. Gao, Langmuir, 2008, 24, 1640–1643 CrossRef CAS PubMed.
- L. Cao, H.-H. Hu and D. Gao, Langmuir, 2007, 23, 4310–4314 CrossRef CAS PubMed.
- A. Ahuja, J. A. Taylor, V. Lifton, A. A. Sidorenko, T. R. Salamon, E. J. Lobaton, P. Kolodner and T. N. Krupenkin, Langmuir, 2008, 24, 9–14 CrossRef CAS PubMed.
- A. Grigoryev, I. Tokarev, K. G. Kornev, I. Luzinov and S. Minko, J. Am. Chem. Soc., 2012, 134, 12916–12919 CrossRef CAS PubMed.
- C. Boo, J. Lee and M. Elimelech, Environ. Sci. Technol., 2016, 50, 8112–8119 CrossRef CAS PubMed.
- E. J. Lee, B. J. Deka, J. Guo, Y. C. Woo, H. K. Shon and A. K. An, Environ. Sci. Technol., 2017, 51, 10117–10126 CrossRef CAS PubMed.
- Y. Xiang, S. Huang, P. Lv, Y. Xue, Q. Su and H. Duan, Phys. Rev. Lett., 2017, 119, 1–5 CrossRef PubMed.
- B. V. Hokmabad and S. Ghaemi, Sci. Rep., 2017, 7, 1–10 CrossRef PubMed.
- S. S. Latthe, C. Terashima, K. Nakata and A. Fujishima, Molecules, 2014, 19, 4256–4283 CrossRef PubMed.
- X. Sheng and J. Zhang, Colloids Surf., A, 2011, 377, 374–378 CrossRef CAS.
- Y. Pomeau, M. Le Berre, F. Celestini and T. Frisch, Comptes Rendus – Mec., 2012, 340, 867–881 CrossRef.
- M. Shirota, M. A. J. Van Limbeek, C. Sun, A. Prosperetti and D. Lohse, Phys. Rev. Lett., 2016, 116, 064501 CrossRef PubMed.
- M. S. Bobji, S. V. Kumar, A. Asthana and R. N. Govardhan, Langmuir, 2009, 25, 12120–12126 CrossRef CAS PubMed.
- M. Xu, G. Sun and C. J. Kim, Phys. Rev. Lett., 2014, 113, 1–5 Search PubMed.
- R. Freeman, A. C. Houck and C. J. Kim, 2015 Transducers – 2015 18th International Conference on Solid-State Sensors, Actuators and Microsystems, TRANSDUCERS 2015, Institute of Electrical and Electronics Engineers Inc., 2015, pp. 1818–1821.
- C. Lee, Langmuir, 2009, 25, 12812–12818 CrossRef CAS PubMed.
- Y. Su, B. Ji, K. Zhang, H. Gao, Y. Huang and K. Hwang, Langmuir, 2010, 26, 4984–4989 CrossRef CAS PubMed.
- T. Verho, J. T. Korhonen, L. Sainiemi, V. Jokinen, C. Bower, K. Franze, S. Franssila and R. H. A. Ras, Proc. Natl. Acad. Sci. U. S. A., 2012, 109, 10210–10213 CrossRef CAS PubMed.
- C. Lee and C. J. Kim, J. Microelectromech. Syst., 2012, 21, 712–720 CAS.
- A. Aránzazu Martínez-Gómezgómez, S. Lópezlópez, T. García, R. De-Francisco, P. Tiemblo and N. García, ACS Omega, 2017, 2, 8928–8939 CrossRef PubMed.
- E. M. Domingues, S. Arunachalam, J. Nauruzbayeva and H. Mishra, Nat. Commun., 2018, 9, 1–11 CrossRef CAS PubMed.
- K. Chen, Y. Wu, S. Zhou and L. Wu, Macromol. Rapid Commun., 2016, 37, 463–485 CrossRef CAS PubMed.
- K. Liu, X. Yao and L. Jiang, Chem. Soc. Rev., 2010, 39, 3240–3255 RSC.
- L. Piao and H. Park, Langmuir, 2015, 31, 8022–8032 CrossRef CAS PubMed.
- J. R. Panter and H. Kusumaatmaja, J. Phys.: Condens. Matter, 2017, 29, 084001 CrossRef CAS PubMed.
- M. Lee, C. Yim and S. Jeon, Appl. Phys. Lett., 2015, 106, 011605 CrossRef.
- M. Lynes, International energy outlook 2016, Transportation Sector, 2016.
- M. Xu, A. Grabowski, N. Yu, G. Kerezyte, J. W. Lee, B. R. Pfeifer and C. J. Kim, Phys. Rev. Appl., 2020, 13, 1 Search PubMed.
- S. A. Mäkiharju, M. Perlin and S. L. Ceccio, Int. J. Nav. Archit. Ocean Eng., 2012, 4, 412–422 CrossRef.
- R. S. Voronov, D. V. Papavassiliou and L. L. Lee, Chem. Phys. Lett., 2007, 441, 273–276 CrossRef CAS.
- C. Lee, C. H. Choi and C. J. Kim, Exp. Fluids, 2016, 57, 1–20 CrossRef CAS.
- K. Watanabe, Am. J. Sci. Technol., 2015, 2, 106–110 Search PubMed.
- C. H. Choi and C. J. Kim, Phys. Rev. Lett., 2006, 96, 1–4 Search PubMed.
- C. H. Choi, U. Ulmanella, J. Kim, C. M. Ho and C. J. Kim, Phys. Fluids, 2006, 18, 087105 CrossRef.
- M. Liravi, H. Pakzad, A. Moosavi and A. Nouri-Borujerdi, Prog. Org. Coat., 2020, 140, 105537 CrossRef CAS.
- W. Rong, H. Zhang, Z. Mao, X. Liu and K. Song, Mater. Res. Express, 2020, 7, 015092 CrossRef CAS.
- H. Xu, C. R. Crick and R. J. Poole, J. Mater. Chem. A, 2018, 6, 4458–4465 RSC.
- A. Rajappan, K. Golovin, B. Tobelmann, V. Pillutla, W. C. Abhijeet, A. Tuteja and G. H. Mckinley, Phys. Fluids, 2019, 31, 042107 CrossRef.
- H. Zhang, Y. Tuo, Q. Wang, B. Jin, L. Yin and X. Liu, Surf. Eng., 2018, 34, 596–602 CrossRef CAS.
- M. A. Samaha, H. Vahedi Tafreshi and M. Gad-el-Hak, Phys. Fluids, 2011, 23, 012001 CrossRef.
- H. Aziz and H. V. Tafreshi, Int. J. Multiphase Flow, 2018, 98, 128–138 CrossRef CAS.
- E. Taghvaei, A. Moosavi, A. Nouri-Borujerdi, M. A. Daeian and S. Vafaeinejad, Energy, 2017, 125, 1–10 CrossRef CAS.
- M. Xu, N. Yu, J. Kim and C. J. C. Kim, J. Fluid Mech., 2020, 908, 6 CrossRef.
- H. Dang and C. R. Lovellc, Am. Soc. Microbiol., 2015, 80, 91–138 Search PubMed.
- A. J. Martín-Rodríguez, J. M. F. Babarro, F. Lahoz, M. Sansón, V. S. Martín, M. Norte and J. J. Fernández, PLoS One, 2015, 10, 0123652 CrossRef PubMed.
- A. Jain and N. B. Bhosle, Biofouling, 2009, 25, 13–19 CrossRef CAS PubMed.
- E. Ostuni, B. A. Grzybowski, M. Mrksich, C. S. Roberts and G. M. Whitesides, Langmuir, 2003, 19, 1861–1872 CrossRef CAS.
- C. Compère, M. Bellon-Fontaine, P. Bertrand, D. Costa, P. Marcus, C. Poleunis, C. Pradier, B. Rondot and M. G. Walls, Biofouling, 2001, 17, 129–145 CrossRef.
- M. Ferrari and A. Benedetti, Adv. Colloid Interface Sci., 2015, 222, 291–304 CrossRef CAS PubMed.
- Z. Li and Z. Guo, Nanoscale, 2019, 11, 22636–22663 RSC.
- M. Smith, M. Bardiau, R. Brennan, H. Burgess, J. Caplin, S. Ray and T. Urios, npj Mater. Degrad., 2019, 3, 37 CrossRef.
- R. E. Melchers and R. J. Jeffrey, Corros. Eng., Sci. Technol., 2013, 48, 496–505 CrossRef CAS.
- C. Hellio and D. M. Yebra, in Woodhead Publishing Series in Metals and Surface Engineering, ed. C. Hellio and D. M. Yebra, Advances in Marine Antifouling Coatings and Technologies, Woodhead Publishing, 2009, pp. 1–15 Search PubMed.
- M. Cloutier, D. Mantovani and F. Rosei, Trends Biotechnol., 2015, 33, 637–652 CrossRef CAS PubMed.
- C. F. Flach, C. Pal, C. J. Svensson, E. Kristiansson, M. Östman, J. Bengtsson-Palme, M. Tysklind and D. G. J. Larsson, Sci. Total Environ., 2017, 590–591, 461–468 CrossRef CAS PubMed.
- M. Mateescu, S. Knopf, F. Mermet, P. Lavalle and L. Vonna, Langmuir, 2020, 36, 1103–1112 CrossRef CAS PubMed.
- K. Ellinas, D. Kefallinou, K. Stamatakis, E. Gogolides and A. Tserepi, ACS Appl. Mater. Interfaces, 2017, 9, 39781–39789 CrossRef CAS PubMed.
- M. Ferrari, A. Benedetti, E. Santini, F. Ravera, L. Liggieri, E. Guzman and F. Cirisano, Colloids Surf., A, 2015, 480, 369–375 CrossRef CAS.
- E. Ozkan, C. C. Crick, A. Taylor, E. Allan and I. P. Parkin, Chem. Sci., 2016, 7, 5126–5131 RSC.
- A. J. Huh and Y. J. Kwon, J. Controlled Release, 2011, 156, 128–145 CrossRef CAS PubMed.
- K. A. Poelstra, N. A. Barekzi, A. M. Rediske, A. G. Felts, J. B. Slunt and D. W. Grainger, J. Biomed. Mater. Res., 2002, 60, 206–215 CrossRef CAS PubMed.
- T. Harder and L. H. Yee, in Woodhead Publishing Series in Metals and Surface Engineering, ed. C. Hellio and D. M. Yebra, Advances in Marine Antifouling Coatings and Technologies, Woodhead Publishing, 2009, pp. 113–131 Search PubMed.
- Y. Yuan, M. P. Hays, P. R. Hardwidge and J. Kim, RSC Adv., 2017, 7, 14254–14261 RSC.
- J. D. Benck, T. R. Hellstern, J. Kibsgaard, P. Chakthranont and T. F. Jaramillo, ACS Catal., 2014, 4, 3957–3971 CrossRef CAS.
- M. Qiao and M.-M. Titirici, Carbon Hybrids Electrocatalysts for Oxygen Reduction Reaction in Fuel Cells, 2018 Search PubMed.
- C. Yu, P. Zhang, J. Wang and L. Jiang, Adv. Mater., 2017, 29, 1703053 CrossRef PubMed.
- C. Huang and Z. Guo, Nanoscale, 2018, 10, 19659–19672 RSC.
- W. Xu, Z. Lu, X. Sun, L. Jiang and X. Duan, Acc. Chem. Res., 2018, 51, 1590–1598 CrossRef CAS PubMed.
- Y. Gao, N. Yang, S. Lu, T. You and P. Yin, J. Mater. Chem. C, 2019, 7, 9926–9932 RSC.
- X. Xue, C. Yu, J. Wang and L. Jiang, ACS Nano, 2016, 10, 10887–10893 CrossRef CAS PubMed.
- S. Zhu, J. Li, S. Cai, Y. Bian, C. Chen, B. Xu, Y. Su, Y. Hu, D. Wu and J. Chu, ACS Appl. Mater. Interfaces, 2020, 12, 18110–18115 CrossRef CAS PubMed.
- C. Zhang, B. Zhang, H. Ma, Z. Li, X. Xiao, Y. Zhang, X. Cui, C. Yu, M. Cao and L. Jiang, ACS Nano, 2018, 12, 2048–2055 CrossRef CAS PubMed.
- X. Chen, Y. Wu, B. Su, J. Wang, Y. Song and L. Jiang, Adv. Mater., 2012, 24, 5884–5889 CrossRef CAS PubMed.
- X. Zhang, Y. Dong, Z. He, H. Gong, X. Xu, M. Zhao and H. Qin, ACS Appl. Mater. Interfaces, 2020, 12, 18174–18181 CrossRef CAS PubMed.
- C. Yu, X. Zhu, K. Li, M. Cao and L. Jiang, Adv. Funct. Mater., 2017, 27, 1701605 CrossRef.
- R. Chen, W. Tian, Y. Jia, W. Xu, F. Chen, X. Duan, Q. Xie, C. Hu, W. Liu, Y. Zhao, Y. Kuang, Y. Zhang and X. Sun, ACS Appl. Energy Mater., 2019, 2, 3991–3998 CrossRef CAS.
- X. Sheng, Z. Liu, R. Zeng, L. Chen, X. Feng and L. Jiang, J. Am. Chem. Soc., 2017, 139, 12402–12405 CrossRef CAS PubMed.
- Z. Cai, Y. Zhang, Y. Zhao, Y. Wu, W. Xu, X. Wen, Y. Zhong, Y. Zhang, W. Liu, H. Wang, Y. Kuang and X. Sun, Nano Res., 2019, 12, 345–349 CrossRef CAS.
- Z. Li, C. Cao, Z. Zhu, J. Liu, W. Song and L. Jiang, Adv. Mater. Interfaces, 2018, 5, 1801259 CrossRef.
- H. Ma, M. Cao, C. Zhang, Z. Bei, K. Li, C. Yu and L. Jiang, Adv. Funct. Mater., 2018, 28, 1705091 CrossRef.
- R. Ma, J. Wang, Z. Yang, M. Liu, J. Zhang and L. Jiang, Adv. Mater., 2015, 27, 2384–2389 CrossRef CAS PubMed.
- J. A. Duan, X. Dong, K. Yin, S. Yang and D. Chu, Appl. Phys. Lett., 2018, 113, 203704 CrossRef.
- C. Yu, X. Zhu, M. Cao, C. Yu, K. Li and L. Jiang, J. Mater. Chem. A, 2016, 4, 16865–16870 RSC.
- M. Cao, Z. Li, H. Ma, H. Geng, C. Yu and L. Jiang, ACS Appl. Mater. Interfaces, 2018, 10, 20995–21000 CrossRef CAS PubMed.
- W. T. Wood, J. F. Gettrust, N. R. Chapman, G. D. Spence and R. D. Hyndman, Nature, 2002, 420, 656–660 CrossRef CAS PubMed.
- E. D. Sloan, Nature, 2003, 426, 353–359 CrossRef CAS PubMed.
- D. A. Lashof and D. R. Ahuja, Nature, 1990, 344, 529–531 CrossRef CAS.
- J. Yong, S. C. Singh, Z. Zhan, F. Chen and C. Guo, ACS Appl. Mater. Interfaces, 2019, 11, 8667–8675 CrossRef CAS PubMed.
- J. Yong, F. Chen, J. Huo, Y. Fang, Q. Yang, J. Zhang and X. Hou, Nanoscale, 2018, 10, 3688–3696 RSC.
- J. Yong, F. Chen, W. Li, J. Huo, Y. Fang, Q. Yang, H. Bian and X. Hou, Glob. Challenges, 2018, 2, 1700133 CrossRef PubMed.
- J. Chen, Y. Liu, D. Guo, M. Cao and L. Jiang, Chem. Commun., 2015, 51, 11872–11875 RSC.
- A. A. Hemeda and H. V. Tafreshi, Langmuir, 2014, 30, 10317–10327 CrossRef CAS PubMed.
- D. I. Yu, S. Doh, H. J. Kwak, J. Hong, N. P. Sapkal and M. H. Kim, Langmuir, 2019, 35, 6460–6467 CrossRef CAS PubMed.
Footnote |
| † Electronic supplementary information (ESI) available. See DOI: 10.1039/d0cs01056a |
| This journal is © The Royal Society of Chemistry 2021 |


