Methanol synthesis over Cu/CeO2–ZrO2 catalysts: the key role of multiple active components†
Maxim
Zabilskiy
 *a,
Kaibo
Ma
a,
Arik
Beck
 ab and
Jeroen A.
van Bokhoven
 *ab
*ab
aLaboratory for Catalysis and Sustainable Chemistry, Paul Scherrer Institute, 5232 Villigen, Switzerland. E-mail: maxim.zabilskiy@psi.ch
bInstitute for Chemistry and Bioengineering, ETH Zurich, Vladimir-Prelog-Weg 1, 8093 Zürich, Switzerland. E-mail: jeroen.vanbokhoven@chem.ethz.ch
First published on 2nd November 2020
Abstract
High surface area ceria–zirconia synthesized by a glycothermal approach was used as a support for copper nanoparticles. Cu–CeO2/ZrO2 catalysts containing 5–25 wt% copper demonstrate high carbon dioxide-to-methanol conversion rates (120–180 gMeOH kgcat−1 h−1) at 260 °C and 50 bar. The sample containing 5 wt% copper in the form of small nanoparticles (≤5 nm) demonstrates the highest activity normalized per mass of copper, while higher copper loading results in copper segregation and correspondingly lower activity. We attribute the high activity to a unique synergetic effect between the active components, copper, ceria and zirconia, where activation of hydrogen and carbon dioxide and subsequent methanol synthesis take place. The redox properties of the ceria–zirconia support and its ability to form oxygen vacancy sites play a crucial role in carbon dioxide activation.
Introduction
An increasing amount of evidence during the previous decades indicates that excessive carbon dioxide emission causes detrimental effects on the global ecology system, which requires urgent action.1–3 Significant efforts have been focused on the mitigation of the atmospheric carbon dioxide concentration by the advancement of highly efficient carbon capture and separation technologies and the subsequent processes of carbon dioxide conversion into valuable fuel and chemicals or precursors thereof.4–7 Among these technologies, methanol synthesis via catalytic carbon dioxide hydrogenation has been studied intensively during the past several decades.8–13 Recent developments in hydrogen production from renewable energy sources and the necessity to store the produced hydrogen in the form of dense chemicals further stimulate the industrialization of methanol synthesis from carbon dioxide and hydrogen. In this context, methanol serves as a liquid hydrogen carrier and is an important chemical precursor for various industrial processes.14 Methanol can be used as an energy carrier in direct methanol fuel cells, as a precursor for chemicals and as a gasoline fuel additive.15–17The current industrial process of methanol synthesis requires elevated pressure (50–100 bar) and temperature (200–300 °C) to convert syngas (a mixture of carbon dioxide, carbon monoxide and hydrogen) over a ternary Cu/ZnO/Al2O3 catalyst to methanol.18 However, the catalyst is susceptible to water poisoning produced during the reaction, complicating the industrialization of Cu/ZnO-based catalysts for the direct carbon dioxide conversion to methanol. Furthermore, sintering and losing the copper–zinc oxide interface lead to a dramatic decrease in the hydrogenation activity. Therefore, new catalysts need to be explored by properly tuning the activity and stability of such catalysts.
One of the strategies is to precisely engineer the metal–oxide interface, which is assumed to be the active site for the hydrogenation of carbon dioxide. Numerous reports indicate that the synergetic interaction between copper and the adjacent zinc oxide component in copper–zinc-based systems accounts for the enhanced activity in the methanol synthesis reaction even in the absence of a unified interpretation.12,19–21 Graciani et al.22 reported CeOx/Cu (111) and Cu/CeOx/TiO2 (110) catalysts, in which the Cu/CeOx interface showed significant improvement in the methanol synthesis rates compared to the industrial Cu–ZnO-based systems. Wang et al.23 revealed the important role played by the ZnO–ZrO2 interface and its ability to form oxygen vacancies, which according to several studies are claimed to be responsible for carbon dioxide activation.24–26 Furthermore, the ternary interaction between copper and ZnO/ZrO2 enhances the amount of surface formate and methoxy species, which were suggested to act as a crucial intermediate in the methanol synthesis reaction and boost the catalyst performance.27 Using a surface organometallic synthesis approach, Lam and Noh et al. proposed that isolated TiIV and ZrIV Lewis acid sites stabilize surface intermediates during methanol synthesis at the interface between copper nanoparticles and the support and facilitate carbon dioxide hydrogenation.28–30 These reports highlight the advantages of engineering the interface between different oxides in order to create a highly active catalytic site.
Besides zinc oxide, zirconia is an often used oxide catalyst component. Zirconia has weak hydrophobic properties,31–33 which help to overcome the catalyst inhibition by water produced during the reaction. Ceria has well-known redox properties and easily forms oxygen vacancies.34 The aforementioned characteristics can be beneficial during methanol synthesis from carbon dioxide. Despite the very promising results obtained over Cu/CeO2 model catalysts,22 where this material outperformed a Cu/ZnO system, the combination of copper and ceria for catalytic methanol synthesis from carbon dioxide is rarely investigated. A few studies attempted to transfer the results obtained during surface science studies to real catalysts. In most of these studies, however, the observed activity and methanol selectivity were significantly lower than those of benchmark Cu/ZnO.35–37
In this work, we combine both ceria and zirconia phases and study this mixed oxide as a support for highly dispersed copper nanoparticles for the catalytic carbon dioxide hydrogenation to methanol. Common methods for the preparation of ceria–zirconia nanoparticles, such as co-precipitation, citrate combustion and nitrate decomposition, usually yield a low BET specific surface area,38,39 resulting in low active phase dispersion and consequently reduced interface between metal nanoparticles and support. To overcome this limitation, we adapted the glycothermal synthesis approach, which was initially developed for the preparation of pure ceria nanoparticles with a high BET surface area (up to 200 m2 g−1).40 Cu–CeO2/ZrO2 catalysts prepared according to the abovementioned protocol show superior catalytic activity in methanol synthesis.
Experimental
Catalyst preparation
CeO2 and CeO2/ZrO2 supports were synthesized according to a previously reported method for the preparation of CeO2 mesoporous spheres.40 In a typical synthesis, 1.51 g of Ce(NO3)3·6H2O (99% purity, Sigma-Aldrich) and 0.79 g of ZrO(NO3)2·6H2O (99% purity, Sigma-Aldrich) were dissolved in 2.6 ml of deionized water. Then, 61.4 ml of HOCH2CH2OH (99.0% purity, Aldrich) and 2.4 ml of CH3CH2COOH (99% purity, Sigma-Aldrich) were added under constant stirring. The molar ratio of the prepared uniform solution was 0.6 Ce(NO3)3![[thin space (1/6-em)]](https://www.rsc.org/images/entities/char_2009.gif) :
:![[thin space (1/6-em)]](https://www.rsc.org/images/entities/char_2009.gif) 0.4 ZrO(NO3)2
0.4 ZrO(NO3)2![[thin space (1/6-em)]](https://www.rsc.org/images/entities/char_2009.gif) :
:![[thin space (1/6-em)]](https://www.rsc.org/images/entities/char_2009.gif) 5.5 CH3CH2COOH
5.5 CH3CH2COOH![[thin space (1/6-em)]](https://www.rsc.org/images/entities/char_2009.gif) :
:![[thin space (1/6-em)]](https://www.rsc.org/images/entities/char_2009.gif) 190 HOCH2CH2OH. The homogeneous solution was put into a Teflon-lined stainless steel autoclave after 30 min of stirring and aged in an oven. The temperature was first kept at 230 °C for 60 min, then decreased to 165 °C in 30 min and finally aged at 165 °C for 90 min. After the nucleation process was finished, the autoclave was cooled to room temperature and 30 ml of acetone were added to the resulting suspension in order to facilitate nanoparticle precipitation. The dispersion was centrifuged at 9000 rpm for 10 min and further dispersed in deionized water. This procedure was repeated two times. Finally, a gel containing ceria–zirconia nanoparticles was obtained. The gel was dried overnight at 110 °C and calcined at 400 °C in air. Pure ceria or zirconia supports were also prepared by using only Ce(NO3)3·6H2O or ZrO(NO3)2·6H2O in the first step.
190 HOCH2CH2OH. The homogeneous solution was put into a Teflon-lined stainless steel autoclave after 30 min of stirring and aged in an oven. The temperature was first kept at 230 °C for 60 min, then decreased to 165 °C in 30 min and finally aged at 165 °C for 90 min. After the nucleation process was finished, the autoclave was cooled to room temperature and 30 ml of acetone were added to the resulting suspension in order to facilitate nanoparticle precipitation. The dispersion was centrifuged at 9000 rpm for 10 min and further dispersed in deionized water. This procedure was repeated two times. Finally, a gel containing ceria–zirconia nanoparticles was obtained. The gel was dried overnight at 110 °C and calcined at 400 °C in air. Pure ceria or zirconia supports were also prepared by using only Ce(NO3)3·6H2O or ZrO(NO3)2·6H2O in the first step.
Cu–CeO2/ZrO2 catalysts containing different copper amounts were prepared using the deposition–precipitation method. 500 mg of CeO2/ZrO2 support were dispersed in 10 ml of deionized water. The appropriate amount of Cu(NO3)2·3H2O (99% purity, Sigma-Aldrich) was added to the abovementioned dispersion to reach the desired nominal copper loading (5–25 wt%). Then 5 ml of a solution containing 250 mg of sodium carbonate were injected dropwise to ensure uniform copper hydroxycarbonate precipitation on the ceria–zirconia support. The resulting suspension was centrifuged, dried overnight and finally calcined at 400 °C for 4 hours. The synthesized catalysts are labeled as X-Cu–CeO2/ZrO2 (where X represents the net copper loading in wt%).
Catalyst characterization
The analysis of specific surface area, total pore volume and pore size distribution was performed at −196 °C using a 3Flex Surface Characterization Analyzer (Micromeritics). Prior to the measurement, all samples were activated according to the following pretreatment protocol. First, the materials were evacuated at 110 °C for 1 h, followed by 3 h dwelling at 300 °C (heating ramp 2 °C min−1) using a Micromeritics SmartPrep degasser. The Brunauer–Emmett–Teller (BET) method was applied to calculate the specific surface area of the samples. The pore size distribution was derived from the desorption branch of the isotherms employing the Barrett–Joyner–Halenda (BJH) method. The total pore volume was estimated at a relative pressure of 0.99.X-ray diffraction measurements were performed at room temperature on a Bruker D8 Advance AXS diffractometer using Cu Kα1 radiation with λ = 0.15406 nm. Materials were scanned in the 2θ range between 20° and 65° with 0.0215° increments and 1 s acquisition time at each increment.
The redox properties of the synthesized materials were studied by temperature-programmed reduction (TPR) measurements using a gas mixture containing 10 vol% hydrogen in argon. The experiments were performed at ambient pressure using a Micromeritics AutoChem HP 2950 device. Typically, ∼100 mg of the Cu–CeO2/ZrO2 sample were in situ pretreated at 300 °C in 10 vol% oxygen in helium before doing the H2-TPR test. During the TPR analysis, the samples were heated from 20 to 300 °C with a heating ramp of 5 °C min−1. The amount of consumed hydrogen was monitored using a TCD detector. A liquid nitrogen–isopropyl alcohol cold trap was used in order to condense the water produced during the reduction processes. Following the H2-TPR study, the samples were cooled in helium (6.0, 50 ml min−1) to −120 °C by using a CryoCooler (Micromeritics) and an oxygen pulse-chemisorption experiment was performed at −120 °C in order to determine copper dispersion and particle size. During this experiment, oxygen oxidized the partially reduced ceria–zirconia support as well. Thus, in our calculation we took into account this effect. As shown in Table S1,† the amount of consumed hydrogen during H2-TPR experiments significantly exceeds the theoretical hydrogen uptake required for complete reduction of copper oxide present in the Cu–CeO2/ZrO2 samples. As such, the amount of hydrogen consumed for support co-reduction was calculated by subtracting the theoretical hydrogen uptake from the amount of hydrogen consumed during H2-TPR experiments. The amount of oxygen required for the complete re-oxidation of the ceria–zirconia support was calculated taking into account the stoichiometry factor − 2 (ν(O2) = ν(H2)/2). This volume of oxygen was later subtracted from the total amount of oxygen consumed during the pulse-chemisorption experiment.
X-ray absorption fine structure (XAFS) measurements were performed at the SuperXAS beamline, Swiss Light Source of the Paul Scherrer Institute (Villigen, Switzerland). As-synthesized samples were mixed with micronized boron nitride powder (Sigma-Aldrich) and pressed in the form of homogeneous pellets with a total absorption thickness of around 2 above the Cu K-edge. XAFS data were collected in a conventional transmission geometry using a fast, gridded ion chamber and a quick scanning channel-cut Si(111) monochromator (oscillation frequency of 1 Hz).41 A copper foil standard was collected simultaneously for exact energy calibration. In order to reduce radiation damage of the samples, the beam was defocused to the size of 2500 microns × 500 microns. Initial analysis and energy calibration were performed using ProXAS v.2.34 software.42 To determine the local environment of copper in the investigated samples (type and average number of neighbors, bond distance and Debye–Waller factor), quantitative EXAFS data analysis was performed using the IFEFFIT program package Demeter.43 To fit the experimental EXAFS spectra, we assumed a model of the local environment of copper similar to that of the copper oxide tenorite reference. The best fit for the 5-Cu–CeO2/ZrO2 sample was obtained assuming only two scattering paths: oxygen in the first and copper in the second coordination sphere. Fitting of the FT samples containing 10–25 wt% copper requires including additional oxygen and copper scattering paths.
Scanning transmission electron microscopy was performed using an aberration-corrected JEOL JEM-ARM300F transmission electron microscope (at 300 kV) at the Scientific Center for Optical and Electron Microscopy (ScopeM, ETH Zurich).
Results and discussion
Characterization of CeO2/ZrO2
Fig. 1a shows the diffraction patterns of ceria and ceria–zirconia, both typical of the FCC fluorite structure. Diffraction peaks at 29°, 33.6° and 48.4° in the pattern of ceria–zirconia correspond to the formation of solid solution and were shifted to higher angles compared to those of the ceria phase. The calculated lattice cell parameter for the ceria–zirconia sample equals 5.302(8) Å, which according to Vegard's law44 corresponds to a solid solution where ∼41% cerium atoms in ceria are substituted by zirconium. This value is in good agreement with the theoretical ratio of cerium and zirconium nitrate precursors (60![[thin space (1/6-em)]](https://www.rsc.org/images/entities/char_2009.gif) :
:![[thin space (1/6-em)]](https://www.rsc.org/images/entities/char_2009.gif) 40) in the stock solution before glycothermal aging, indicating that all zirconia was successfully incorporated into the structure. The average crystallite size of the synthesized ceria–zirconia calculated from the (111) reflection (2θ = 29°) using the Scherrer equation was 5 nm.
40) in the stock solution before glycothermal aging, indicating that all zirconia was successfully incorporated into the structure. The average crystallite size of the synthesized ceria–zirconia calculated from the (111) reflection (2θ = 29°) using the Scherrer equation was 5 nm.
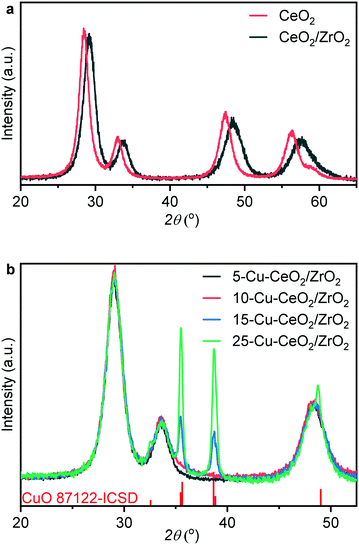 | ||
| Fig. 1 XRD patterns of ceria and ceria–zirconia prepared using a glycothermal approach (a) and XRD patterns of prepared Cu–CeO2/ZrO2 catalysts and CuO ICSD reference (b). | ||
Synthesis of ceria–zirconia using the glycothermal approach yielded a BET specific surface area of 150 m2 g−1. Fig. S1† shows nitrogen adsorption–desorption isotherms and pore size distributions for the synthesized ceria–zirconia and pure ceria materials. Unlike pure ceria with two hysteresis loops with p/p0 equal to 0.65 and 0.9, the ceria–zirconia sample has only one at p/p0 of 0.65. Ceria nanoparticles usually aggregate into nanospheres (60–80 nm in diameter), yielding two hysteresis loops corresponding to (i) voids between single nanoparticles and (ii) voids between nanosphere agglomerates;40 therefore this material exhibits bimodal pore size distribution (inset in Fig. S1†). In turn, ceria–zirconia solids do not form nanospherical agglomerates (Fig. S2†), producing only one maximum in pore size distribution centered at ∼5 nm due to voids between nanoparticles.
Characterization of Cu–CeO2/ZrO2
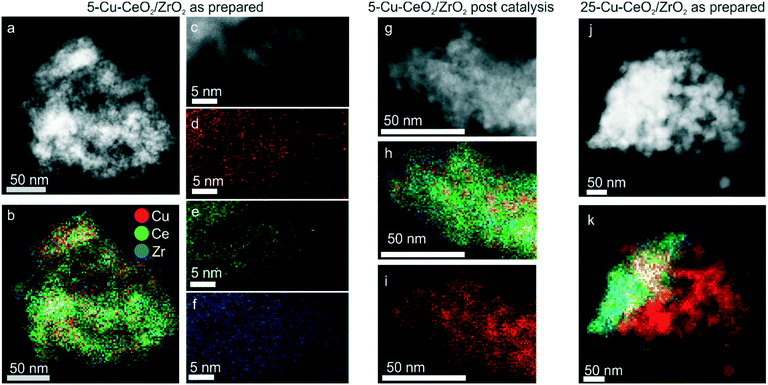
Fig. 1b shows XRD patterns of the as-prepared Cu–CeO2/ZrO2. The crystalline size calculated from the (111) reflection of ceria–zirconia using the Scherrer equation was equal to 5.0 nm for all samples. For 5-Cu–CeO2/ZrO2 and 10-Cu–CeO2/ZrO2 containing 5 and 10 wt% copper, we did not observe any reflection corresponding to a crystalline copper phase and the CeO2/ZrO2 support retained its structure after copper deposition and calcination. 15-Cu–CeO2/ZrO2 and 25-Cu–CeO2/ZrO2 showed reflections at 32.5°, 35.5°, 38.7° and 48.8° typical of copper oxide. The copper oxide particle sizes for these two samples were 21 and 25 nm (based on the Scherrer equation).Fig. 2 shows scanning transmission electron microscopy (STEM) images combined with energy-dispersive X-ray spectroscopy (EDX) mapping of the lowest (5 wt%) and highest (25 wt%) copper loaded samples. The STEM image (Fig. 2a) and corresponding EDX mapping (Fig. 2b) of as-prepared 5-Cu–CeO2/ZrO2 reveal a homogeneous elemental distribution of copper, cerium and zirconium. Subnanometer elemental mapping of the area containing the region enriched with copper (Fig. 2d–f) suggests the formation of highly dispersed copper species which anchored to the CeO2/ZrO2 crystallites. STEM–EDX mapping for spent 5-Cu–CeO2/ZrO2 was further acquired. Similar to the fresh solid, the catalyst after catalytic carbon dioxide hydrogenation exhibits a homogeneous distribution of cerium and zirconium (Fig. 2h). At the same time, the copper distribution besides highly dispersed areas shows also the regions of denser copper signal (Fig. 2i). This suggests the partial sintering of the initially highly dispersed copper phase to small nanoparticles of about 5 nm in size.
Elemental mapping of the catalyst with the highest copper loading (25-Cu–CeO2/ZrO2) shows a heterogeneous distribution of copper already for fresh material before catalysis. Segregated copper oxide nanoparticles with a size of up to 50 nm were observed in addition to mixed copper ceria–zirconia particles (Fig. 2k).
Cu K-edge X-ray absorption near edge spectroscopy (XANES) and extended X-ray absorption fine structure (EXAFS) spectra of as-synthesized materials were collected in transmission mode under ambient conditions at the SuperXAS beamline (SLS, Switzerland).41 The Cu K-edge XANES spectra of the catalyst are plotted along with that of the copper oxide standard (Fig. 3). The energy positions of all features in the spectra of Cu–CeO2/ZrO2 coincide with those in that of copper oxide, indicating the predominant presence of the oxidic Cu2+ state in these catalysts. The characteristic shoulder located at 8985 eV (corresponding to 1s–4p transition with shakedown contributions in tetragonal Cu2+) and the peak right after the absorption edge (at ca. 9014 eV) are less pronounced for the 5-Cu–CeO2/ZrO2 and 10-Cu–CeO2/ZrO2 samples. This indicates the presence of a disordered amorphous copper oxide phase,45 in agreement with diffraction data, which showed the absence of any crystalline copper oxide phase.
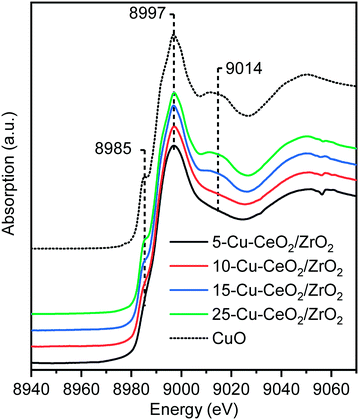 | ||
| Fig. 3 Cu K-edge XANES spectra of as-prepared 5-Cu–CeO2/ZrO2 (black), 10-Cu–CeO2/ZrO2 (red), 15-Cu–CeO2/ZrO2 (blue), 25-Cu–CeO2/ZrO2 (green) and copper(II) oxide reference (black dashed line). | ||
Fig. 4 and Table 1 show the Fourier transforms (FTs) of the k2-weighted Cu K-edge EXAFS and corresponding fitting parameters. All the materials possess two distinct peaks in the range of 1–3 Å. The peak around 1.5 Å is due to the Cu−O scattering, and the other peak around 2.6 Å to Cu−Cu scattering. These peaks resemble those of the tenorite reference, confirming the formation of copper oxide nanoparticles on the ceria–zirconia support. For the samples with copper loading of more than 10 wt%, characteristic wiggles at 7–10 Å−1 in the k2-weighted Cu K-edge EXAFS (Fig. 5) can be observed which result in distinct peaks of Cu–Cu scattering between 4 and 6 Å in the Fourier transforms (Fig. 4). This confirms the presence of well-ordered nanoparticles of copper oxide in the 15-Cu–CeO2/ZrO2 and 25-Cu–CeO2/ZrO2 samples.
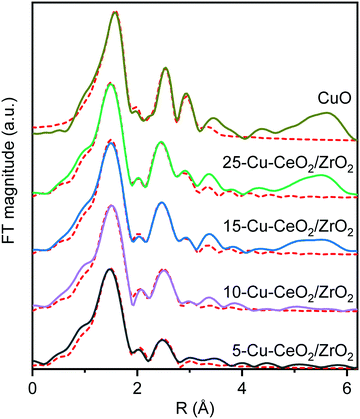 | ||
| Fig. 4 The Fourier transforms of k2-weighted Cu K-edge EXAFS of 5-Cu–CeO2/ZrO2 (black), 10-Cu–CeO2/ZrO2 (purple), 15-Cu–CeO2/ZrO2 (blue), 25-Cu–CeO2/ZrO2 (green) and CuO standard (gold). The red dotted lines show the best theoretical fits (see Table 1 for details). | ||
| Path | CNa | R [Å] | σ 2 [Å2] | ΔEo [eV]/R-factord |
|---|---|---|---|---|
| a Coordination number. b Bond distance. c Debye–Waller factor. d Potential shift (ΔEo) and fit agreement factor (R-factor). | ||||
| 5-Cu–CeO2/ZrO2 | ||||
| Cu–O | 3.4(2) | 1.93(1) | 0.004(1) | −2 ± 1/0.0080 |
| Cu–Cu | 0.7(2) | 2.90(1) | 0.005(1) | |
| 10-Cu–CeO2/ZrO2 | ||||
| Cu–O | 3.6(2) | 1.95(1) | 0.004(1) | −0.3 ± 0.6/0.0086 |
| Cu–O | 0.4(4) | 2.76(3) | 0.004(1) | |
| Cu–Cu | 1.1(2) | 2.90(1) | 0.005(1) | |
| 15-Cu–CeO2/ZrO2 | ||||
| Cu–O | 3.9(1) | 1.95(1) | 0.004(1) | −0.6 ± 0.4/0.0031 |
| Cu–O | 0.9(3) | 2.76(3) | 0.004(1) | |
| Cu–Cu | 2.2(4) | 2.90(1) | 0.005(1) | |
| Cu–Cu | 1.6(3) | 3.08(3) | 0.005(1) | |
| 25-Cu–CeO2/ZrO2 | ||||
| Cu–O | 3.9(1) | 1.95(1) | 0.004(1) | −0.8 ± 0.4/0.0011 |
| Cu–O | 1.0(3) | 2.76(3) | 0.004(1) | |
| Cu–Cu | 2.7(4) | 2.90(1) | 0.005(1) | |
| Cu–Cu | 2.4(3) | 3.08(3) | 0.005(1) | |
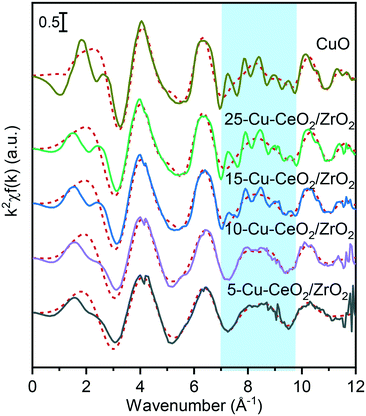 | ||
| Fig. 5 The k2-weighted Cu K-edge EXAFS of 5-Cu–CeO2/ZrO2 (black), 10-Cu–CeO2/ZrO2 (purple), 15-Cu–CeO2/ZrO2 (blue), 25-Cu–CeO2/ZrO2 (green) and copper oxide standard (gold). The red dotted lines show the best theoretical fits (see Table 1 for details). The blue shaded area indicates the characteristic wiggles at 7–10 Å−1 in the k2-weighted Cu K-edge EXAFS resulting in distinct peaks of the higher shell structure between 4 and 6 Å in the Fourier transforms of 15-Cu–CeO2/ZrO2, 25-Cu–CeO2/ZrO2 and copper oxide standard (Fig. 4). | ||
The first coordination shell in all cases consists of oxygen atoms at a distance of 1.93–1.95 Å, like that in a typical copper(II) oxide, tenorite. The coordination number of the first Cu–O shell for the 5-Cu–CeO2/ZrO2 and 10-Cu–CeO2/ZrO2 samples was 3.4 and 3.6, respectively, while for the other two samples this value was close to 4 as for a bulk copper oxide. The contribution from the Cu scatters at 2.9 Å gradually increases from 0.7 neighbors for 5-Cu–CeO2/ZrO2 sample to 2.7 for 25-Cu–CeO2/ZrO2 material. Fitting of the FT samples containing 10–25 wt% copper unlike 5-Cu–CeO2/ZrO2 requires including additional oxygen at a distance of 2.76 Å and copper at a distance of 3.08 Å. These observations indicate the presence of a more disordered or highly dispersed copper oxide phase for the samples with copper content below 10 wt%. Higher copper loading in 15-Cu–CeO2/ZrO2 and 25-Cu–CeO2/ZrO2 samples results in the formation of a more developed tenorite phase, as can be seen from a monotonous and significant increase of the overall coordination number for Cu–O and Cu–Cu scattering paths.
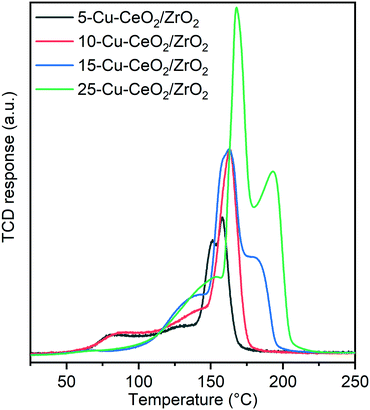
Fig. 6 and Table S1† show the results of temperature-programmed reduction (TPR) experiments conducted in 10 vol% hydrogen. A first reduction peak with maximum at ∼80 °C was observed only for 5-Cu–CeO2/ZrO2 and 10-Cu–CeO2/ZrO2 samples. At higher copper loadings, no low-temperature reduction peak was revealed. The low-temperature reduction of copper(II) is a well-known phenomenon for copper–ceria materials. Usually, this peak is attributed to the reduction of finely dispersed copper species strongly interacting with the ceria support.40,46 The next reduction peaks in the range between 100 and 175 °C are usually associated with the reduction of weak magnetic associates including several copper(II) ions, reduction of small copper oxide clusters and co-reduction of ceria support.47 For unambiguous assigning of these peaks to the abovementioned reduction processes, a thorough in situ XAS/TPR study is required, which is out of the scope of this manuscript. The last peak presented in TPR profiles of 15-Cu–CeO2/ZrO2 and 25-Cu–CeO2/ZrO2 samples with a maximum in the range between 175 and 200 °C is very close to the reduction of bulk copper oxide. Previous studies attribute it to the reduction of segregated bulk copper oxide phase.40,48,49
Table S1† shows that consumption of hydrogen for all the studied samples exceeds the theoretical values required for complete reduction of all present copper oxide to metallic copper that confirms co-reduction of the ceria–zirconia support. Electronic interactions between copper and ceria oxide phases promote the weakness of the metal–oxygen bonds due to a “synergetic effect” and facilitate reduction of not only copper oxide species but also the ceria support. The 5-Cu–CeO2/ZrO2 material stands out among other samples and the amount of hydrogen consumed for ceria co-reduction is almost 50% higher compared to all other samples (15.3 cm3 g−1vs. 10.8 cm3 g−1). We attribute this phenomenon to the presence of highly dispersed copper species in this sample (as confirmed by STEM and XAS analysis), which results in an extremely developed copper–ceria–zirconia interface and consequently a higher extent of support reduction.
The reduction profiles of the 15-Cu–CeO2/ZrO2 and 25-Cu–CeO2/ZrO2 samples look significantly different compared to the samples with lower copper content. Fig. 6 clearly shows the shift of the reduction maxima to higher temperature with increasing copper content in the samples. Instead of a low-temperature reduction peak presented in 5-Cu–CeO2/ZrO2 and 10-Cu–CeO2/ZrO2, in the H2-TPR profiles of 15-Cu–CeO2/ZrO2 and 25-Cu–CeO2/ZrO2 we observed the appearance of another peak in the high-temperature region attributed to the reduction of bulk copper oxide. This indicates a gradual increase of copper oxide particle size from finely dispersed copper species strongly interacting with the ceria–zirconia support (5-Cu–CeO2/ZrO2) to crystalline bulk phase presented in 25-Cu–CeO2/ZrO2.
Catalytic carbon dioxide hydrogenation
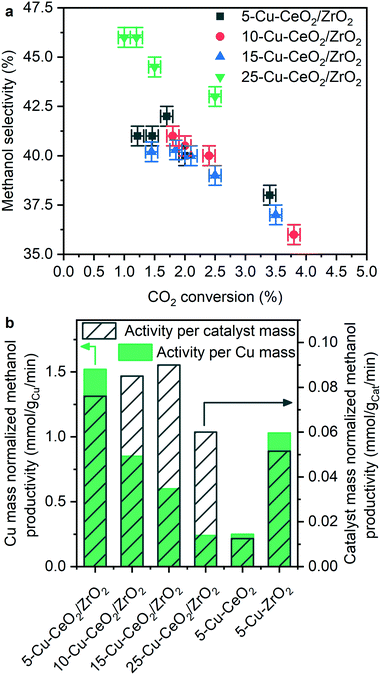
Fig. 7, S3 and S4† show the catalytic carbon dioxide hydrogenation activity and selectivity data obtained during methanol synthesis reaction over the investigated Cu–CeO2/ZrO2 materials at 260 °C and 50 bar. Methanol productivity rates normalized per mass of the catalyst are independent of copper loading (Fig. S3†). The absolute values of methanol synthesis rate (120–180 gMeOH kgcat−1 h−1) are among the highest compared to other catalyst formulations which do not contain zinc oxide in their composition.9 An industrial copper–zinc–alumina catalyst containing 63.5 wt% copper under the catalytic conditions of this study (260 °C and 50 bar) over-performs the Cu–CeO2/ZrO2 catalysts in terms of carbon dioxide conversion (Table 2); however, the activity normalized per mass of copper is only 25% higher compared to 5-Cu–CeO2/ZrO2 (2.02 vs. 1.52 mmol gCu−1 min−1). The ceria–zirconia support does not produce methanol, and catalysts prepared by deposition of copper on ceria and on zirconia are less active (Table 2).| Catalyst | Methanol selectivity, % | Carbon dioxide conversion, % | Normalized methanol productivity, mmol gCu−1 min−1 |
|---|---|---|---|
| a Commercial methanol synthesis catalyst purchased from Alfa Aesar. b Catalyst was investigated at WHSV = 120 L gcat−1 per hour due to negative effect of water poisoning at higher conversion level. | |||
| 5-Cu–CeO2/ZrO2 | 42 | 1.7 | 1.52 |
| 10-Cu–CeO2/ZrO2 | 41 | 2.0 | 0.85 |
| 15-Cu–CeO2/ZrO2 | 39 | 2.1 | 0.60 |
| 25-Cu–CeO2/ZrO2 | 46 | 1.2 | 0.24 |
| 5-Cu–CeO2 | 25 | 0.5 | 0.25 |
| 5-Cu–ZrO2 | 32 | 1.5 | 1.03 |
| Cu/ZnO/Al2O3a,b | 41 | 14.6 | 2.02 |
Fig. 7 shows methanol selectivity as a function of carbon dioxide conversion during catalytic methanol synthesis over Cu–CeO2/ZrO2 samples measured at 260 °C and 50 bar total pressure. Carbon monoxide was the only by-product. The catalysts with different copper loading exhibit similar selectivity-conversion trends, suggesting that carbon dioxide hydrogenation occurs at the same active sites in each catalyst.
In contrast, the activity normalized per copper loading shows a clear trend, indicating that the higher the copper content in the sample, the lower the activity normalized per copper loading (Fig. 7b). The 5-Cu–CeO2/ZrO2 catalyst possesses two to six times higher normalized activity compared to the other catalysts. According to numerous studies,30,50,51 the interface between copper and zirconia phases plays a crucial role in catalytic carbon dioxide hydrogenation to methanol. It was suggested that formate species localized at this interface and stabilized by zirconium surface sites are a key-observable reaction intermediate,50 while copper nanoparticles activate and split hydrogen required to hydrogenate formate species, completing the catalytic cycle.30 Larmier et al.50 further revealed that the most favorable adsorption mode of carbon dioxide is at the interface between copper and zirconia. Here, the two oxygen atoms of carbon dioxide interact with Zr4+ Lewis acidic centers and the carbon atom is bound to the surface of copper nanoparticles. Furthermore, they found that localization of formate species on zirconia in close vicinity to the metallic copper nanoparticles facilitates hydrogen transfer from copper and transformation of formate species to methanol. Our results are consistent with the abovementioned conclusions and the superior activity of 5-Cu–CeO2/ZrO2 sample illustrates the importance of multiple components, well-dispersed copper species and developed interface between copper and the supporting oxides. A long-term stability test conducted over this material (Fig. S5†) reveals good catalytic stability and absence of catalyst deactivation during the time frame of the experiment.
5-Cu–CeO2/ZrO2 possesses the smallest and well-dispersed copper species. Higher copper loading results in copper phase segregation which does not contribute to catalytic activity (Fig. S4†). 25-Cu–CeO2/ZrO2 containing a five times higher copper loading is less active in catalytic methanol synthesis. Increase of copper particle size, as confirmed by XRD, XAS and TEM investigations, results in lower number of surface copper atoms and shortening of perimeter interfaces between copper and ceria–zirconia (schematically shown in Fig. 8). This leads to a drastic decrease of methanol productivity rate since the majority of deposited copper became inactive and does not participate in the catalytic cycle.
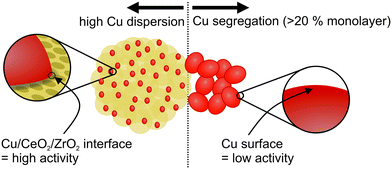 | ||
| Fig. 8 Importance of well-dispersed copper species and well-developed ceria–zirconia surface during catalytic carbon dioxide hydrogenation to methanol. | ||
Finally, using ceria–zirconia material as a copper support results in higher methanol productivity compared to using pure ceria and zirconia oxides. We attribute this boost in catalytic activity to the well-known redox properties of this support and the ability to easily form oxygen vacancy sites under reductive atmospheres, as was confirmed by H2-TPR experiments. Numerous theoretical and experimental reports emphasize the exceptional role of oxygen vacancies in methanol synthesis over the various catalytic systems and ascribe such defects as sites needed for carbon dioxide activation.10,24,52,53 These point-defects in the immediate vicinity to copper clusters play a crucial role in the first step of carbon dioxide adsorption and its activation prior to hydrogen addition and transformation to formate species.
Conclusions
By using a glycothermal synthesis approach, we have prepared ceria–zirconia nanoparticles having a high BET specific surface area – 150 m2 g−1. Due to this, we were able to stabilize copper nanoparticles supported on ceria–zirconia and prevent them from further sintering during catalytic methanol synthesis. We have shown that synthesized materials can effectively convert carbon dioxide to methanol at 260 °C and 50 bar. Methanol productivity values (120–180 gMeOH kgcat−1 h−1) are among the highest compared to those of other catalyst formulations which do not contain zinc oxide in their composition. The 5-Cu–CeO2/ZrO2 sample possesses the highest normalized methanol productivity rate in comparison to other Cu–CeO2/ZrO2 materials with higher copper content. Various physical–chemical characterization techniques point out that with increasing copper loading the growth and segregation of copper nanoparticles take places, which results in the reduction of the interface between metallic copper and the CeO2/ZrO2 support. We attribute the high catalytic activity of Cu–CeO2/ZrO2 materials to the enhanced redox properties of the ceria–zirconia support and its ability to form oxygen vacancies under reductive atmospheres. We believe that these sites located in proximity to the metal–oxide interface participate in carbon dioxide activation and hydrogenation to formate species and further to methanol. Normalized methanol productivity for 5-Cu–CeO2/ZrO2 sample (1.52 mmol gCu−1 min−1) is comparable to that of an industrial copper–zinc–alumina catalyst (2.02 mmol gCu−1 min−1), and therefore by precise engineering and optimization of this catalytic system we expect further catalyst improvement.Conflicts of interest
There are no conflicts to declare.Acknowledgements
We acknowledge the Swiss Light Source (SuperXAS beamline) for providing beamtime for XAS measurements. Dr. O. Safonova is acknowledged for providing support during beamtime. Electron microscopy work was performed at the Scientific Centre for Optical and Electron Microscopy (ScopeM) ETH Zurich. A. B. and J. A. v. B. acknowledge the SNSF project 200021_178943 for the funding.Notes and references
- J. P. Gattuso, A. Magnan, R. Billé, W. W. L. Cheung, E. L. Howes, F. Joos, D. Allemand, L. Bopp, S. R. Cooley, C. M. Eakin, O. Hoegh-Guldberg, R. P. Kelly, H. O. Pörtner, A. D. Rogers, J. M. Baxter, D. Laffoley, D. Osborn, A. Rankovic, J. Rochette, U. R. Sumaila, S. Treyer and C. Turley, Science, 2015, 349, aac4722 CrossRef.
- A. A. Lacis, G. A. Schmidt, D. Rind and R. A. Ruedy, Science, 2010, 330, 356–359 CrossRef CAS.
- S. J. Davis, K. Caldeira and H. D. Matthews, Science, 2010, 329, 1330–1333 CrossRef CAS.
- X. Shi, H. Xiao, H. Azarabadi, J. Song, X. Wu, X. Chen and K. S. Lackner, Angew. Chem., Int. Ed., 2020, 59, 6984–7006 CrossRef CAS.
- R. P. Ye, J. Ding, W. Gong, M. D. Argyle, Q. Zhong, Y. Wang, C. K. Russell, Z. Xu, A. G. Russell, Q. Li, M. Fan and Y. G. Yao, Nat. Commun., 2019, 10, 1–15 CrossRef.
- C. Zahasky and S. Krevor, Energy Environ. Sci., 2020, 13, 1561–1567 RSC.
- N. McQueen, P. Kelemen, G. Dipple, P. Renforth and J. Wilcox, Nat. Commun., 2020, 11, 1–10 Search PubMed.
- A. González-Garay, M. S. Frei, A. Al-Qahtani, C. Mondelli, G. Guillén-Gosálbez and J. Pérez-Ramírez, Energy Environ. Sci., 2019, 12, 3425–3436 RSC.
- M. D. Porosoff, B. Yan and J. G. Chen, Energy Environ. Sci., 2016, 9, 62–73 RSC.
- J. C. Frost, Nature, 1988, 334, 577–580 CrossRef CAS.
- S. Kattel, P. J. Ramírez, J. G. Chen, J. A. Rodriguez and P. Liu, Science, 2017, 355, 1296–1299 CrossRef CAS.
- S. Kuld, M. Thorhauge, H. Falsig, C. F. Elkjær, S. Helveg, I. Chorkendorff and J. Sehested, Science, 2016, 352, 969–974 CrossRef CAS.
- M. Behrens, F. Studt, I. Kasatkin, S. Kuhl, M. Havecker, F. Abild-Pedersen, S. Zander, F. Girgsdies, P. Kurr, B.-L. Kniep, M. Tovar, R. W. Fischer, J. K. Norskov and R. Schlogl, Science, 2012, 336, 893–897 CrossRef CAS.
- G. A. Olah, Angew. Chem., Int. Ed., 2005, 44, 2636–2639 CrossRef CAS.
- I. Yarulina, A. D. Chowdhury, F. Meirer, B. M. Weckhuysen and J. Gascon, Nat. Catal., 2018, 1, 398–411 CrossRef CAS.
- S. Verhelst, J. W. Turner, L. Sileghem and J. Vancoillie, Prog. Energy Combust. Sci., 2019, 70, 43–88 CrossRef.
- O. I. Awad, R. Mamat, O. M. Ali, N. A. C. Sidik, T. Yusaf, K. Kadirgama and M. Kettner, Renewable Sustainable Energy Rev., 2018, 82, 2586–2605 CrossRef CAS.
- J. Sehested, J. Catal., 2019, 371, 368–375 CrossRef CAS.
- S. Kattel, P. J. Ramírez, J. G. Chen, J. A. Rodriguez and P. Liu, Science, 2017, 355, 1296–1299 CrossRef CAS.
- M. Behrens, F. Studt, I. Kasatkin, S. Kühl, M. Hävecker, F. Abild-Pedersen, S. Zander, F. Girgsdies, P. Kurr, B.-L. Kniep, M. Tovar, R. W. Fischer, J. K. Nørskov and R. Schlögl, Science, 2012, 336, 893–897 CrossRef CAS.
- M. Zabilskiy, V. L. Sushkevich, D. Palagin, M. A. Newton, F. Krumeich and J. A. van Bokhoven, Nat. Commun., 2020, 11, 2409 CrossRef CAS.
- J. Graciani, K. Mudiyanselage, F. Xu, A. E. Baber, J. Evans, S. D. Senanayake, D. J. Stacchiola, P. Liu, J. Hrbek, J. Fernández Sanz and J. A. Rodriguez, Science, 2014, 345, 546–550 CrossRef CAS.
- Y. Wang, S. Kattel, W. Gao, K. Li, P. Liu, J. G. Chen and H. Wang, Nat. Commun., 2019, 10, 1166 CrossRef.
- M. S. Frei, C. Mondelli, A. Cesarini, F. Krumeich, R. Hauert, J. A. Stewart, D. Curulla Ferré and J. Pérez-Ramírez, ACS Catal., 2020, 10, 1133–1145 CrossRef CAS.
- J. Strunk, K. Kähler, X. Xia, M. Comotti, F. Schüth, T. Reinecke and M. Muhler, Appl. Catal., A, 2009, 359, 121–128 CrossRef CAS.
- J. B. Wang, H. K. Lee and T. J. Huang, Catal. Lett., 2002, 83, 79–86 CrossRef CAS.
- Y. Wang, S. Kattel, W. Gao, K. Li, P. Liu, J. G. Chen and H. Wang, Nat. Commun., 2019, 10, 1166 CrossRef.
- E. Lam, J. J. Corral-Pérez, K. Larmier, G. Noh, P. Wolf, A. Comas-Vives, A. Urakawa and C. Copéret, Angew. Chem., Int. Ed., 2019, 58, 13989–13996 CrossRef CAS.
- G. Noh, E. Lam, J. L. Alfke, K. Larmier, K. Searles, P. Wolf and C. Copéret, ChemSusChem, 2019, 12, 968–972 CrossRef CAS.
- E. Lam, K. Larmier, S. Tada, P. Wolf, O. V. Safonova and C. Copéret, Chin. J. Catal., 2019, 40, 1741–1748 CrossRef.
- F. Arena, K. Barbera, G. Italiano, G. Bonura, L. Spadaro and F. Frusteri, J. Catal., 2007, 249, 185–194 CrossRef CAS.
- X. Guo, D. Mao, G. Lu, S. Wang and G. Wu, J. Catal., 2010, 271, 178–185 CrossRef CAS.
- F. Arena, G. Italiano, K. Barbera, S. Bordiga, G. Bonura, L. Spadaro and F. Frusteri, Appl. Catal., A, 2008, 350, 16–23 CrossRef CAS.
- S. Bernal, J. J. Calving, G. A. Cifredo, J. M. Rodríguez-Izquierdo, V. Perrichon and A. Laachir, J. Catal., 1992, 137, 1–11 CrossRef CAS.
- P. Sripada, J. Kimpton, A. Barlow, T. Williams, S. Kandasamy and S. Bhattacharya, J. Catal., 2020, 381, 415–426 CrossRef CAS.
- B. Ouyang, W. Tan and B. Liu, Catal. Commun., 2017, 95, 36–39 CrossRef CAS.
- E. J. Choi, Y. H. Lee, D. W. Lee, D. J. Moon and K. Y. Lee, Mol. Catal., 2017, 434, 146–153 CrossRef CAS.
- L. Zhao, C. Li, S. Li, Y. Wang, J. Zhang, T. Wang and G. Zeng, Appl. Catal., B, 2016, 198, 420–430 CrossRef CAS.
- Z. Ma, X. Wu, Z. Si, D. Weng, J. Ma and T. Xu, Appl. Catal., B, 2015, 179, 380–394 CrossRef CAS.
- M. Zabilskiy, P. Djinović, B. Erjavec, G. Dražić and A. Pintar, Appl. Catal., B, 2015, 163, 113–122 CrossRef CAS.
- R. Frahm, M. Nachtegaal, J. Stötzel, M. Harfouche, J. A. Van Bokhoven and J. D. Grunwaldt, in AIP Conference Proceedings, 2010, vol. 1234, pp. 251–255 Search PubMed.
- A. H. Clark, J. Imbao, R. Frahm and M. Nachtegaal, J. Synchrotron Radiat., 2020, 27, 551–557 CrossRef.
- B. Ravel, M. Newville and IUCr, J. Synchrotron Radiat., 2005, 12, 537–541 CrossRef CAS.
- A. R. Denton and N. W. Ashcroft, Phys. Rev. A: At., Mol., Opt. Phys., 1991, 43, 3161–3164 CrossRef CAS.
- A. Szizybalski, F. Girgsdies, A. Rabis, Y. Wang, M. Niederberger and T. Ressler, J. Catal., 2005, 233, 297–307 CrossRef CAS.
- M.-F. Luo, Y.-P. Song, J.-Q. Lu, X.-Y. Wang and Z.-Y. Pu, J. Phys. Chem. C, 2007, 111, 12686–12692 CrossRef CAS.
- X. Yao, F. Gao, Q. Yu, L. Qi, C. Tang, L. Dong and Y. Chen, Catal. Sci. Technol., 2013, 3, 1355–1366 RSC.
- R. Si, J. Raitano, N. Yi, L. Zhang, S.-W. Chan and M. Flytzani-Stephanopoulos, Catal. Today, 2012, 180, 68–80 CrossRef CAS.
- Y. Zhang, C. Chen, X. Lin, D. Li, X. Chen, Y. Zhan and Q. Zheng, Int. J. Hydrogen Energy, 2014, 39, 3746–3754 CrossRef CAS.
- K. Larmier, W.-C. Liao, S. Tada, E. Lam, R. Verel, A. Bansode, A. Urakawa, A. Comas-Vives and C. Copéret, Angew. Chem., Int. Ed., 2017, 56, 2318–2323 CrossRef CAS.
- K. Fujiwara, S. Tada, T. Honma, H. Sasaki, M. Nishijima and R. Kikuchi, AIChE J., 2019, 65, e16717 CrossRef CAS.
- O. Martin, A. J. Martín, C. Mondelli, S. Mitchell, T. F. Segawa, R. Hauert, C. Drouilly, D. Curulla-Ferré and J. Pérez-Ramírez, Angew. Chem., Int. Ed., 2016, 55, 6261–6265 CrossRef CAS.
- S. A. French, A. A. Sokol, S. T. Bromley, C. R. A. Catlow and P. Sherwood, Top. Catal., 2003, 24, 161–172 CrossRef CAS.
Footnote |
| † Electronic supplementary information (ESI) available. See DOI: 10.1039/d0cy01762k |
| This journal is © The Royal Society of Chemistry 2021 |

