Gated and non-gated silver detection using microwave-assisted laser induced breakdown spectroscopy
M. A.
Wakil
 and
Zeyad T.
Alwahabi
 *
*
School of Chemical Engineering and Advanced Materials, The University of Adelaide, SA 5005, Australia. E-mail: zeyad.alwahabi@adelaide.edu.au
First published on 9th November 2020
Abstract
The detection of silver using microwave-assisted laser induced breakdown spectroscopy (MW-LIBS) is demonstrated in solid and liquid samples at a 338.28 nm emission line. For solid sample analysis, the limit of detection (LoD) with a gated detector has been compared with that of a portable spectrometer with a non-gated detector. The LoD achieved by the gated and non-gated detectors are 4.5 ± 1.0 ppm and 7 ± 2.3 ppm, respectively. For aqueous silver, the LoD was found to be 385 ± 51 ppb. The LoD of MW-LIBS is more effective in liquid sample analysis than in solid sample analysis for atomic detection. The accuracy of the established calibration curve, based on the gated detector, has been verified to be ∼84%. For MW-LIBS, it was observed that relatively low laser energy is sufficient to develop a calibration curve and achieve an outstanding LoD.
1. Introduction
The precise, accurate and fast detection of precious metals is becoming an important aspect of the mining industry, in terms of exploration, development and production. Silver is one of the world's most precious metals of the platinum family with is used in a wide variety of applications such as antimicrobials, disinfectants, biosensor materials, composite fibres, cryogenic superconducting materials, cosmetic products, electrical components, food packaging, functionalized plastics, wound dressings, photographic materials and processing, electroless plating, coating, brazing and soldering uses, etc.1–6 Due to its intensive usage, it is suggested that silver likely ends up in the environment through landfill, wastewater, soil surface, and contamination of surface water by natural leaching caused by bedrock and mining activities. Silver may exist in different oxidation states such as Ag0, Ag1+, Ag2+ and Ag3+.7 Only a few silver compounds are deemed toxic, for example the silver thiosulfate complex (least toxic) and silver nitrate (most toxic).8 However, the wastage of silver, given its economic value, requires fast effective detection for proper quantification.Several analytical techniques involving digestion methods for quantification of precious metals are reported in the literature. They include, for instance, fire assay, wet acid treatment, direct chlorination, alkaline oxidation fusion, etc.9 Maria Balcerzak9 reviewed all the digestion methods including the advantages and hindrances of these methods. However, only a few detection techniques for silver are reported in the literature such as silver-specific DNA10 and visual detection based on gold nanoparticles (AuNPs)11 for silver ions. These techniques are limited to liquid samples and require a long detection time. The laser induced breakdown spectroscopy (LIBS) technique is a promising fast detection technique that may satisfy the requirements of the mining industry due to its substantial unique characteristics such as in situ, online and multi-element analysis with minimal or no sample preparation.12
However, using LIBS, Daniel et al. detected silver in ore samples13 and reported a limit of detection (LoD) of 1 ppm. R. W. Septianti et al.14 checked the authenticity of silver jewellery and reported a LoD of 2.74%. I. Rehan et al.15 used monosodium glutamate and reported a detection limit of 0.57 ppm. However, there is a limitation to the LIBS technique in that it cannot estimate the extent of metals with complex structures and elements with a high content (due to matrix and self-absorption effects).16 Poor repeatability is also a significant limitation of LIBS.16 Another important limitation of LIBS observed by this present study's authors is the need to apply significantly high laser energy for proper signal analysis. For example, Daniel Diaz et al. applied 100–180 mJ laser energy in their experiment,13 and I. Rehan and his group applied about 60 mJ for silver detection in their analysis.15 The application of high laser energy makes the system more destructive when it is implemented outside the laboratory environment.
The microwave-assisted LIBS technique (MW-LIBS) is a promising technique in that it enables the system to be less destructive because it employs significantly less laser energy. It is reported that the MW-LIBS system is more advantageous than LIBS because of certain benefits, for instance a long plasma lifetime, larger volume, strong emission intensity, better stability and ability to reduce self-absorption.17,18 For example, Viljanen et al. observed an approximate 93-fold higher LoD with MW-LIBS compared to LIBS for copper19 at 2.5 mJ laser energy. Chen et al.20 reported a 3.38 μg g−1 limit of copper detection, using Near Field Applicator (NFA) microwave devices. Wall et al. reported an 11.5-fold enhanced LoD for indium at a laser pulse fluence of 85.2 J cm−2.21 Al Shuaili et al.22 established an 8-fold improved LoD with MW-LIBS for palladium at 650 J cm−2. Similarly, Khumaeni et al.23 reported about a 32-fold enhancement for gadolinium (Gd) at 5 mJ laser energy.
This work focusses on the evaluation of MW-LIBS for silver detection in a laboratory under ambient conditions in solid and liquid phases. The study will be carried out with two spectrometers, namely a spectrometer with an ICCD camera and a portable small spectrometer without an ICCD at low laser energy. The focus is comparing the detection limit using both the spectrometers with MW-LIBS in order to make the system compatible with practical conditions outside the laboratory. The experiment includes microwave dependence on the signal-to-noise ratio (SNR), plasma temperature and electron density measurement and quantitative detection of silver. The calibration curve and the LoD was obtained using standard ore samples with different contents of silver.
2. Methodology
2.1 MW-LIBS experimental setup
A schematic diagram of the MW-LIBS experimental setup is presented in Fig. 1(a) and (b) for solid and liquid detection, respectively. A Q-switch second order harmonic Nd:YAG laser with a wavelength of 532 nm was utilized as a light source. The pulse width was ∼6 ns with a repetition of 10 Hz. A combined half-wave plate (HWP) and Glan-laser polarizer (P) were used for controlling the ablation pulse energy. The laser energy was measured with a Pyroelectric sensor (ES 220C). The laser beam was allowed to pass along the sample surface by a dichroic mirror (DM) with a high reflectivity in the spectral range of 500–550 nm. Then the beam was focussed on the sample surface using a fused silica lens (with f = 100 mm). The propagation of the laser beam was at a 15° angle to the vertical surface and the spot size was estimated to be 7.32 μm. In this experiment, 2 mJ laser energy was considered, while 1–3 mJ laser energy was used for the smallest amount of laser energy in our experiment. To achieve ablation from the fresh sample surface for each shot, the sample was placed on a rotating disk at an angular velocity of 7 revolutions per minute. A second continuous-wave (CW)24 laser armed with a camera served to monitor the uniform height between the sample and laser beam with a camera connected to a display unit.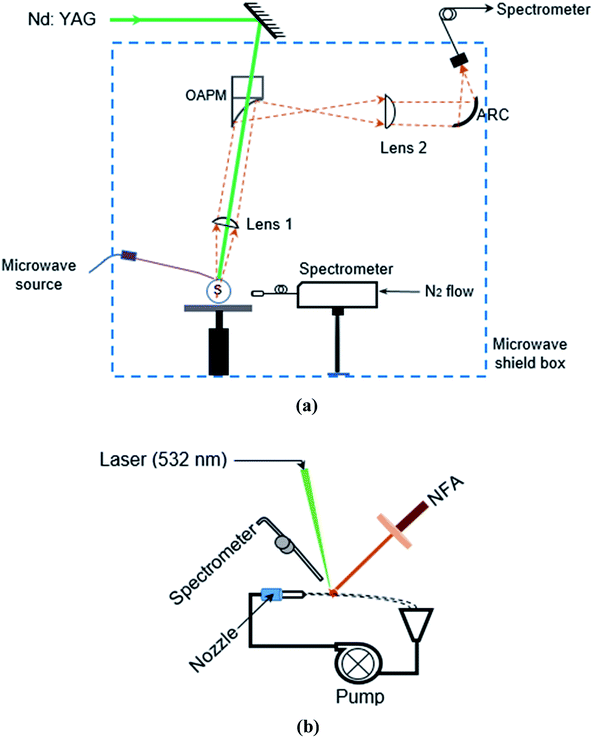 | ||
| Fig. 1 (a) Schematic diagram of the experiment for solid silver. (b) Schematic diagram of the experiment for liquid silver. | ||
For liquid samples, a steady liquid circulation system was used. To achieve this, a peristaltic pump (Ismatec, MW-MSC 1), a 25 ml syringe as a sample reservoir, a circular nozzle with a 0.8 mm diameter and a collection funnel were connected to rubber-plastic tubing (Masterflex 6485-16). This process created a liquid circulation system as shown in Fig. 1(b). At 360 rpm of pump operation, ∼50 ml solution from liquid samples was periodically added to the syringe in order to avoid any bubble in the liquid circulation system. The operating flow rate was chosen to create a stable horizontal liquid jet (70 ml min−1). The laser incident was at an angle of 15° to the vertical surface. It is worth noting that distilled water was used to wash out the Ag sample in the flow to avoid contamination after each analysis.
A water-cooled 3000-Watt Sairem microwave system was utilized with a frequency of 2.45 GHz (GMP30KIP56T400FST3IR). The microwave was directed via a WR340 waveguide to a 3-stub impedance tuner (AI3SMWR340D24X25MRR2PE) and then to a waveguide-to-coaxial adaptor (WR340RN) through a quartz window. The waveguide-to-coaxial adaptor was connected to an NFA device by a 1 m flexible coaxial cable (50 Ω NN cable) with 0.14 dB@2.45 GHz. The design details of the NFA have been reported by Chen et al.20 To avoid possible silver contamination from the coating of the NFA core wire, a pure platinum wire (99.9%) was soldered to the end of the NFA. The tip of the NFA was positioned approximately 1 mm and 0.5 mm vertically above the sample surface and horizontally away from the ablation spot, respectively. The microwave pulse duration and microwave power were controlled with an analogue signal from an Aim-TTi type pulse generator. For the solid matrix and for the liquid matrix, 450 W and 1200 W microwave power was used respectively at pulse duration of 1.5 ms.
To analyse the plasma emission resulting from ablation, two spectrometers were employed, namely the gated (a spectrometer with an ICCD) and non-gated (a spectrometer without an ICCD) types.
For the gated detection, the plasma emission was collected directly through a perforated parabolic mirror (FL = 152 mm) and then focussed by a plano-convex lens (FL = 100 nm), onto the sample by a plano-convex UV fused silica lens with a focal length of 100 mm and a diameter of 50.8 mm. The emission was collimated by a plano-convex lens (FL = 100 nm) and then focused by an off-axis parabolic mirror (OAPM). A second lens (FL = 20 mm) coupled the emission onto an Achromatic Reflective Coupler (ARC), which is connected to a 7-fibre bundle (Thorlabs, BFL200HS02). The fibre bundle was a round-to-linear bundle, 7× Ø 200 μm core. The spectrometer (Andor Shamrock 500i) with a grating of 2400 lines per mm has a spectral resolving power of 10![[thin space (1/6-em)]](https://www.rsc.org/images/entities/char_2009.gif) 000, i.e., the spectral resolution is 0.031 nm in the 320–332 nm spectral range. An intensified CCD camera (Andor, iStar) recorded the spectral signal, which was then synchronized with the laser and the microwave generator with an external signal delay box (Princeton Technology Corporation). In this study, the microwave pulse duration was kept constant at 1.5 ms.
000, i.e., the spectral resolution is 0.031 nm in the 320–332 nm spectral range. An intensified CCD camera (Andor, iStar) recorded the spectral signal, which was then synchronized with the laser and the microwave generator with an external signal delay box (Princeton Technology Corporation). In this study, the microwave pulse duration was kept constant at 1.5 ms.
Referring to non-gated spectrometry, the plasma emission was collected by a 600 μm, 0.25 m long, solarisation-resistant fibre. The fibre, placed 20 mm away from the plasma, was connected to a Mayo2000-Pro (Ocean Optics) equipped with a 25 μm entrance slit and nitrogen gas purge port. The spectrometer had a vacuum deep UV mirror and a UV holographic grating with a groove density of 1200. Spectra were recorded by a windowless and back-illuminated uncooled detector (Hamamatsu S10420). The detector contains 2048 × 64 active pixels and has a quantum efficiency of 60% at 250 nm. This configuration has improved the light collection efficiency and signal-to-noise ratio significantly. The integration time was fixed at 8 ms for this spectrometer with wavelengths ranging from 179 nm to 400 nm.
2.2 Samples
The study was carried out with solid ore samples and a high purity standard of 1% liquid silver for calculating the silver detection limit. Certified reference materials from GEOSTATS Mining Industry Consultants Reference Material Manufacture and Sales were purchased, namely, GBC915-3, GBC616-2, GLC915-1, GBC916-3, GLC316-2, and GLC615-6. These samples contained silver of different certified concentrations (58 ± 5 ppm–1373 ± 84 ppm). All the samples were made by mixing the supplied samples with distilled water and organic binder. All the samples were prepared as disks (20.45 ± 0.1 mm dia. and 1.8 ± 0.02 mm thick) by simple green compacting using an aluminium holder that were best suited for the rotating disk. The liquid silver of 1% was purchased from Choice Analytical for analysis purposes. The liquid samples of different concentrations (10 ppm–500 ppm) were prepared by diluting the pure sample with distilled water. Silver concentrations used in solid and liquid detection have been shown in Table 1.| Element | Concentration (ppm), solid | Standard deviation (σ) | Concentration (ppm), liquid |
|---|---|---|---|
| Silver (Ag) | 58 | 5 | 10 |
| 209 | 59 | 20 | |
| 416 | 16 | 50 | |
| 493 | 49 | 70 | |
| 527 | 29 | 100 | |
| 1373 | 84 | 150 | |
| — | — | 200 | |
| — | — | 500 |
3. Results and discussion
3.1 Spectral information
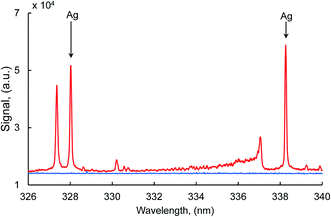
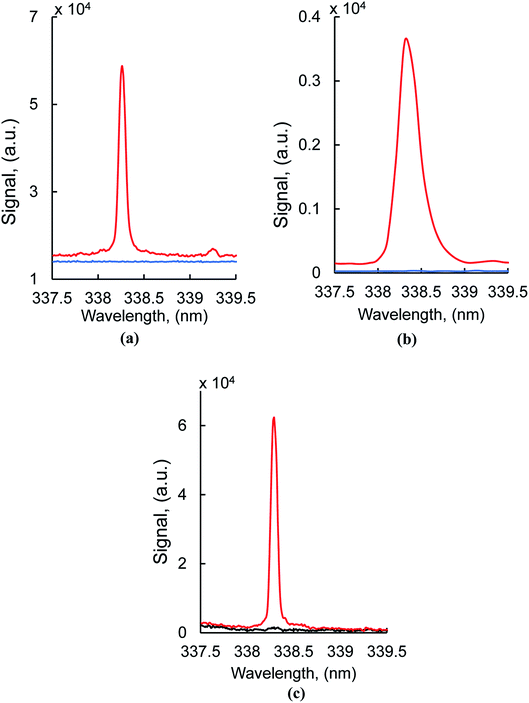
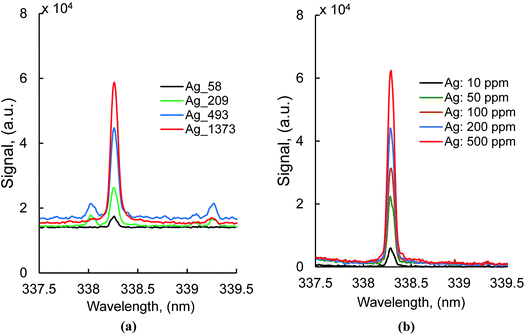
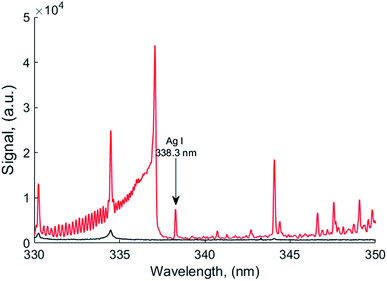
Typical silver atomic lines recorded using MW-LIBS are presented in Fig. 2. Silver (AgI) has two strong transition lines at 328.06 nm and 338.28 nm with the same transition 5P 2P0 → 5S 2S, which is between 0.0 cm−1 to 30472.66 cm−1 and 0.00 cm−1 to 29552.05 cm−1. Copper has a very strong line at 327.4 nm which is closer to 328.0 nm (AgI) as shown in Fig. 2. For that reason, the line at 328.06 nm was not considered for this study. The experimental analysis was continued for both LIBS and MW-LIBS with two different spectrometers (variable configurations) but at relatively low laser energy (2 mJ), LIBS did not give any visible spectra for Ag at 338.28 nm as shown in Fig. 3(a) and (b). It is seen from Fig. 3 that the signal with the portable non-gated spectrometer is smaller (Fig. 3(b)) than when employing the gated spectrometer (Fig. 3(a)). This may be due to the gated spectrometer's detector gain. The aim of this study was to determine the spectra at very low laser energy. At 2 mJ, MW-LIBS shows sufficient signal strength for calculating the limit of detection (LoD). Fig. 3(c) shows the silver spectra in the liquid phase. To check the contamination of silver from distilled water, the experiment was conducted for distilled water utilizing the same operating conditions that are illustrated in Fig. 3(c) (black). It was observed that no contamination of silver from distilled water occurred. The experiment for liquid silver was conducted at 10 mJ laser energy, which was higher than the laser energy in the solid phase because of inconsistent laser plasma below 10 mJ in liquid samples. Fig. 4(a) and (b) show the sample emission spectra of AgI at 338.28 nm for different concentrations of Ag with MW-LIBS in solid and liquid silver containing samples, respectively.3.2 Signal to noise ratio measurement
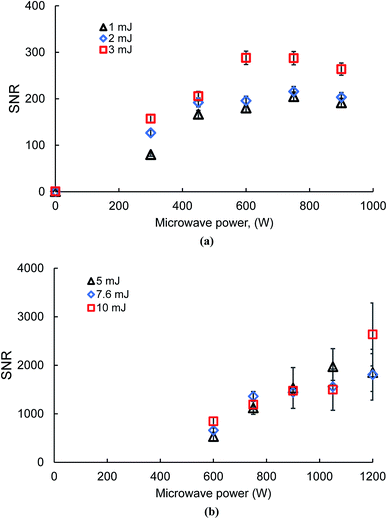
To justify the operating conditions used for calculating the limit of detection, the dependence of microwave power on laser energy was investigated for an optimized signal-to-noise ratio (SNR). Fig. 5(a) and (b) present the silver SNR with solid and liquid samples, respectively. It is seen from Fig. 5 that, at very low laser energy, there is a sufficient SNR with MW-LIBS, where there is no signal with LIBS only both in the solid (1–3 mJ) and liquid (5–10 mJ), respectively. This is due to the signal microwave system's enhancing ability. The external energy supplied, using the microwave radiation, will sustain free electrons present within the laser induced plasma. These reenergized free electrons act as an excitation source, via collisional processes, leading to an extended life, which in turn finally results in signal enhancement.21,25Fig. 5(a) shows that the increase in the SNR with increasing MW power in solid samples differs slightly from the liquid samples. For the solid sample, the SNR increases until 600 W is reached and beyond this figure there is no significant impact of microwave power on the SNR. The same result was documented in our paper on chlorine26 and an unpublished report on sulphur. On the other hand, microwave power wields a significant impact on the SNR in the case of liquid samples as shown in Fig. 5(b). There is always an increasing order of the SNR when the microwave power also increases. A microwave power below 600 W has not been considered in this study due to the instability of the microwave plasma. The other reason for the weaker plasma from LIBS is explained by the reflective nature of the thin water jet, which requires more microwave power for proper coupling with the LIBS plasma. The results published by Matthew Wall et al.21 support our experimental outcomes. A laser energy below 5 mJ is not suitable for plasma formation in a liquid jet.3.3 Plasma temperature and electron density measurement
To study the MW-LIBS plasma, detailed information about plasma parameters is required. Considering the local thermodynamic equilibrium (LTE), the plasma temperature was measured using Boltzmann plots.27 Plasma temperature in the solid matrix has been measured in our accepted article.28 To measure the plasma temperature for the liquid matrix four strong lines of CaI were used. The spectral information from NIST for plasma temperature measurement is given in Table 2. The Boltzmann plots using CaI lines are shown in Fig. 6. The plasma temperature calculated for the liquid matrix using MW-LIBS was 4122 ± 192 K at 10 mJ and 1200 W. This analysis employed a minimum laser energy and microwave power for silver detection. For the solid sample, 2 mJ laser energy with 450 W microwave power gave a sufficient SNR for developing the calibration curve but for the liquid, and we employed 10 mJ laser energy with 1200 W microwave power. The reason for using relatively high laser energy and high microwave power is to ensure a consistent MW-LIBS plasma.| Wavelength (nm) | A ki (s−1) | E k (eV) | g |
|---|---|---|---|
| 364.44 | 3.55 × 10⁷ | 5.3 | 7 |
| 422.67 | 2.18 × 10⁸ | 2.93 | 3 |
| 430.25 | 1.36 × 10⁸ | 4.779 | 5 |
| 445.48 | 4.70 × 10⁷ | 4.681 | 7 |
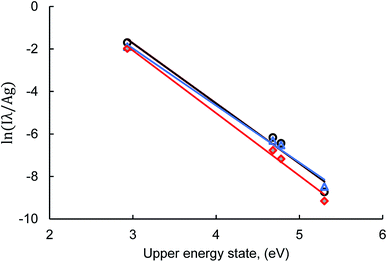 | ||
| Fig. 6 Boltzmann plot made from CaI lines at 10 mJ laser energy, 1200 W microwave power, 2 μs gate-delay, and 500 μs gate-width. | ||
The recommended spectral line for electron density calculation is a well-isolated spectral line of hydrogen at 656.279 nm. The plasma electron density in the liquid can be calculated using the relationship of full-width-half-maximum (FWHM) and electron density as expressed by Ashkenazy et al.30 as
| Ne(Hα) = 8.02 × 10¹² × (FWHM/α1/2)3/2 cm−3 | (1) |
However, the half width of the reduced stark profile (α1/2) is temperature sensitive and all the α1/2 values reported in the literature were above 10![[thin space (1/6-em)]](https://www.rsc.org/images/entities/char_2009.gif) 000 K,31 The Ca 422.59 nm line has been used to evaluate the electron density. In this case, the plasma electron density was calculated using the relationship of full-width-half-maximum (FWHM) and electron density as expressed by Harilal et al.32 A well-isolated CaI line at 422.6 nm has been chosen because this line exhibits quadratic stark broadening. The stark width broadening parameter for CaI at 422.6 nm was considered as 1.12 × 10⁻⁶ Å.33 The full-width at half-maximum (FWHM) was measured using the stark broadened calcium line as depicted in Fig. 7. The FWHM was corrected by subtracting the instrumental broadening. The instrumental broadening was measured to be 0.0321 by recoding the Hg line at 253.6 nm. The electron density measured for the liquid plasma was 3.874 × 1016 cm−3 at a laser energy and microwave power of 10 mJ and 1200 W, respectively. To understand if the plasma is at local thermodynamically equilibrium (LTE), the McWhirter criterion was calculated using eqn (2).34 For the liquid plasma the lower limit of electron density was 1.51 × 1016 cm−3 considering ΔE = 5.3 eV and T = 4122 K. These values are much lower than the electron densities calculated for the solid and liquid samples, which substantiates the LTE conditions:
000 K,31 The Ca 422.59 nm line has been used to evaluate the electron density. In this case, the plasma electron density was calculated using the relationship of full-width-half-maximum (FWHM) and electron density as expressed by Harilal et al.32 A well-isolated CaI line at 422.6 nm has been chosen because this line exhibits quadratic stark broadening. The stark width broadening parameter for CaI at 422.6 nm was considered as 1.12 × 10⁻⁶ Å.33 The full-width at half-maximum (FWHM) was measured using the stark broadened calcium line as depicted in Fig. 7. The FWHM was corrected by subtracting the instrumental broadening. The instrumental broadening was measured to be 0.0321 by recoding the Hg line at 253.6 nm. The electron density measured for the liquid plasma was 3.874 × 1016 cm−3 at a laser energy and microwave power of 10 mJ and 1200 W, respectively. To understand if the plasma is at local thermodynamically equilibrium (LTE), the McWhirter criterion was calculated using eqn (2).34 For the liquid plasma the lower limit of electron density was 1.51 × 1016 cm−3 considering ΔE = 5.3 eV and T = 4122 K. These values are much lower than the electron densities calculated for the solid and liquid samples, which substantiates the LTE conditions:
| Ne ≥ 1.6 × 10¹²ΔE3Te1/2 | (2) |
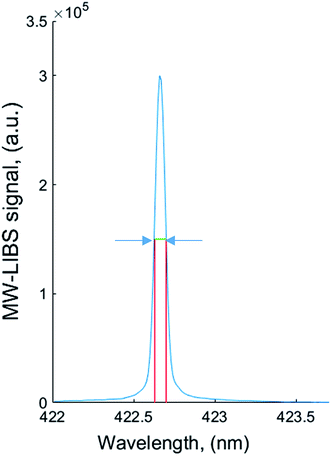 | ||
| Fig. 7 Typical example of full width at half-maximum of CaI at 422.6 nm in the liquid sample at 10 mJ laser energy and 1200 W microwave power. | ||
3.4 Quantitative detection of silver
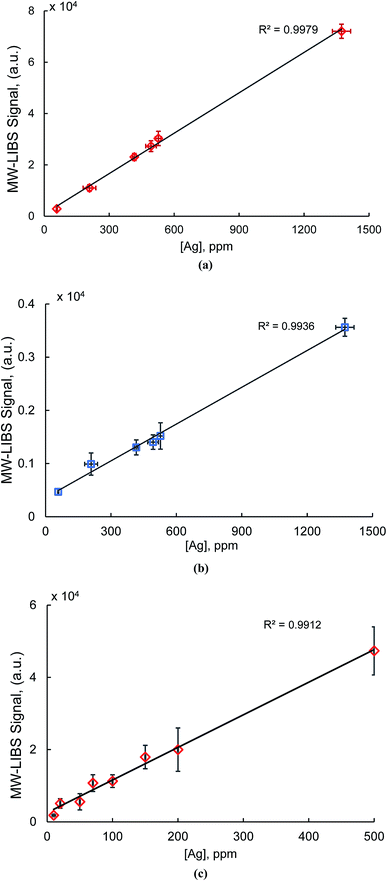
Calibration curves were generated using the MW-LIBS signal for both solid and liquid matrices. Calibration curves were developed using the strong silver line at 338.28 nm. For calculating the LoD in solid and liquid phases, the experimental conditions were different.However, studies13–15 have been undertaken for the detection of silver as discussed in the Introduction section. To the best of our knowledge, the best LoD for silver was reported by Rehan et al.15 using silver containing salt samples. They reported the LoD as 0.57 ppm which is lower than our present study of 4.5 ppm, but they employed high laser energy (60 mJ), while our experiment was conducted with only 2 mJ laser energy. To the best of our knowledge, our study is the first to report silver detection in liquid samples with MW-LIBS. Paing et al. reported 3.1 ppm silver detection in a liquid via the liquid sampling-atmospheric glow discharge optical emission spectroscopy (LS-APGD-OES) method.37
4. Conclusion
Quantitative silver detection with gated and non-gated spectrometers using the microwave-assisted LIBS technique is reported for the first time. Silver detection has been described here for solid and liquid samples. The limit of detection with a laboratory-scale gated spectrometer was compared to that of a portable non-gated spectrometer. The MW-LIBS technique is more sensitive in the liquid than in the solid for achieving a superior detection limit. The experimental study was carried out at a very low laser energy, the objective being to establish the effectiveness of MW-LIBS when compared to LIBS. It has been shown that MW-LIBS is able to achieve a strong signal with low laser energy, yet LIBS is unable to detect any signal by using silver at 338.28 nm. The limit of detection reported in this study is 4.5 ± 1.0 ppm in the solid and 0.385 ± 0.051 ppm in the liquid. The detection limit of silver is also calculated using a portable spectrometer at 7 ± 2.3 ppm. The calibration curve, based on the gated spectrometer, has been verified using another certified ore sample with ∼84% accuracy.Conflicts of interest
There are no conflicts to declare.References
- P. Verma and S. K. Maheshwari, Int. J. Nano Dimens., 2019, 10, 18–36 CAS.
- T. W. Purcell and J. J. Peters, Environ. Toxicol. Chem., 1998, 17, 539–546 CrossRef CAS.
- S. Senapati, PhD thesis, Savitribai Phule Pune University, 2005.
- T. Klaus-Joerger, R. Joerger, E. Olsson and C.-G. Granqvist, Trends Biotechnol., 2001, 19, 15–20 CrossRef CAS.
- J. Fabrega, S. N. Luoma, C. R. Tyler, T. S. Galloway and J. R. Lead, Environ. Int., 2011, 37, 517–531 CrossRef CAS.
- C. Zhang, Z. Hu and B. Deng, Water Res., 2016, 88, 403–427 CrossRef CAS.
- E. McGillicuddy, I. Murray, S. Kavanagh, L. Morrison, A. Fogarty, M. Cormican, P. Dockery, M. Prendergast, N. Rowan and D. Morris, Sci. Total Environ., 2017, 575, 231–246 CrossRef CAS.
- H. T. Ratte, Environ. Toxicol. Chem., 1999, 18, 89–108 CrossRef CAS.
- M. Balcerzak, Sample Digestion Methods for the Determination of Traces of Precious Metals by Spectrometric Techniques, 2002 Search PubMed.
- K. Jang, J. You, C. Park and S. Na, New J. Chem., 2017, 41, 1840–1845 RSC.
- B. Liu, H. Tan and Y. Chen, Microchim. Acta, 2013, 180, 331–339 CrossRef CAS.
- Laser Induced Breakdown Spectroscopy, ed. A. Miziolek, V. Palleschi and I. Schechter, Cambridge University Press, Cambridge, 2006, DOI:10.1017/CBO9780511541261.
- D. Díaz, D. W. Hahn and A. Molina, Spectrochim. Acta, Part B, 2017, 136, 106–115 CrossRef.
- R. W. Septianti, W. S. Budi, H. Sugito and A. Khumaeni, in 7th International Seminar on New Paradigm and Innovation on Natural Science and its Application, ed. B. Warsito, S. P. Putro and A. Khumaeni, Iop Publishing Ltd, Bristol, 2018, vol. 1025 Search PubMed.
- I. Rehan, M. A. Gondal and K. Rehan, Appl. Opt., 2018, 57, 3191–3197 CrossRef CAS.
- D. A. Cremers and L. J. Radziemski, in Laser Induced Breakdown Spectroscopy, ed. A. W. Miziolek, I. Schechter and V. Palleschi, Cambridge University Press, Cambridge, 2006, pp. 1–39, DOI:10.1017/CBO9780511541261.002.
- Y. Ikeda and R. Tsuruoka, Appl. Opt., 2012, 51, B183–B191 CrossRef CAS.
- Y. Tang, J. Li, Z. Hao, S. Tang, Z. Zhu, L. Guo, X. Li, X. Zeng, J. Duan and Y. Lu, Opt. Express, 2018, 26, 12121–12130 CrossRef CAS.
- J. Viljanen, Z. Sun and Z. T. Alwahabi, Spectrochim. Acta, Part B, 2016, 118, 29–36 CrossRef CAS.
- J. Chen, A. Iqbal, M. Wall, C. Fumeaux and Z. T. Alwahabi, J. Anal. At. Spectrom., 2017, 32, 1508–1518, 10.1039/C7JA00046D.
- M. Wall, Z. W. Sun and Z. T. Alwahabi, Opt. Express, 2016, 24, 1507–1517 CrossRef CAS.
- A. A. Al Shuaili, A. M. Al Hadhrami, M. A. Wakil and Z. T. Alwahabi, Spectrochim. Acta, Part B, 2019, 159, 105666 CrossRef CAS.
- A. Khumaeni, T. Motonobu, A. Katsuaki, M. Masabumi and W. Ikuo, Opt. Express, 2013, 21, 29755–29768 CrossRef.
- M. Bahreini, B. Ashrafkhani and S. H. Tavassoli, Appl. Phys. B: Lasers Opt., 2014, 114, 439–447 CrossRef CAS.
- Y. Liu, B. Bousquet, M. Baudelet and M. Richardson, Spectrochim. Acta, Part B, 2012, 73, 89–92 CrossRef CAS.
- M. A. Wakil and Z. T. Alwahabi, J. Anal. At. Spectrom., 2019, 34(9), 1892–1899 RSC.
- J. Zalach and S. Franke, J. Appl. Phys., 2013, 113, 043303 CrossRef.
- M. A. Wakil and Z. T. Alwahabi, J. Anal. At. Spectrom., 2020, 35(11), 2620–2626 RSC.
- J. Reader, C. H. Corliss, W. L. Wiese and G. A. Martin, Wavelengths and Transition Probabilities for Atoms and Atomic Ions : Part I. Wavelengths - Part II. Transition Probabilities, National Bureau of Standards, NSRDS; NIST researchlibrary; fedlink; americana, 1980 Search PubMed.
- J. Ashkenazy, R. Kipper and M. Caner, Phys. Rev. A, 1991, 43, 5568–5574 CrossRef CAS.
- P. Kepple and H. R. Griem, Phys. Rev., 1968, 173, 317–325 CrossRef CAS.
- S. Harilal, C. Bindhu, R. Issac, V. P. N. Nampoori and C. Vallabhan, J. Appl. Phys., 1997, 82, 2140–2146 CrossRef CAS.
- M. S. Dimitrijevic and S. Sahal-Brechot, Serb. Astron. J., 2000, 161, 39 CrossRef.
- R. W. P. McWhirter, Plasma Diagnostic Techniques, ed. R. H. Huddlestone and S. L. Leonard, Library of Congress Catalog Card Number 65-22763, Academic Press, New York, 1965, p. 201 Search PubMed.
- S. Rosenwasser, G. Asimellis, B. Bromley, R. Hazlett, J. Martin, T. Pearce and A. Zigler, Spectrochim. Acta, Part B, 2001, 56, 707–714 CrossRef.
- D. W. Hahn and N. Omenetto, Appl. Spectrosc., 2012, 66, 347–419 CrossRef CAS.
- H. W. Paing, K. A. Hall and R. K. Marcus, Spectrochim. Acta, Part B, 2019, 155, 99–106 CrossRef CAS.
| This journal is © The Royal Society of Chemistry 2021 |

