 Open Access Article
Creative Commons Attribution 3.0 Unported Licence
Huge dielectric constants of the ferroelectric smectic-A phase in bent-shaped dimeric molecules†
Shigemasa
Nakasugi
 *a,
Sungmin
Kang
ab,
Junji
Watanabe
b,
Hiroki
Ishizaki
ab and
Masato
Sone
b
aAdvanced Technology Research Department, LG Japan Lab Inc., Shinagawa, Tokyo 140-0002, Japan. E-mail: shigemasa.nakasugi@lgjlab.com
bInstitute of Innovative Research, Tokyo Institute of Technology, Yokohama, Kanagawa 226-8503, Japan
First published on 8th September 2021
Abstract
We present the dielectric relaxation properties of the ferroelectric smectic-A (SmAPF) phase formed by a mixture of bent-shaped dimeric molecules α,ω-bis(4-alkoxyanilinebenzylidene-4′-carbonyloxy)pentanes with different alkyl chain lengths. The SmAPF phase shows a Goldstone-like mode at approximately 500 Hz, which can be attributed to the ferroelectricity and huge dielectric strength (Δε). Δε varies dramatically with the cell thickness; in particular, it attains more than 7000 in a 50 μm-thick cell, which is much higher compared to that reported in the bent-shaped molecules.
Introduction
Since the reports on bent-shaped molecules with unique polarity by Watanabe et al.,1–3 bent-shaped molecules have become an important field in the investigation of liquid crystals. In particular, the ferroelectric and the antiferroelectric smectic phases that comprise bent-shaped molecules are of great interest because they can be switched between different polar ordered states by electric fields.2 Various bent-shaped molecules, with ferroelectric and antiferroelectric behaviors, have been synthesized and investigated to clarify the structure–property relationships associated with their profound mesomorphic properties.4,5Bent-shaped dimeric molecules with two aromatic mesogens linked by an odd-carbon numbered alkyl spacer are another type of bent-shaped dimeric molecules that form polar phases.6–9 Two mesogens in a molecule are forced to be relatively tilted to each other by the conformational constraint of the alkyl spacer.3,10 The typical molecules are α,ω-bis(4-alkoxyanilinebenzylidene-4′-carbonyloxy)pentanes (mOAM5AMOm)7–9 with the formula shown in Fig. 1. These bent-shaped dimeric molecules form three types of smectic liquid crystals (refer to Fig. S1, ESI†), depending on the alkoxy tail group.7 When the tail length was short (m = 4 and 6), the SmCAs phase was formed. Here each mesogen, but not a bent-shaped dimeric molecule, participated to form each smectic layer. When the tail length was medium (m = 8–12), the frustrated SmCAf phase was formed. When the tail length was long (m = 14–18), the smectic structure was identified as the antiferroelectric SmCAPA phase, where each bent-shaped dimeric molecule participates in each layer comprising a bilayer of mesogenic groups. Within a layer, the bent-shaped dimeric molecules are packed with significant tilting of the molecular axis and with the same direction of the bent (polar) axis. The polar directions are opposite between the neighboring layers. Furthermore, the mixture of 4OAM5AMO4 forming the SmCAs phase and 16OAM5AMO16 forming the SmCAPA phase with antiferroelectricity formed the ferroelectric smectic-A (SmAPF) phase in a specific ratio. The ferroelectricity of the SmAPF phase was identified by a single current peak under a triangular wave field (refer to Fig. S2, ESI†) and clear second harmonic generation.9
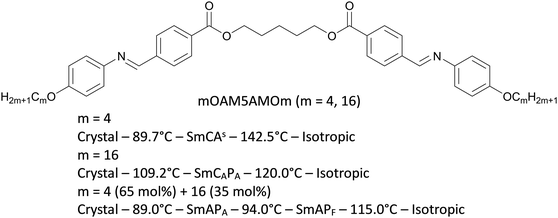 | ||
| Fig. 1 Molecular structures and phases sequence for mOAM5AMOm (m = 4, 16, and 4 + 16). The transition temperatures are taken from the DSC cooling run and the switching current curve.9 | ||
The SmAPF phase generally shows that the molecules lie perpendicular to the layer, with ferroelectric alignment of the polar directions (refer to Fig. S1(d), ESI†). Bent-shaped dimeric molecules and general bent-shaped molecules form SmCPF and SmCPA, but the SmAPF phase is not commonly observed in these systems.2,5–8 For example, W586 consisting of a bent-shaped molecule with a carbosilane group at a terminal chain suppresses out-of-layer fluctuations, favoring anticlinic tail orientation and thus the SmAPF phase due to the influence of carbosilane.11–13 In bent-shaped dimeric molecules, mixing of 4OAM5AMO4 and 16OAM5AMO16 with different alkyl chain lengths obviously prevents the tilted association of molecules, although the reason is not clear.9 As one of the properties of the SmAPF phase with a bent-shaped molecule, Guo et al. reported that W586 has high dielectric constants.14
In this study, we examined the dielectric relaxation properties of the SmAPF phase in bent-shaped dimeric molecules and showed extremely large dielectric constants of 2000–7000 attributable to the collective fluctuation of the polar molecules.
Results and discussion
The molecular structures and the phase sequence (refer to Fig. S3, ESI,† as a differential scanning calorimetry (DSC) chart) of the bent-shaped dimeric molecules 4OAM5AMO4 and 16OAM5AMO16, and the mixture (4OAM5AMO4 (65 mol%) + 16OAM5AMO16 (35 mol%)) are given in Fig. 1.To clarify both the non-collective and collective motions of the molecules, dielectric dispersion measurements were performed in the SmCAs (m = 4), SmCAPA (m = 16), and SmAPF (mixture of m = 4 and 16) phases. Here, it should be noted that the domain size is small especially in the SmAPF and the SmCAPA phases just as cooled from the isotropic phase. Hence, the domains of SmAPF and SmCAPA were enlarged by applying an AC field of 5 Vpp μm−1 and 33 Vpp μm−1, respectively; they were grown by agitation of molecular motion due to ferroelectric switching. In Fig. 2(a) and (b), the real (ε′) and imaginary (ε′′) parts of the dielectric constants are plotted against the frequency from 101 to 107 Hz, respectively. Two relaxation modes are observed in this frequency range. One is a low frequency mode which is observed at approximately 500 Hz in the SmAPF phase and possesses huge dielectric constants. The low relaxation frequency (fr) of the order of 1 kHz or less,14–16 as well as the suppression under DC bias fields (mentioned later), shows that this mode is a Goldstone-like mode, collective fluctuation of polarization that is attributable to the ferroelectric phase. The other is a high frequency mode observed at approximately 100 kHz in the SmCAs and the SmCAPA phases. The isotropic phase also exhibits this mode. It is attributable to non-collective molecular rotation around the short axis of the mesogens as observed in conventional liquid crystal phases.17,18
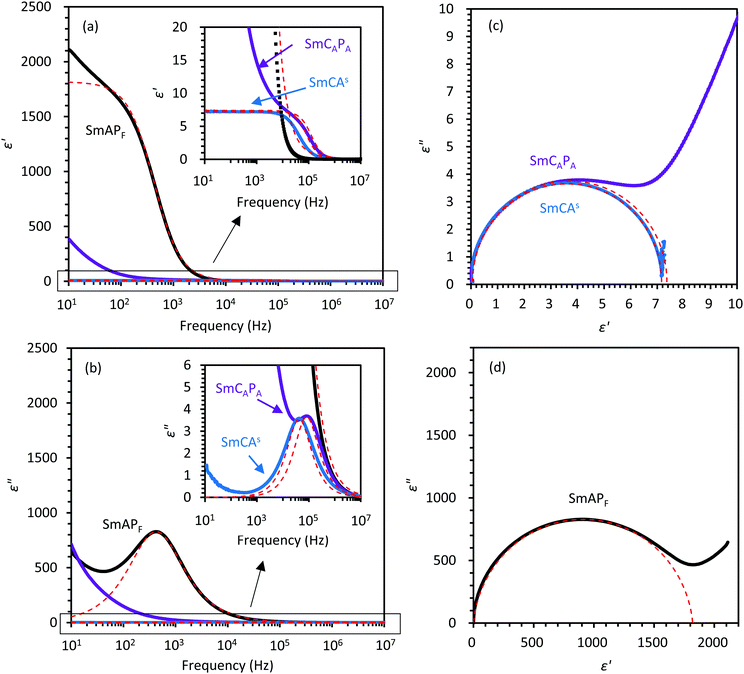 | ||
| Fig. 2 (a) and (b) Frequency dependence of the real (ε′) and imaginary (ε′′) parts of the complex dielectric constants of the SmCAPA (at 114 °C), SmCAs (at 90 °C) and SmAPF (at 98 °C) phases, measured in a 3 μm-thick cell. In the insets, the vertical axis is expanded to clarify the high frequency mode. The dashed curves are obtained by fitting eqn (1). (c) Cole–Cole plot for the high frequency mode of the SmCAPA and SmCAs phases, and (d) Cole–Cole plot for the Goldstone-like mode of the SmAPF phase, based on the data of Fig. 2(a and b). The dashed curves are obtained by fitting eqn (1). | ||
Fig. 2(c) and (d) show the Cole–Cole plots for these two modes. The experimental dielectric spectra were further analyzed by fitting the following Cole–Cole model:19
 | (1) |
Most significant is that Δε is very large (approximately 1800) for the Goldstone-like mode of the SmAPF phase, whereas much smaller but usual values (<10) are observed in the high frequency mode of the SmCAs and the SmCAPA phases. A high Δε has been reported in the ferroelectric phases of bent-shaped molecules.14,20–22 W586 showed the maximum value of Δε (∼300) as observed in a 3 μm-thick cell.14 Furthermore, a bent-shaped azo molecule consisting of nonsymmetrical molecules with a lateral fluoro substitution on one of the wings achieved the maximum value of Δε (∼400) in a 9 μm-thick cell.22 The present Δε of 1800 exceeds these values substantially.
Fig. 3 shows the temperature dependence of the characteristic fr of the relaxation processes observed in the SmCAs, SmCAPA, and SmAPF phases in a 3 μm-thick cell. The high frequency mode observed in the SmCAs and SmCAPA phases follows the standard Arrhenius equation20,22
 | (2) |
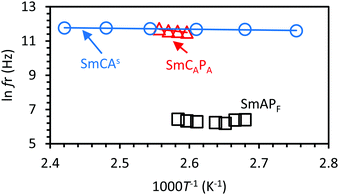 | ||
| Fig. 3 Logarithm of the dielectric relaxation frequencies as a function of inverse absolute temperature for the SmCAs, SmCAPA and SmAPF phases in a 3 μm-thick cell. | ||
As another feature of the Goldstone-like mode of the SmAPF phase, fr and Δε strongly depend on the cell thickness (refer to Fig. 4). As the thickness increases from 3 to 50 μm, fr decreases from 500 to 300 Hz. On the other hand, Δε almost linearly grows; although Δε is approximately 1800 in a 3 μm-thick cell, it is 3200, 4500, and 7400 in 10, 25, and 50 μm-thick cells, respectively.
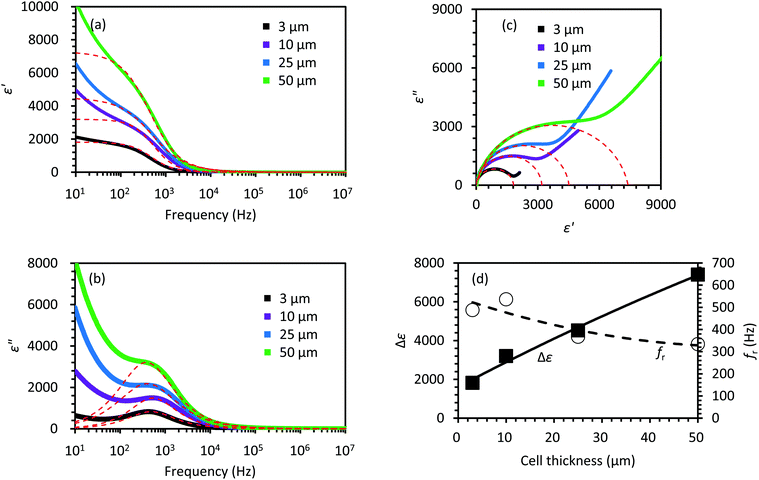 | ||
| Fig. 4 (a) and (b) Frequency dependence of the real (ε′) and imaginary (ε′′) parts of the complex dielectric constants of the SmAPF phase in 3, 10, 25, and 50 μm-thick cells. The dashed curves are obtained by fitting eqn (1). (c) Cole–Cole plot of the SmAPF phase in 3, 10, 25, and 50 μm-thick cells. The dashed curves are obtained by fitting eqn (1). (d) Cell thickness dependence of Δε and the fr in the SmAPF phase. The solid and dashed curves are guides for the eye. | ||
A similar thickness dependence of Δε for Goldstone-like modes has been observed in the ferroelectric chiral Sm-C*24 and SmAPF phases.14 Ozaki et al. found that some chiral Sm-C* materials possess dielectric constants larger than 7500 in a 250 μm-thick cell.24 Guo et al. mentioned that by linear extrapolation of Δε for W586 an even larger value (∼20![[thin space (1/6-em)]](https://www.rsc.org/images/entities/char_2009.gif) 000) is expected for this cell thickness.14 We estimated Δε by linear extrapolation similar to Guo et al. The expected Δε of 30
000) is expected for this cell thickness.14 We estimated Δε by linear extrapolation similar to Guo et al. The expected Δε of 30![[thin space (1/6-em)]](https://www.rsc.org/images/entities/char_2009.gif) 000 exceeds these values. One may speculate that such a cell thickness dependence is caused by strong anchoring of the molecules to the cell surfaces, which can prevent the collective fluctuations of dipoles near the cell surfaces. However, anchoring can cause significant suppression only in a thin cell, but not lead to a linear increase with the cell's thickness. A theoretical approach to explain this trend has been carried out by Guo et al.14 They collected Δε with the cell where the bent direction of the bent-shaped molecules lay perpendicular to the cell's surface by strong surface anchoring. In such a cell, it is speculated that a splay of polarization arises across its thickness that can induce the cell thickness dependence in Δε and fr in relation with the anchoring strength. Comparing the model and the experimental results, they have estimated the correlation length in the bulk and the surface to be approximately 10 and 1 μm, respectively.
000 exceeds these values. One may speculate that such a cell thickness dependence is caused by strong anchoring of the molecules to the cell surfaces, which can prevent the collective fluctuations of dipoles near the cell surfaces. However, anchoring can cause significant suppression only in a thin cell, but not lead to a linear increase with the cell's thickness. A theoretical approach to explain this trend has been carried out by Guo et al.14 They collected Δε with the cell where the bent direction of the bent-shaped molecules lay perpendicular to the cell's surface by strong surface anchoring. In such a cell, it is speculated that a splay of polarization arises across its thickness that can induce the cell thickness dependence in Δε and fr in relation with the anchoring strength. Comparing the model and the experimental results, they have estimated the correlation length in the bulk and the surface to be approximately 10 and 1 μm, respectively.
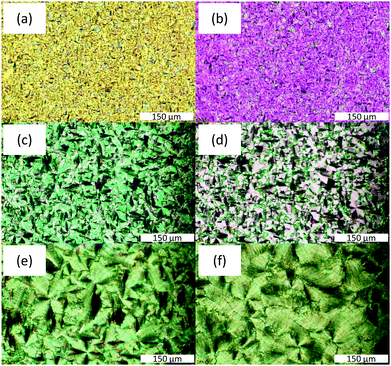
In our case, however, the molecular orientation reported by Guo et al.14 is unlikely. Fig. 5(a, c, and e) show the optical microscopic textures of the SmAPF phase in 3, 10, and 25 μm-thick cells, respectively. In all these cells, well-developed fan-shaped textures are observed, indicating the homogeneous alignment of the molecules, in other words, the alignment of the smectic layers perpendicular to the cell's surface. Fig. 5(b, d, and f) indicate the textures under DC bias fields. The textures do not change at all, but the birefringence colors change. This indicates that the bent (polar) direction of the molecules that are initially parallel to the cell's surface become perpendicular to it because of the ferroelectric response. On the basis of the retardation obtained from the general polarization color chart, the birefringence (Δn) is estimated to be 0.07 at 0 V μm−1 and 0.18 at 1 V μm−1, which are well expected from the parallelly and perpendicularly aligned models, respectively. In such a molecular alignment, the splay of polarization does not arise across the cell's thickness as reported by Guo et al.14
Fig. 5 shows the clear trend of the fan-shaped domain size increasing with the cell's thickness. Further, its average size roughly corresponds to the cell's thickness, meaning that the domain is uniform across the cell thickness. Thus, the coherence length of the molecular dipoles that cooperatively orient in the AC applied field increases with the increase of the cell's thickness. This increment, that is the increase of the number of molecules participating in the collective motion, may be responsible for the increase of Δε and the decrease of fr.
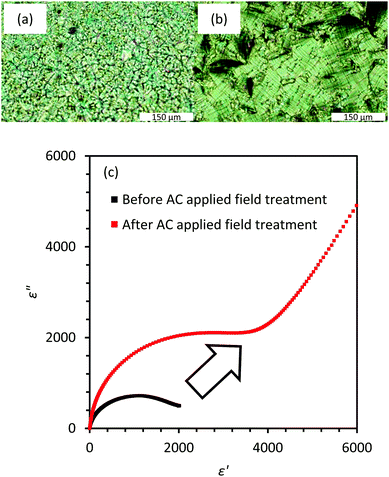
The close relationship between the domain size and Δε can be seen even in the same cell. The domain size of the SmAPF phase as-cooled from the isotropic melt is fairly small and, as mentioned above, grows under AC applied fields. The estimated Δε in the former cell is very small. Examples, as observed in a 25 μm-thick cell, are shown in Fig. 6. Δε is 1900 while it becomes 4500 after the AC field treatment.
The relationship between the cooperative motion of dipoles and Δε has been treated theoretically25 and experimentally.26,27 Kirkwood25 has extended Onsager theory by treating interacting dipoles, and has shown that Δε is proportional to
![[thin space (1/6-em)]](https://www.rsc.org/images/entities/char_2009.gif) θ〉 = 0.5. In a ferroelectric copolymer based on vinylidene cyanide, z = 30 and 〈cos
θ〉 = 0.5. In a ferroelectric copolymer based on vinylidene cyanide, z = 30 and 〈cos![[thin space (1/6-em)]](https://www.rsc.org/images/entities/char_2009.gif) θ〉 = 0.62 were elucidated to explain the high dielectric constant of 130.25 In analogy, we suppose that the huge Δε of the present molecular system may be attributable to the cooperative fluctuation of the large number of molecules z = ∼103 which increases with the increase of the domain size.
θ〉 = 0.62 were elucidated to explain the high dielectric constant of 130.25 In analogy, we suppose that the huge Δε of the present molecular system may be attributable to the cooperative fluctuation of the large number of molecules z = ∼103 which increases with the increase of the domain size.
The effect of DC bias fields on the Goldstone-like mode of the SmAPF phase was also studied. As shown in Fig. 7, by applying DC bias fields, the Goldstone-like mode is quickly quenched. As a result, the high frequency mode can be clearly detected at 100 kHz. The disappearance of the Goldstone-like mode is explained by the suppression of the dipoles’ fluctuation due to the DC bias fields. Here, a cell thickness dependence is also observed in the critical voltage that suppresses the Goldstone-like mode. The critical voltage is 0.40 V μm−1 for a 3 μm-thick cell, 0.14 V μm−1 for a 10 μm-thick cell, and 0.06 V μm−1 for a 25 μm-thick cell (refer to Fig. S4, ESI†). This trend is the same as that reported by Guo et al.14 but opposite to that reported by Shimbo et al.29
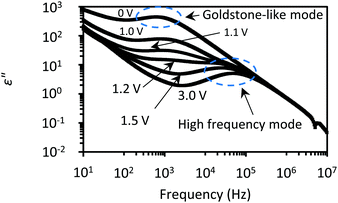 | ||
| Fig. 7 The imaginary (ε′′) part of the dielectric constants in the SmAPF phase measured under DC bias fields in a 3 μm-thick cell. Their values are presented on a log scale. The critical voltage is 1.2 V (0.40 V μm−1) in a 3 μm-thick cell. The small depression observed at 6.0 × 10⁶ Hz is the resonance effect due to the DC bias fields.28 | ||
Conclusions
The dielectric relaxation properties were studied for the SmAPF phase in a bent-shaped dimeric molecule mixture of 4OAM5AMO4 (forming the SmCAs phase) and 16OAM5AMO16 (forming the SmCAPA phase). Within a cell of the SmAPF phase, the bent-shaped dimeric molecules lie with their bent plane parallel to the surface. The SmAPF phase shows a Goldstone-like mode at approximately 500 Hz characteristic of the ferroelectric phase and a huge Δε of over 7000 in a 50 μm-thick cell, which is much higher compared to almost all the reported values in bent-shaped molecules. The highly cooperative orientation of the bent-shaped dimeric molecule is considered to bring about the giant value of Δε. It is also characteristic of the Goldstone-like mode that the cooperative fluctuation of dipoles is easily quenched under DC bias fields. The extremely large value of the dielectric constants of the ferroelectric bent-shaped dimeric molecules suggests high potential for application in highly processible elements in electromechanical energy conversion devices.Experimental
The mOAM5AMOm dimers with m values of 4 and 16 were synthesized following the methods reported in a previous report.7 The bent-shaped dimeric molecule mixture of 4OAM5AMO4 (65 mol%) + 16OAM5AMO16 (35 mol%) was prepared by evaporating a chloroform solution of the two molecules at a predetermined molar ratio.9 The phase transition temperatures were determined by DSC (SHIMADZU DSC-60 Plus) at a rate of 5 °C min−1 under cooling and heating runs. Texture observation and the identification of the mesophases were carried out using a polarizing optical microscope (OLYMPUS BX53) equipped with a hot stage and a temperature controller (Mettler Toledo FP 82HT). Electrooptical and dielectric investigations were performed using glass cells, having indium tin oxide (ITO) electrodes commercially available from EHC Co., Ltd. The area of the ITO electrodes was 100 mm2, and the cell thicknesses of the ITO electrodes were 3, 10, 25, and 50 μm. In these cells, the bent-shaped dimeric molecules was homogeneously aligned with the bent plane parallel to the cell plane. Before the measurements, AC applied fields of 33 and 5 Vpp μm−1 were applied to 16OAM5AMO16 and 4OAM5AMO4 (65 mol%) + 16OAM5AMO16 (35 mol%) for the growth of liquid crystals, respectively. The complex dielectric constants were measured in the frequency range between 101 and 107 Hz with an impedance analyzer (FRA51615). The electric field was 1 Vpp.Conflicts of interest
There are no conflicts to declare.Acknowledgements
The authors would like to thank Professor Hiroshi Funakubo (Tokyo Institute of Technology) for valuable discussion on the dielectric properties. The authors would also like to thank Professor Masatoshi Tokita (Tokyo Institute of Technology) for usage of a triangular wave field device. The authors would also like to thank Professor Hideki Hosoda (Tokyo Institute of Technology) for usage of a differential scanning calorimetry tool. This work is supported by LG × JXTG Nippon Oil & Energy Smart Materials & Devices Collaborative Research Programs.References
- J. Watanabe, Y. Nakata and K. Shimizu, Frustrated bilayer smectic phase in main-chain polymers with two different spacers, J. Phys. II, 1994, 4, 581–588 CrossRef CAS.
- T. Niori, T. Sekine, J. Watanabe, T. Furukawa and H. Takezoe, Distinct ferroelectric smectic liquid crystals consisting of banana shaped achiral molecules, J. Mater. Chem., 1996, 6, 1231–1233 RSC.
- J. Watanabe, M. Hayashi, Y. Nakata, T. Niori and M. Tokita, Smectic liquid crystals in main-chain polymers, Prog. Polym. Sci., 1997, 22, 1053–1087 CrossRef CAS.
- G. Pelzl, S. Diele and W. Weissflog, Banana-Shaped Compounds-A New Field of Liquid Crystals, Adv. Mater., 1999, 11, 707–724 CrossRef CAS.
- H. Takezoe and Y. Takanishi, Bent-core liquid crystals: their mysterious and attractive world, Jpn. J. Appl. Phys., 2006, 45, 597–625 CrossRef CAS.
- J. Watanabe, T. Izumi, T. Niori, M. Zennyoji, Y. Takanishi and H. Takezoe, Smectic mesophase properties of dimeric compounds. 2. Distinct formation of smectic structures with antiferroelectric ordering and frustration, Mol. Cryst. Liq. Cryst., 2000, 346, 77–86 CrossRef CAS.
- T. Izumi, S. Kang, T. Niori, Y. Takanishi, H. Takezoe and J. Watanabe, Smectic mesophase behavior of dimeric compounds showing antiferroelectricity, frustration and chirality, Jpn. J. Appl. Phys., 2006, 45, 1506–1514 CrossRef CAS.
- T. Izumi, Y. Naitou, M. Tokita and J. Watanabe, Frustrated smectic phase appearing as transitional state between single-layer and antiferroelectric bilayer smectic phases in binary mixtures of dimeric compounds, Jpn. J. Appl. Phys., 2006, 45, 4991–4993 CrossRef CAS.
- T. Izumi, Y. Naitou, Y. Shimbo, Y. Takanishi, H. Takezoe and J. Watanabe, Several types of bilayer smectic liquid crystals with ferroelectric and antiferroelectric properties in binary mixture of dimeric compounds, J. Phys. Chem. B, 2006, 110, 23911–23919 CrossRef CAS PubMed.
- J. Watanabe and S. Kinoshita, A distinct smectic C2 liquid crystal observed in main-chain liquid crystalline polymer, J. Phys. II, 1992, 2, 1237–1245 CrossRef CAS.
- R. A. Reddy, C. Zhu, R. Shao, E. Korblova, T. Gong, Y. Shen, E. Garcia, M. A. Glaser, J. E. Maclennan, D. M. Walba and N. A. Clark, Spontaneous ferroelectric order in a bent-core smectic liquid crystal of fluid orthorhombic layers, Science, 2011, 332, 72–77 CrossRef CAS PubMed.
- E. Gorecka, N. Vaupotic, and D. Pociecha, in Handbook of Liquid Crystals, ed. J. W. Goodby, P. J. Collings, T. Kato, C. Tschierske, H. F. Gleeson, and P. Raynes, Wiley-VCH Verlag GmbH & Co. KGaA., Germany, 2nd edn, 2014, vol. 13, pp. 1–33 Search PubMed.
- A. S. Tayi, A. Kaeser, M. Matsumoto, T. Aida and S. I. Stupp, Supramolecular ferroelectrics, Nat. Chem., 2015, 7, 281–294 CrossRef CAS PubMed.
- L. Guo, E. Gorecka, D. Pociecha, N. Vaupotič, M. Čepič, R. A. Reddy, K. Gornik, F. Araoka, N. A. Clark, D. M. Walba, K. Ishikawa and H. Takezoe, Ferroelectric behavior of orthogonal smectic phase made of bent-core molecules, Phys. Rev. E: Stat., Nonlinear, Soft Matter Phys., 2011, 84, 031706 CrossRef PubMed.
- C. Filipič, T. Carlsson, A. Levstik, B. Žekš, R. Blinc, F. Gouda, S. T. Lagerwall and K. Skarp, Dielectric properties near the smectic-C*–smectic-A phase transition of some ferroelectric liquid-crystalline systems with a very large spontaneous polarization, Phys. Rev. A: At., Mol., Opt. Phys., 1988, 38, 5833–5839 CrossRef PubMed.
- S. M. Khened, S. K. Prasad, B. Shivkumar and B. K. Sadashiva, Dielectric studies of Goldstone mode and soft mode in the vicinity of the A–C* transition, J. Phys. II, 1991, 1, 171–180 CrossRef CAS.
- K. Hiraoka, H. Takezoe and A. Fukuda, Dielectric relaxation modes in the antiferroelectric smectic CA* phase, Ferroelectrics, 1993, 147, 13–25 CrossRef CAS.
- J. Hatano, Y. Hanakai, H. Furue, H. Uehara, S. Saito and K. Murashiro, Phase sequence in smectic liquid crystals having fluorophenyl group in the core, Jpn. J. Appl. Phys., 1994, 33, 5498–5502 CrossRef CAS.
- K. S. Cole and R. H. Cole, Dispersion and absorption in dielectrics I, alternating current characteristics, J. Chem. Phys., 1941, 9, 341–351 CrossRef CAS.
- M. Marik, D. Jana, K. C. Majumder and B. K. Chaudhuri, Dielectric behavior in B1 and B2 phases composed of unsymmetrical bent shaped liquid crystal molecules, Mol. Cryst. Liq. Cryst., 2015, 606, 111–125 CrossRef CAS.
- S. A. Różański, Dielectric properties of liquid crystal formed by laterally fluorine-substituted banana-shaped molecules, Phase Transitions, 2018, 91, 1007–1016 CrossRef.
- J. Kumar and C. Prasad, Ferroelectric nematic and ferrielectric smectic mesophases in an achiral bent-core azo compound, J. Phys. Chem. B, 2018, 122, 2998–3007 CrossRef CAS PubMed.
- M. R. Fuente, D. Dunmur, in Handbook of Liquid Crystals, ed. J. W. Goodby, P. J. Collings, T. Kato, C. Tschierske, H. F. Gleeson, and P. Raynes, Wiley-VCH Verlag GmbH & Co. KGaA., Germany, 2nd edn, 2014, 4, 1–46 Search PubMed.
- M. Ozaki, K. Yoshino, T. Sakurai, N. Mikami and R. Higuchi, Dielectric properties of new stable ferroelectric liquid crystals with large spontaneous polarization, J. Chem. Phys., 1987, 86, 3648–3654 CrossRef CAS.
- J. G. Kirkwood, The dielectric polarization of polar liquids, J. Chem. Phys., 1939, 7, 911–919 CrossRef CAS.
- T. Furukawa, Nonlinear dielectric and conductive spectra of polymers, Makromol. Chem., Macromol. Symp., 1993, 70/71, 183–192 CrossRef.
- H. Ohigashi, K. Omote, H. Abe and K. Koga, Chain motions in the paraelectric phase in single crystalline films of vinylidene fluoride and trifluoroethylene copolymer P(VDF/TrFE), J. Phys. Soc. Jpn., 1999, 68, 1824–1827 CrossRef CAS.
- P. Perkowski, The parasitic effects in high-frequency dielectric spectroscopy of liquid crystals – the review, Liq. Cryst., 2021, 48, 767–793 CrossRef CAS.
- Y. Shimbo, E. Gorecka, D. Pociecha, F. Araoka, M. Goto, Y. Takanishi, K. Ishikawa, J. Mieczkowski, K. Gomola and H. Takezoe, Electric-Field-Induced Polar Biaxial Order in a Nontilted Smectic Phase of an Asymmetric Bent-Core Liquid Crystal, Phys. Rev. Lett., 2006, 97, 113901 CrossRef PubMed.
Footnote |
| † Electronic supplementary information (ESI) available. See DOI: 10.1039/d1ma00015b |
| This journal is © The Royal Society of Chemistry 2021 |


