 Open Access Article
Room-temperature ppb-level trimethylamine gas sensors functionalized with citric acid-doped polyvinyl acetate nanofibrous mats†
Aditya
Rianjanu
 *ab,
Rizky
Aflaha
c,
Nur Istiqomah
Khamidy
 a,
Mitra
Djamal
 d,
Kuwat
Triyana
 *c and
Hutomo Suryo
Wasisto
 *e
*e
aDepartment of Materials Engineering, Institut Teknologi Sumatera, Terusan Ryacudu, Way Hui, Jati Agung, Lampung 35365, Indonesia. E-mail: aditya.rianjanu@mt.itera.ac.id
bResearch and Innovation Center for Advanced Materials, Institut Teknologi Sumatera, Terusan Ryacudu, Way Hui, Jati Agung, Lampung 35365, Indonesia
cDepartment of Physics, Faculty of Mathematics and Natural Sciences, Universitas Gadjah Mada, Sekip Utara PO Box BLS 21, Yogyakarta 55281, Indonesia. E-mail: triyana@ugm.ac.id
dDepartment of Physics, Institut Teknologi Sumatera, Terusan Ryacudu, Way Hui, Jati Agung, Lampung 35365, Indonesia
ePT Nanosense Instrument Indonesia, Umbulharjo, Yogyakarta 55167, Indonesia. E-mail: h.wasisto@nanosense-id.com
First published on 14th April 2021
Abstract
Conventional chemoresistive gas sensors based on inorganic metal oxide semiconductors work typically at an elevated temperature (200–500 °C) to facilitate the chemical reaction between the target gas molecules and the sensing oxide layer. Besides their high operating temperature, these sensors are often found to possess poor selectivity towards a specific analyte. Here, we report on the fabrication and functionalization of electrospun citric acid-doped polyvinyl acetate (PVAc/CA) nanofibers on a quartz crystal microbalance (QCM) chip, which is used as a highly sensitive and selective gravimetric trimethylamine (TMA) gas sensor operating at room temperature. The structural morphology and chemical composition of both undoped and CA-doped PVAc nanofibers were investigated by scanning electron microscopy (SEM) and Fourier-transform infrared (FTIR) spectroscopy, respectively. During exposure to TMA vapors, the PVAc/CA nanofiber sensor could obtain a sensing sensitivity of 85.4 Hz ppm−1 with a limit of detection (LOD) of 19 ppb. Cross-sensitivity tests involving different analytes/gases (i.e., TMA, dimethylamine (DMA), methylamine (MA), ammonia, and water) revealed the high selectivity characteristic of the sensor towards TMA molecules. Besides, decent reversibility and repeatability of the sensor with response and recovery times of 7 and 20 s, respectively, were also demonstrated. Compared to the other recently reported QCM-based TMA gas sensors, the proposed device is superior in terms of sensitivity and LOD. This simple yet low-cost alternative improvement technique based on chemical modification of nanofibers can potentially be employed in food-freshness monitoring systems, especially for fishery and seafood products where TMA is used as their quality indicator (i.e., the primary marker of the fishy odor).
Introduction
The low molecular weight amine trimethylamine (TMA) has been extensively employed in organic synthesis and as an analytical reagent. It produces fishy and ammonia-like odors at low and high concentrations, respectively.1,2 The maximum allowable exposure duration to TMA is as low as 15 min with a concentration of <15 ppm.3 Otherwise, it becomes hazardous to humans, which can then cause several health problems (i.e., headache, breathing difficulty, pulmonary edema, nausea, and irritation of the upper respiratory system).3,4 Other than its direct inhalation possibility from the environment, TMA may also affect human health through unsafe foods, as it can be released from decayed meat and seafood products (i.e., foods that are no longer fresh).5,6 Thus, the need of a highly sensitive and rapid TMA detector at low concentration is indispensable.1,7Several sensing devices involving conductometric,1,7 optical,8 and gravimetric9,10 principles have been developed to monitor TMA concentration in real time. Similar to other environmental sensors based on resonant micro-/nanoelectromechanical systems (MEMS/NEMS) (e.g., vertical nanowire arrays, nanostructured piezoresistive microbeams, and silicon electrothermal microcantilevers), quartz crystal microbalance (QCM) sensing platforms operate in accordance to gravimetric detection.11–17 The resonance frequency of the crystal shifts to a lower value when the target analytes are adsorbed on the sensor surface.18,19 QCM transducers can be functionalized using a variety of coating materials with high sensitivity and selectivity.10,20 The QCM-based TMA sensors incorporating different sensing materials (polymers21–24 and metal oxides25–27) have been well studied, where they are preferably formed as nanostructures to enhance their specific-surface-area-to-volume ratios.19,28
Electrospun nanofibers made of various materials, both organic and inorganic, have been utilized as gas sensor active layers due to their unique physicochemical characteristics and low-cost production.29–33 Inorganic semiconductors often produced low selectivity despite their high responsivity and low power consumption.34–36 They also required to be operated at high temperatures (few hundred degrees Celsius) limiting their applications.37 Another approach based on integrated gallium nitride (GaN) light-emitting diodes (LEDs) was also introduced to activate the active layer for gas sensors at room temperature. Nonetheless, high-cost infrastructures and complex processing steps were required to realize the so-called micro-/nano-light platforms for gas detection.38,39 Thus, regardless of their degradation potential during long-term usage, different electrospun polymeric nanofibers and their composites have preferably been integrated in the current room-temperature gas sensors.40–42
Combining a QCM platform with specific and appropriate nanofiber active layers has been proven to effectively result in highly selective and sensitive gas sensing devices with low production cost.43,44 Suitable polymers must be pre-defined prior to the electrospinning process in order to achieve good sensing performance based on the target molecules. Our previous study demonstrated that the existence of carboxyl groups on the sensing surface of citric acid-doped polyvinyl acetate (PVAc/CA) nanofibers could enhance the QCM-based ammonia sensing ability.45 Due to the fact that the TMA molecules possess a similar chemical structure to ammonia molecules,46,47 they are expected to interact with the employed active layers in a comparable manner. Moreover, the resistance of PVAc/CA to high humidity has also been investigated.45
It is known that a high ambient humidity level (water vapor) may influence the frequency characteristics of a nanofiber-coated QCM gas sensor during TMA detection.48 However, its interfering effect was not as obvious as the sensing signal provided by TMA vapor. This is because the TMA molecules possess a larger molecular weight and a stronger positive inductive effect than their water counterparts.49 To mitigate the risk of having humidity interference, the polymer nanofiber-coated QCM sensors can be either placed in a well-controlled chamber or operated under stable ambient conditions (e.g., room temperature of (25 ± 1) °C and relative humidity of ∼30% RH). Furthermore, from our previous study, the PVAc/CA nanofibers demonstrated only 6% reduction, while PVAc nanofibers doped with oxalic and tartaric acids showed a significant humidity-related performance decrease in terms of frequency shifts (∼53%).45 Those results had proven that the PVAc/CA nanofiber sensors retained lower cross sensitivity against water molecules and were more selective to target gas (ammonia) molecules at high humidity levels (∼65% RH). Based on these advantages, in this work, we further explored the potential of using PVAc/CA nanofibers as highly sensitive and selective TMA detectors operating at room temperature. To enable sensing signal transduction, they were integrated with QCM chips. Besides, different CA doping concentrations were investigated to find out the optimum mixture composition of the nanofibers and enhance the sensor sensitivity.
Materials and methods
Nanofiber sensor fabrication
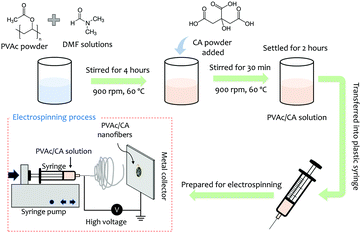
The nanofibers were deposited by an electrospinning technique, which is illustrated in Fig. 1.50,51 PVAc (Sigma-Aldrich, molecular weight (Mr) 500![[thin space (1/6-em)]](https://www.rsc.org/images/entities/char_2009.gif) 000 g mol−1) with a concentration of 15 wt% was mixed with citric acid (Merck) having different concentrations of 2, 4, 6, and 8 wt%. The mixture was then dissolved in N,N-dimethyl formamide (DMF) (Merck) and subsequently stirred at room temperature for 30 min at a stirring speed of 900 rpm to increase its solution homogeneity.
000 g mol−1) with a concentration of 15 wt% was mixed with citric acid (Merck) having different concentrations of 2, 4, 6, and 8 wt%. The mixture was then dissolved in N,N-dimethyl formamide (DMF) (Merck) and subsequently stirred at room temperature for 30 min at a stirring speed of 900 rpm to increase its solution homogeneity.
The precursor solution was electrospun on the QCM chip using a high voltage of 5 kV for 30 s with a tip-to-collector distance of 15 cm. We used the AT-Cut 10 MHz quartz crystal sandwiched between Au electrodes as the sensing chip from OpenQCM, Novaetech. The produced sensing platform was stored overnight before use. As this sensor works based on the gravimetric approach, the amount of the deposited nanofiber on the QCM chip can be estimated by monitoring its frequency change. The list of the fabricated sensing chips is presented in Table 1.
| Sensors | Added CA dopant concentration (wt%) | Frequency shift (Hz) | Mass of nanofiber film (ng) |
|---|---|---|---|
| PVAc/CA2 | 2 | −1043 | 1304 |
| PVAc/CA4 | 4 | −966 | 1208 |
| PVAc/CA6 | 6 | −1025 | 1281 |
| PVAc/CA8 | 8 | −2375 | 2969 |
The microstructural characterization of the prepared samples was carried out by means of scanning electron microscopy (SEM, JEOL JSM-6510). The infrared (IR) spectra of different materials (PVAc, CA, and PVAc/CA) were acquired using an 8201PC Shimadzu Fourier-transform infrared (FTIR) spectrometer.
Trimethylamine vapor sensing setup
For the sensing experiment, trimethylamine (TMA, Merck, 40%) was used as the target analyte. Fig. 2 illustrates the dynamic gas sensing setup to test the sensors.52,53 Four different nanofiber-coated QCMs (see Table 1) were placed inside a sealed chamber. A commercial temperature and humidity sensor (Sensirion SHT31 from Sensirion AG, Switzerland) was also equipped for humidity and temperature monitoring purposes. An oscillator and a frequency counter were used as the QCM frequency reading unit. The TMA vapor was obtained by vaporizing a small amount of TMA liquid into a sampling bag. We employed two sampling bags made of an aluminium foil composite with a volume capacity of 30 mL for the measurements. Both fresh ambient air and TMA vapors were injected into those bags. Here, the fresh ambient air acted as the carrier and dilution gas.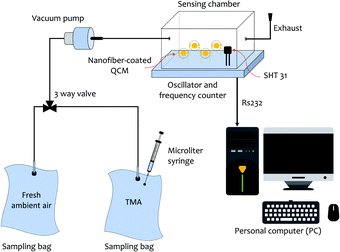 | ||
| Fig. 2 Illustration of the trimethylamine (TMA) vapor sensing configuration. Two sampling bags containing TMA vapors and fresh ambient air were used for the measurements. | ||
All vapor characterization experiments were performed under ambient conditions. The monitored temperature and relative humidity inside the chamber were (30 ± 1) °C and (65 ± 5)% RH, respectively. The TMA vapors inside one of the sampling bags were flown to the chamber during the sensing (response) measurement, while fresh ambient air was used for the purging (recovery) process. The concentration of TMA injected into the sampling bag using a 10 μL microliter syringe (Model 701 RN SYR, Hamilton Company, Bonaduz, Switzerland) was calculated in parts per million (ppm).54,55 The obtained frequency shifts of the QCM chips during their exposure to TMA vapors and fresh ambient air were recorded using a personal computer (PC).
Results and discussion
Nanofiber characteristics
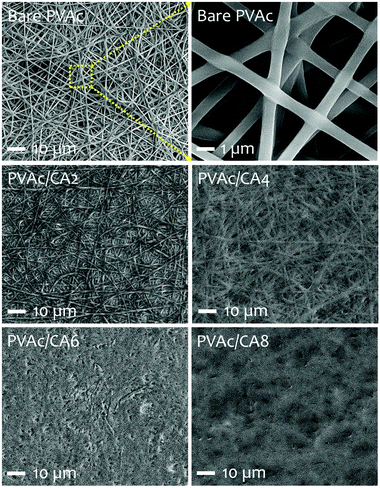
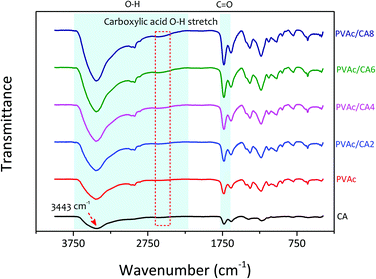
The scanning electron microscopy (SEM) images of the electrospun PVAc nanofibers prepared with different processing recipes (i.e., undoped and CA-doped samples) are shown in Fig. 3. Their detailed compositions concerning the added dopants are listed in Table 1. The morphological characteristics of nanofibers were analyzed to correlate with their sensing performance to TMA vapors. For the bare PVAc nanofibrous mats, smooth and continuous fiber morphologies with average structure diameters of 500–600 nm were found, which are similar to those in our previously fabricated undoped nanofibers.28,45,51 After introducing CA dopants into the PVAc solution, the as-spun nanofibers formed different structures. The PVAc/CA nanofibers became cross-linked with each other resulting in lumpy surfaces.45 The higher CA concentration led to more embedment of the fibers. From Table 1, the frequency shifts of QCM platforms affected by nanofiber loading were similar for three different samples (i.e., PVAc/CA2, PVAc/CA4, and PVAc/CA6), which range from 966 to 1043 Hz. The largest frequency shift obtained in the PVAc/CA8 sample (i.e., 2375 Hz) might be attributed to the imperfection of electrospinning deposition of the nanofibers, which consequently produced higher coating mass. Additionally, its CA dopant concentration during solution preparation was also at the highest value (8 wt%) compared to the other samples (2–6 wt%). A shift in the frequency reading of 1 Hz corresponds to a mass increase of ∼1.25 ng on the device electrode for the 10 MHz QCM. The deposited nanofiber mass values obtained from the Sauerbrey equation56,57 are presented in Table 1.To investigate the chemical composition of the as-prepared PVAc nanofibers before and after their modification with the CA dopant, Fourier-transform infrared (FTIR) spectroscopy analysis was carried out (see Fig. 4). In addition to the bare PVAc and doped PVAc/CA nanofibers, the pure CA was also investigated for comparison purpose. For the CA sample, it displayed a very broad peak in the region between 2500 and 3600 cm−1 with a peak at 3443 cm−1, which is assigned to O–H stretching. The peak that was observed at 1735 cm−1 can be ascribed to vibration of the C![[double bond, length as m-dash]](https://www.rsc.org/images/entities/char_e001.gif) O stretching mode in CA molecules.58 Meanwhile, for the FTIR spectrum of the PVAc sample, the characteristic peaks of O–H and C
O stretching mode in CA molecules.58 Meanwhile, for the FTIR spectrum of the PVAc sample, the characteristic peaks of O–H and C![[double bond, length as m-dash]](https://www.rsc.org/images/entities/char_e001.gif) O stretching vibration modes were detected at the peaks of 3425 and 1735 cm−1, respectively.59
O stretching vibration modes were detected at the peaks of 3425 and 1735 cm−1, respectively.59
By combining the CA dopant with the PVAc nanofibers, it was expected that the characteristics of these two materials should be jointly apparent in the spectra. This has been proven from our measurements, where the peaks observed in the spectra of PVAc/CA nanofibers were similar to those in the spectrum of the PVAc nanofiber. However, an additional signature peak of CA at 2620 cm−1 was also found, which is attributed to the O–H stretching vibration modes of carboxylic acid.60 It should be noted that this peak was not found in the spectrum of the bare PVAc nanofiber(see Fig. 4, red curve). Increasing the amount of CA dopants in PVAc nanofibers resulted in a more pronounced characteristic peak at 2620 cm−1, which is indicated by the spectra of PVAc/CA2 to PVAc/CA8 nanofiber samples. Thus, here, the correlation between the increasing amount of CA added into the PVAc nanofiber and the higher number of carboxyl groups on the sensing surface could be confirmed by the FTIR spectroscopy analysis.
Sensing performance
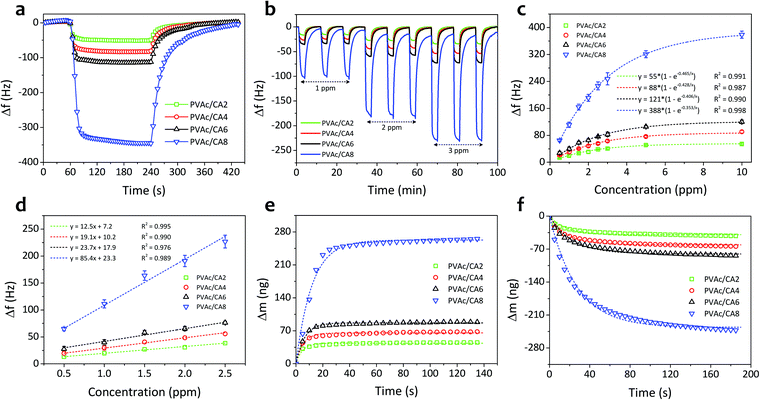
Fig. 5a shows the single-cycle dynamic characteristics of the as-prepared PVAc/CA nanofiber sensors under exposure to TMA vapors with a concentration of 10 ppm. The frequency of the nanofiber sensors shifted sharply when the TMA vapors were introduced to the chamber in the first few seconds and subsequently reached a steady level after 30 s operation. Then, after the sensing chamber had been flushed with clean air without TMA analytes, the sensor signals could be recovered reaching their initial baseline values. However, a longer time was observed during the recovery phase compared to that in the response phase. Moreover, higher amounts of CA added into the PVAc structures can result in stronger sensor signals. The PVAc/CA2 nanofiber sensor exhibited the lowest frequency shift (Δf) of 52 Hz (taken at t = 150 s after analyte exposure), while the highest sensor response of 345 Hz was achieved by the PVAc/CA8 nanofiber sensor.The dynamic responses of four PVAc/CA nanofiber sensors towards increasing TMA concentrations (i.e., 1–3 ppm) are depicted in Fig. 5b. Three full-cycle measurements of each TMA concentration were performed to provide a quantitative analysis of the sensing response. The frequency shift of the sensor was at a similar level during three-repeated exposure tests to the same vapor concentration, indicating its high sensing repeatability. Again, a larger frequency shift was obtained when the device was tested with higher TMA concentration. This behavior was observed for all the as-prepared nanofiber samples.
Fig. 5c displays the sensor frequency shifts corresponding to the increasing concentration of TMA (0.5–10 ppm). The experiments comprised three repeated measurements (n = 3) and their calculated standard deviations were expressed as the error bars. Similar to the trends demonstrated by other vapor sensors using polyethyleneimine/polyacrylonitrile nanofiber-coated QCMs19 and photoresist-coated silicon cantilevers,61 the frequency shift of all PVAc/CA sensors exhibited an exponential behavior rather than a simple linear trend with increasing TMA concentration. The critical concentration point was identified at around 3 ppm. Above this value, the frequency shift tended to reach a saturation level (steady state). We hypothesize that this behavior is due to the saturation of TMA molecules on the sensing layer surface. The data follow an exponential fitting with R2 values of 0.991, 0.987, 0.990 and 0.998 for PVAc/CA2, PVAc/CA4, PVAc/CA6, and PVAc/CA8 sensors, respectively. Previous findings from other groups also revealed a similar behavior when their polymer/QCM-based sensors were exposed to a wide range of TMA concentrations (i.e., 5–150 ppm).62,63
At lower vapor concentrations (i.e., 0.5–2.5 ppm), the correlation between the sensor frequency shift and TMA concentration appears to be linear (see Fig. 5d). Hence, this region is called the linear range of the sensors. The sensor frequency shift increases linearly with the increasing amount of TMA concentration with R2 values of 0.995, 0.990, 0.976 and 0.989 for PVAc/CA2, PVAc/CA4, PVAc/CA6, and PVAc/CA8 sensors, respectively, indicating high linearity. The sensor sensitivity for TMA vapor detection was defined as the slope of the linear fit in Fig. 5d. The sensor sensitivity values of 12.5, 19.1, 23.7, and 85.4 Hz ppm−1 were measured for PVAc/CA2, PVAc/CA4, PVAc/CA6, and PVAc/CA8 sensors, respectively. Here, it is proven that increasing the amount of added CA could enhance the sensor sensitivity to TMA vapors. Using the measured sensor sensitivity (S) and its standard deviation (SD) as input parameters, the other two important parameters (i.e., sensor limit of detection (LOD) and limit of quantification (LOQ)) were also calculated, which were defined as (3.3 × SD/S) and (10 × SD/S), respectively.64,65 The lowest LOD and LOQ values of 19 ppb and 58 ppb, respectively, were achieved by the PVAc/CA8 nanofiber sensor. All the important sensing parameters of four different nanofiber sensors (PVAc/CA2–PVAc/CA8) are listed in Table 2.
| Parameter | Sensor | |||
|---|---|---|---|---|
| PVAc/CA2 | PVAc/CA4 | PVAc/CA6 | PVAc/CA8 | |
| Sensitivity (Hz ppm−1) | 12.5 | 19.1 | 23.7 | 85.4 |
| Linear range (ppm) | 0.5–2.5 | 0.5–2.5 | 0.5–2.5 | 0.5–2.5 |
| Determination coefficient (R2) | 0.995 | 0.990 | 0.976 | 0.989 |
| Limit of detection (LOD) (ppb) | 132 | 86 | 70 | 19 |
| Limit of quantification (LOQ) (ppb) | 400 | 262 | 211 | 58 |
| Δm∞ adsorption process (ng) | 37 | 65 | 89 | 276 |
| Δm∞ desorption process (ng) | −37 | −63 | −87 | −263 |
Fig. 5e and f show the frequency shifts of the PVAc/CA nanofibrous sensors and their Langmuir fitting curves upon response (adsorption) and recovery (desorption) processes on the active layers, respectively, when exposed to 10 ppm TMA vapors. The Langmuir adsorption isotherm model was utilized to study the dynamic adsorption and desorption of TMA gas molecules on the sensor surface.65–68 It shows a well-fitted model indicated by the high determination coefficient (R2 > 0.947). The detailed values extracted from the fitting are presented in Table 2.
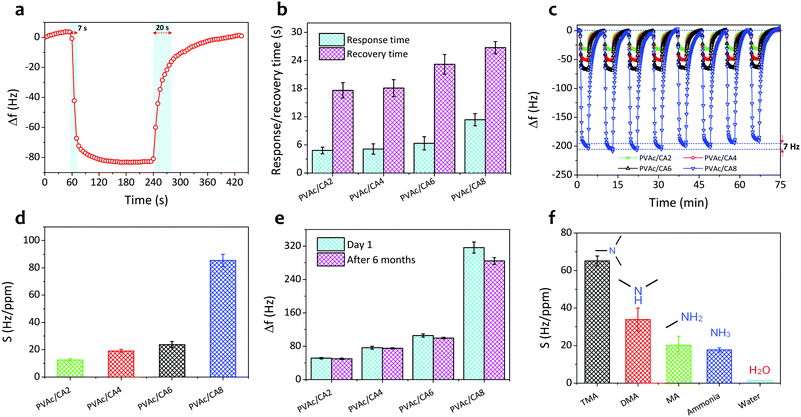
The response and recovery times can be defined as the relaxation time (t63) in the Langmuir fittings of both adsorption and desorption processes, respectively.66 Their values in one-cycle dynamic response of the PVAc/CA4 nanofibrous sensor exposed to 10 ppm TMA vapors are shown in Fig. 6a. The sensor yielded a shorter response time (7 s) than its recovery duration (20 s). These two parameters of the other nanofiber sensors (i.e., PVAc/CA2, PVAc/CA6, and PVAc/CA8) were also determined in a similar way as for the PVAc/CA4 sensor (see Fig. S1 in the ESI†). From Fig. 6b, it is found that increasing the amount of added CA dopants in the PVAc nanofibers results in longer response and recovery times of the as-prepared sensors. For instance, PVAc/CA8 possesses a slower response with a response time of 12.7 s, which is two times longer than that of PVAc/CA2 (i.e., 6.0 s).
The sensor repeatability was also investigated by performing multiple dynamic gas exposure tests. Fig. 6c displays eight-cycle dynamic responses of all four PVAc/CA nanofiber sensors exposed to 3 ppm TMA vapors. After one full cycle of the sensor signal (i.e., response and recovery processes) had been obtained and the signal value had returned to its baseline, the chamber was exposed again to the same TMA concentration. The frequency level in the consecutive measurements could reach a similar response level to that of the previous cycle. This procedure was repeated eight times, and the results are shown in Fig. 6c. These results demonstrated that the sensors produced highly repeatable sensing signals. For the PVAc/CA8 sensor, a frequency shift deviation of ∼7 Hz was found after eight cycles of measurements while responding to TMA vapors.
Fig. 6d shows the sensitivity values of the as-prepared nanofiber sensors. As the amount of the deposited nanofiber seems to influence the sensitivity, it is important to conduct sensitivity normalization. The normalization process was conducted to investigate the nanofiber mass deposition effect on the sensor sensitivity. The normalized sensitivity was calculated as the ratio between the measured sensor sensitivity (S) and the mass deposition factor (see Fig. S2 in the ESI†). Here, the mass deposition factor was obtained by dividing the deposited mass of each PVAc/CA nanofiber sample by that of the control sample. Choosing the PVAc/CA2 nanofiber sensor as the control sample, the mass deposition factors of 1.00, 0.92, 0.98, and 2.28 could then be calculated for PVAc/CA2, PVAc/CA4, PVAc/CA6, and PVAc/CA8 sensors, respectively. After being normalized, the sensor sensitivity was apparent to increase with the increasing amount of added CA.
To investigate the long-term stability behaviours of our PVAc/CA nanofiber sensors, we measured their frequency shifts after 6 months of storage and subsequently compared them to those obtained on the first measurement day (i.e., day 1). All four sensors were exposed to the same TMA concentration (5 ppm), and the results are depicted in Fig. 6e. The average frequency shift tended to decrease after 6 months of storage and use. The most significant degradation was observed for the PVAc/CA8 nanofiber sensor, whose performance degraded almost 10% compared to that in the initial measurement. From our previous studies, it has been proven that the reduction of the active membrane surface area caused by swelling of the nanofibers is responsible for sensor performance degradation after several months of storage and use.50,65Fig. 6f shows the cross-sensitivity of the PVAc/CA8 nanofiber sensor exposed to various analyte vapors. Besides TMA, we introduced dimethylamine (DMA), methylamine (MA), ammonia, and water to the test chamber. The sensor showed the highest and lowest sensitivity towards TMA and water molecules, respectively. This indicated that the PVAc/CA nanofiber sensor possessed very high sensitivity and selectivity to TMA vapors. Despite the interaction of the sensor with other analytes (DMA, MA, and ammonia), the corresponding sensitivity to these analytes was still lower than that of TMA.
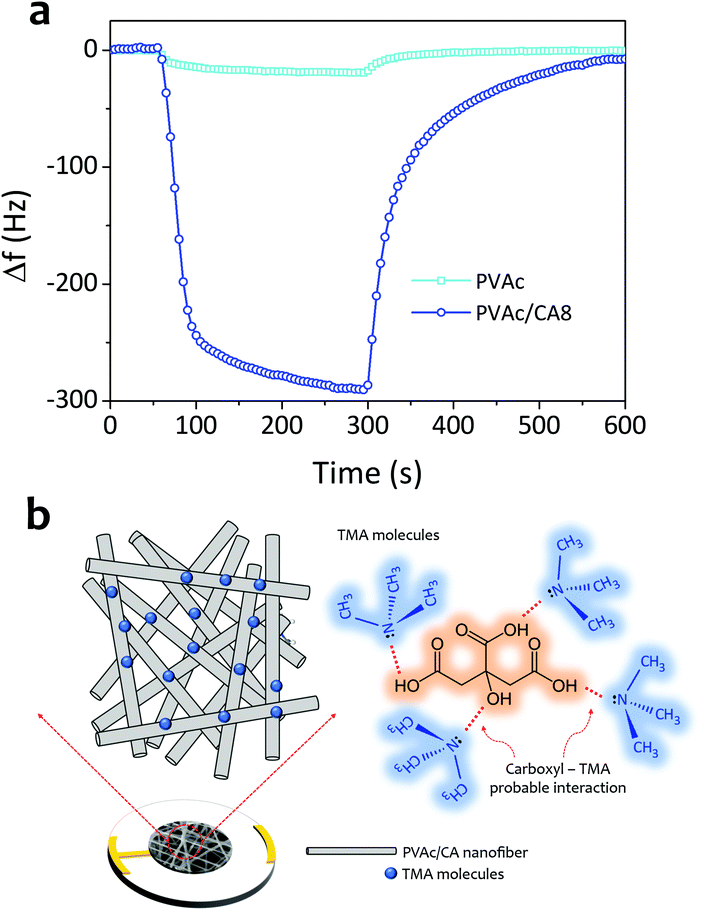
Based on all the measurement results, the sensing ability enhancement of the PVAc nanofiber for detecting TMA vapors by CA dopant addition has already been proven (see Fig. 7a). This has been indicated by the frequency shifts of the sensors coated with bare PVAc and PVAC/CA8 nanofibers that were measured to be 20 and 290 Hz, respectively, when they were exposed to 5 ppm TMA vapors. The sensing mechanism of the PVAc/CA active layer to TMA molecules is similar to that of the PVAc/CA membrane to ammonia molecules.45 This is due to the high chemical structure similarity between TMA and ammonia. The carboxyl part of the PVAc/CA nanofiber can also interact with the TMA molecules via reversible intermolecular Lewis acid–base interaction (see Fig. 7b).69,70 Rising the CA content in the PVAc/CA nanofiber increases the amount of the carboxyl parts on the surface-active layer. In the previous section, it has been shown that the sensor sensitivity to TMA can be enhanced by increasing the amount of CA added into the nanofibers (see Fig. 6d). Here, from three different tested CA doping concentrations (i.e., PVAc/CA2–PVAc/CA8), the PVAc/CA8 sensor exhibited the highest sensitivity and selectivity to TMA vapors. A higher amount of CA in the nanofiber provides more carboxyl active sites to interact with TMA molecules, which can result in a larger sensor frequency shift. Despite this positive trend, at this stage, the effect of using added CA dopants at concentrations higher than 8 wt% cannot be concluded. More experiments need to be carried out to justify the effect.
Nonetheless, during solution preparation for the electrospinning process, we have found that increasing the CA dopant concentration above 8 wt% would significantly limit the operation of the electrospinning machine. In other words, the nanofiber injection onto the QCM surface was difficult to be conducted and clear structural separation among nanofibers would hardly be produced. From Fig. 3, it is obvious that the crosslinking has been prominent in PVAC/CA8 nanofibers. As the electrospinning process of PVAc/CA8 was already hard to process, we decided not to further increase the CA concentration in our experiments.
In Fig. 6f, the PVAc/CA nanofiber is shown to better interact with TMA molecules compared to their ammonia counterparts, which can probably be due to the lower vapor pressure of TMA. A previous study suggested that lower vapor pressure analytes tend to show better adsorption compared to those with higher vapor pressure when they interact with the sensing active layer via a similar mechanism.65,72 Our work also confirms that increasing the amount of carboxyl groups on the surface-active layer will enhance the sensor sensitivity.47
The as-prepared QCM-based sensor integrated with PVAc/CA nanofibers shows high-performance TMA vapor sensing ability. Compared to the already developed QCM-based TMA sensors using other types of materials (i.e., polyaniline (PANI), PANI/titanium dioxide (TiO2), polyaniline/emeraldine base (PANI/EB), polyacrylic acid (PAA), graphene oxide (GO)/chitosan, and GO/cuprous oxide (Cu2O)) produced by the various deposition methods as active layers (see Table 3), our PVAc/CA nanofiber-based TMA sensor demonstrates outstanding performance, as it possesses the highest sensitivity value (85.4 Hz ppm−1) with a detection limit down to the ppb level (19 ppb). The only sensing material that could compete in terms of LOD was the GO/Cu2O nanocomposite.71 Others were limited to TMA detection at ppm levels.
| Sensing material | Deposition method | Linear range | Sensitivity | Limit of detection (LOD) | Ref. |
|---|---|---|---|---|---|
| PANI film | Drop-coating | 5–200 ppm | 1.20 Hz ppm−1 | 5 ppm | 22 |
| PANI/TiO2 nanocomposites | Deposition | 5–200 ppm | 2.09 Hz ppm−1 | 10 ppm | 23 |
| PANI/EB film | In situ film deposition | 2–25 mg L−1 | 38.07 Hz L mg−1 | 1 mg L−1 | 24 |
| PAA nano-nets | Electrospinning | 1–20 ppm | 2.74 Hz ppm−1 | 1 ppm | 62 |
| GO/chitosan nanocomposite | Syringe dispersion | 5–30 ppm | 4.8 Hz ppm−1 | 2.3 ppm | 63 |
| GO/Cu2O nanocomposite | Layer-by-layer self-assembly | 0.6–4.8 ppm | 8.91 Hz ppm−1 | 230 ppb | 71 |
| PVAc/CA nanofiber | Electrospinning | 0.5–2.5 ppm | 85.4 Hz ppm−1 | 19 ppb | This work |
Regardless of the promising TMA sensor performances based on the electrospun PVAc/CA nanofibers, this study contains only experimental results and their analysis. In other words, theoretical explanation for the sensing phenomenon is still lacking. Thus, there is a need for more theoretical analysis and deeper understanding of the gas sensing mechanism (molecule adsorption/desorption) based on simulations in future for our sensors. Either density functional theory (DFT) or molecular dynamics (MD) simulation can be opted in this case.73 Specifically, several DFT simulations of various gas sensors (e.g., ammonia, acetone, ethanol, and humidity sensors) have revealed that they could assist in analyzing the molecular adsorption energies of the active sensing nanomaterials (e.g., nanoparticles, nanowires, and nanofibers) and interfaces that correspond to the promotion and interaction with target gas molecules.74–77 Thus, they could be employed to provide a new insight into the selectivity improvement of gas sensors.77
Conclusions
Room-temperature TMA sensors comprising quartz crystal microbalance (QCM) platforms coated with citric acid-doped polyvinyl acetate (PVAc/CA) nanofibers have been successfully fabricated using a low-cost electrospinning method. The CA dopants inserted into the PVAc nanofibers have modified both structural and chemical characteristics of the active materials. A sensor sensitivity of up to 85.4 Hz ppm−1 could be obtained by the PVAc/CA8 nanofiber sensor with an outstanding detection limit of 19 ppb. To meet the selective sensing requirements, the cross-sensitivity tests have been carried out resulting in high selectivity of the sensor towards TMA vapors. The device also shows fast response and recovery times with highly reversible and repeatable sensor responses of up to eight full response–recovery cycles. The reversible intermolecular Lewis acid–base interaction between the TMA molecules and the carboxyl part of the sensing layer is believed to be responsible for the sensing mechanism. Compared to the already developed QCM-based TMA sensors, our proposed sensor is the most promising device, which then opens the feasibility to support the development of food safety analysis. In future work, the created sensing device needs to be tested in the real-time monitoring of food spoilage. Moreover, theoretical analysis shall be conducted to provide more insights into the physical phenomenon of the gas adsorption/desorption process.Author contributions
Aditya Rianjanu performed conceptualization, investigation, visualization, writing of original draft, and paper revision. Rizky Aflaha carried out investigation. Nur Istiqomah Khamidy and Mitra Djamal reviewed and edited the manuscript. Kuwat Triyana performed validation and funding acquisition. Hutomo Suryo Wasisto carried out conceptualization, investigation, validation, writing of original draft, paper revision, and funding acquisition. All authors confirmed the final manuscript.Conflicts of interest
The authors declare that there are no conflicts of interest.Acknowledgements
This work was partially funded by the Institut Teknologi Sumatera (ITERA), Republic of Indonesia, through the research scheme of “Hibah Penelitian ITERA 2021” under contract number B/509/IT9.C/PT.01.03/2021 and by the Ministry of Research, Technology and National Research Innovation Agency of the Republic of Indonesia (Kemenristek/BRIN) through the research scheme “Penelitian Terapan (PT) 2021”. Hutomo Suryo Wasisto acknowledges support from Shidiq Nur Hidayat, Trisna Julian, and Muhamad Iqbal Nuriyana for the research and development at PT Nanosense Instrument Indonesia. Hutomo Suryo Wasisto, Aditya Rianjanu, and Kuwat Triyana thank the Indonesian Ministry of Education and Culture (Kemendikbud) for providing them an opportunity to be involved in an excellent Indonesian diaspora platform of World-Class Scholar Symposium (Simposium Cendekia Kelas Dunia (SCKD)), which has led to the establishment of continuous collaboration between domestic and diaspora scientists for accelerating the transfer of science and technology and advancing research and development in Indonesia, especially in the fields of nanotechnology and sensors.References
- S. H. Park, B. Y. Kim, Y. K. Jo, Z. Dai and J. H. Lee, Sens. Actuators, B, 2020, 309, 127805 CrossRef CAS.
- Z. Li, H. Li, M. K. Lagasse and K. S. Suslick, Anal. Chem., 2016, 88, 5615–5620 CrossRef CAS PubMed.
- F. Zhang, X. Dong, X. Cheng, Y. Xu, X. Zhang and L. Huo, ACS Appl. Mater. Interfaces, 2019, 11, 11755–11762 CrossRef CAS PubMed.
- S. H. Lee, J. H. Lim, J. Park, S. Hong and T. H. Park, Biosens. Bioelectron., 2015, 71, 179–185 CrossRef CAS PubMed.
- C. E. Cho, S. Taesuwan, O. V. Malysheva, E. Bender, N. F. Tulchinsky, J. Yan, J. L. Sutter and M. A. Caudill, Mol. Nutr. Food Res., 2017, 61, 1–12 Search PubMed.
- J. Yu, T. Zhang, X. Gao, C. Xue, J. Xu and Y. Wang, RSC Adv., 2017, 7, 56655–56661 RSC.
- Y. Wang, S. Zhang, C. Huang, F. Qu, D. Yao, H. Guo, H. Xu, C. Jiang and M. Yang, Dalton Trans., 2021, 50, 970–978 RSC.
- F. Lai, J. Yang, R. Huang, Z. Wang, J. Tang, M. Zhang, R. Miao and Y. Fang, ACS Appl. Nano Mater., 2021, 4, 2575–2582 CrossRef CAS.
- C. Qu, P. Zhao, C. Wu, Y. Zhuang, J. Liu, W. Li, Z. Liu and J. Liu, Sens. Actuators, B, 2021, 338, 129822 CrossRef CAS.
- S. Dasgupta, B. Ghatak, S. Banerjee, S. B. Ali, J. Dei, B. K. Behera, R. B. Roy and B. Tudu, 2020 International Conference on Emerging Frontiers in Electrical and Electronic Technologies (ICEFEET), IEEE, 2020, pp. 1–4 Search PubMed.
- H. Tai, S. Wang, Z. Duan and Y. Jiang, Sens. Actuators, B, 2020, 318, 128104 CrossRef CAS.
- H. Tai, Z. Duan, Y. Wang, S. Wang and Y. Jiang, ACS Appl. Mater. Interfaces, 2020, 12, 31037–31053 CrossRef CAS PubMed.
- H. S. Wasisto, S. Merzsch, A. Waag, E. Uhde, T. Salthammer and E. Peiner, Sens. Actuators, B, 2013, 180, 77–89 CrossRef CAS.
- H. S. Wasisto, F. Steib, S. Merzsch, A. Waag and E. Peiner, Micro Nano Lett., 2014, 9, 676–679 CrossRef.
- H. S. Wasisto, S. Merzsch, A. Stranz, A. Waag, E. Uhde, T. Salthammer and E. Peiner, IEEE Nanotechnol. Mag., 2013, 7, 18–23 Search PubMed.
- H. S. Wasisto, E. Uhde and E. Peiner, Build. Environ., 2016, 95, 13–20 CrossRef.
- H. S. Wasisto, Q. Zhang, S. Merzsch, A. Waag and E. Peiner, Microsyst. Technol., 2014, 20, 559–569 CrossRef CAS.
- T. Julian, S. N. Hidayat, A. Rianjanu, A. B. Dharmawan, H. S. Wasisto and K. Triyana, ACS Omega, 2020, 5, 29492–29503 CrossRef CAS PubMed.
- A. Rianjanu, T. Julian, S. N. Hidayat, N. Yulianto, N. Majid, I. Syamsu, H. S. Wasisto and K. Triyana, Sens. Actuators, B, 2020, 319, 128286 CrossRef CAS.
- A. Sanaeifar, H. ZakiDizaji, A. Jafari and M. de la Guardia, TrAC, Trends Anal. Chem., 2017, 97, 257–271 CrossRef CAS.
- R. Das, R. Bandyopadhyay and P. Pramanik, Mater. Chem. Phys., 2019, 226, 214–219 CrossRef CAS.
- G. Li, J. Zheng, X. Ma, Y. Sun, J. Fu and G. Wu, Sensors, 2007, 7, 2378–2388 CrossRef CAS PubMed.
- J. Zheng, G. Li, X. Ma, Y. Wang, G. Wu and Y. Cheng, Sens. Actuators, B, 2008, 133, 374–380 CrossRef CAS.
- M. M. Ayad and N. L. Torad, Sens. Actuators, B, 2010, 147, 481–487 CrossRef CAS.
- W. Chen, Z. Wang, S. Gu, J. Wang, Y. Wang and Z. Wei, Sens. Actuators, B, 2020, 306, 127579 CrossRef CAS.
- V. Mounasamy, G. K. Mani, D. Ponnusamy, K. Tsuchiya, A. K. Prasad and S. Madanagurusamy, Ceram. Int., 2019, 45, 19528–19533 CrossRef CAS.
- Z. Ma, P. Song, Z. Yang and Q. Wang, Appl. Surf. Sci., 2019, 465, 625–634 CrossRef CAS.
- R. Roto, A. Rianjanu, I. A. Fatyadi, A. Kusumaatmaja and K. Triyana, Sens. Actuators, A, 2020, 304, 111902 CrossRef CAS.
- Y. Zhang, Z. Duan, H. Zou and M. Ma, Mater. Lett., 2018, 215, 58–61 CrossRef CAS.
- H. Tai, Z. Duan, Z. He, X. Li, J. Xu, B. Liu and Y. Jiang, Sens. Actuators, B, 2019, 298, 126874 CrossRef CAS.
- E. Schoolaert, R. Hoogenboom and K. De Clerck, Adv. Funct. Mater., 2017, 27, 1–26 Search PubMed.
- Y. Li, M. A. Abedalwafa, L. Tang, D. Li and L. Wang, Electrospinning: Nanofabrication and Applications, Elsevier, 2019, pp. 571–601 Search PubMed.
- J. Xue, J. Xie, W. Liu and Y. Xia, Acc. Chem. Res., 2017, 50, 1976–1987 CrossRef CAS PubMed.
- L. Utari, N. L. W. Septiani, N. Suyatman, L. O. Nur, H. S. Wasisto and B. Yuliarto, IEEE Access, 2020, 8, 49169–49179 Search PubMed.
- A. Gad, M. W. G. Hoffmann, O. Casals, L. Mayrhofer, C. Fàbrega, L. Caccamo, F. Hernández-Ramírez, M. S. Mohajerani, M. Moseler, H. Shen, A. Waag and J. D. Prades, ACS Sens., 2016, 1, 1256–1264 CrossRef CAS.
- O. Casals, N. Markiewicz, C. Fabrega, I. Gràcia, C. Cané, H. S. Wasisto, A. Waag and J. D. Prades, ACS Sens., 2019, 4, 822–826 CrossRef CAS PubMed.
- C. Fàbrega, O. Casals, F. Hernández-Ramírez and J. D. Prades, Sens. Actuators, B, 2018, 256, 797–811 CrossRef.
- H. S. Wasisto, J. D. Prades, J. Gülink and A. Waag, Appl. Phys. Rev., 2019, 6, 041315 Search PubMed.
- N. Yulianto, G. T. M. Kadja, S. Bornemann, S. Gahlawat, N. Majid, K. Triyana, F. F. Abdi, H. S. Wasisto and A. Waag, ACS Appl. Electron. Mater., 2021, 3, 778–788 CrossRef CAS.
- S. Wang, B. Liu, Z. Duan, Q. Zhao, Y. Zhang, G. Xie, Y. Jiang, S. Li and H. Tai, Sens. Actuators, B, 2021, 327, 128923 CrossRef CAS.
- Z. Pang, E. Yildirim, M. A. Pasquinelli and Q. Wei, ACS Omega, 2021, 6, 8950–8957 CrossRef CAS PubMed.
- N. Z. Al-Hazeem, N. M. Ahmed, M. Z. Matjafri and M. Bououdina, Microsyst. Technol., 2021, 27, 293–299 CrossRef CAS.
- N. L. Torad, S. Zhang, W. A. Amer, M. M. Ayad, M. Kim, J. Kim, B. Ding, X. Zhang, T. Kimura and Y. Yamauchi, Adv. Mater. Interfaces, 2019, 6, 1900849 CrossRef.
- B. Ding, M. Wang, X. Wang, J. Yu and G. Sun, Mater. Today, 2010, 13, 16–27 CrossRef CAS.
- R. Roto, A. Rianjanu, A. Rahmawati, I. A. Fatyadi, N. Yulianto, N. Majid, I. Syamsu, H. S. Wasisto and K. Triyana, ACS Appl. Nano Mater., 2020, 3, 5687–5697 CrossRef CAS.
- Y. H. Park, K. J. Choi, J. Y. Bae, S. K. Yoon, H. I. Jang and C. S. Lee, J. Ind. Eng. Chem., 2013, 19, 1703–1707 CrossRef CAS.
- Y. Hu, H. Yu, Z. Yan and Q. Ke, RSC Adv., 2018, 8, 8747–8754 RSC.
- W. Chen, F. Deng, M. Xu, J. Wang, Z. Wei and Y. Wang, Sens. Actuators, B, 2018, 273, 498–504 CrossRef CAS.
- W. Chen, F. Deng, M. Xu, J. Wang, Z. Wei and Y. Wang, Sens. Actuators, B, 2018, 273, 498–504 CrossRef CAS.
- A. Rianjanu, E. Nurfani, M. F. Arif, K. Triyana and H. S. Wasisto, Mater. Today Commun., 2021, 26, 101770 CrossRef CAS.
- K. Triyana, A. Rianjanu, D. B. Nugroho, A. H. As’ari, A. Kusumaatmaja, R. Roto, R. Suryana and H. S. Wasisto, Sci. Rep., 2019, 9, 15407 CrossRef PubMed.
- R. Hu, K. Zhang, G. Fan, Z. Luo and G. Li, Meas. Sci. Technol., 2015, 26, 1–7 CrossRef CAS.
- K. Zhang, R. Hu, G. Fan and G. Li, Sens. Actuators, B, 2017, 243, 721–730 CrossRef CAS.
- X. Wang, F. Cui, J. Lin, B. Ding, J. Yu and S. S. Al-Deyab, Sens. Actuators, B, 2012, 171–172, 658–665 CrossRef CAS.
- W. Huang, X. Wang, Y. Jia, X. Li, Z. Zhu, Y. Li, Y. Si, B. Ding, X. Wang and J. Yu, RSC Adv., 2013, 3, 22994 RSC.
- G. Sauerbrey, Zeitschrift für Phys., 1959, 155, 206–222 CrossRef CAS.
- E. Haghighi and S. Zeinali, Microporous Mesoporous Mater., 2020, 300, 110065 CrossRef CAS.
- S. Khan, Z. H. Shah, S. Riaz, N. Ahmad, S. Islam, M. A. Raza and S. Naseem, Ceram. Int., 2020, 46, 10942–10951 CrossRef CAS.
- H. G. Jeong, Y. E. Kim and Y. J. Kim, Macromol. Res., 2013, 21, 1233–1240 CrossRef CAS.
- H. L. Lin, P. C. Hsu and S. Y. Lin, Asian J. Pharm. Sci., 2013, 8, 19–27 CrossRef CAS.
- H. S. Wasisto, S. Merzsch, A. Waag, E. Uhde, T. Salthammer and E. Peiner, Sens. Actuators, A, 2013, 202, 90–99 CrossRef CAS.
- X. Wang, B. Ding, J. Yu, Y. Si, S. Yang and G. Sun, Nanoscale, 2011, 3, 911–915 RSC.
- K. Zhang, R. Hu, G. Fan and G. Li, Sens. Actuators, B, 2017, 243, 721–730 CrossRef CAS.
- G. L. Long and J. D. Winefordner, Anal. Chem., 1983, 55, 712A–724A CrossRef CAS.
- A. Rianjanu, K. Triyana, D. B. Nugroho, A. Kusumaatmaja and R. Roto, Sens. Actuators, A, 2020, 301, 111742 CrossRef CAS.
- D. B. Nugroho, A. Rianjanu, K. Triyana, A. Kusumaatmaja and R. Roto, Results Phys., 2019, 15, 102680 CrossRef.
- A. Bayram, C. Özbek, M. Şenel and S. Okur, Sens. Actuators, B, 2017, 241, 308–313 CrossRef CAS.
- N. Horzum, D. Tascioglu, C. Ozbek, S. Okur and M. M. Demir, New J. Chem., 2014, 38, 5761–5768 RSC.
- Y. Jia, H. Yu, J. Cai, Z. Li and F. Dong, Sens. Actuators, B, 2017, 243, 1042–1045 CrossRef CAS.
- Y. Jia, H. Yu, Y. Zhang, F. Dong and Z. Li, Colloids Surf., B, 2016, 148, 263–269 CrossRef CAS PubMed.
- W. Chen, F. Deng, M. Xu, J. Wang, Z. Wei and Y. Wang, Sens. Actuators, B, 2018, 273, 498–504 CrossRef CAS.
- A. Rianjanu, D. B. Nugroho, A. Kusumaatmaja, R. Roto and K. Triyana, Sens. Bio-Sensing Res., 2019, 25, 100294 CrossRef.
- M. R. Mananghaya, Mater. Chem. Phys., 2020, 240, 122159 CrossRef CAS.
- L. Tang, W. Chen, B. Chen, R. Lv, X. Zheng, C. Rong, B. Lu and B. Huang, Sens. Actuators, B, 2021, 327, 128944 CrossRef CAS.
- L. Song, K. Dou, R. Wang, P. Leng, L. Luo, Y. Xi, C.-C. Kaun, N. Han, F. Wang and Y. Chen, ACS Appl. Mater. Interfaces, 2020, 12, 1270–1279 CrossRef CAS PubMed.
- H. Du, W. Yang, W. Yi, Y. Sun, N. Yu and J. Wang, ACS Appl. Mater. Interfaces, 2020, 12, 23084–23093 CrossRef CAS PubMed.
- W. Wei, W. Li and L. Wang, Sens. Actuators, B, 2018, 263, 502–507 CrossRef CAS.
Footnote |
| † Electronic supplementary information (ESI) available. See DOI: 10.1039/d1ma00152c |
| This journal is © The Royal Society of Chemistry 2021 |

